Service Need and Older Adults 142
Journal of Human Sciences and Extension Volume 7, Number 3, 2019
Indicators of Supportive Service Need Among
Older Adults in Mississippi
Joshua J. Turner Utah State University Carolyn E. Adams-Price
Joe D. Wilmoth Mississippi State University
Providing quality services is one of the challenges associated with the continued increase in the nation’s older adult population. Effective use of needs assessment data can be useful in assessing service need. This study measures the level of perceived need for supportive services among older adults in Mississippi. Using statewide needs assessment data, this study applies the Behavioral Model to measure the perceived need for supportive services among survey participants aged 60 and older (N = 838). Results indicate that age, race, physical health, and subjective well-being were consistent predictors of perceived need for supportive services. Results suggest the importance of understanding the factors associated with the perceived need for supportive services to more effectively plan service delivery.
Keywords: older adults, perceived service need, Behavioral Model, pre-disposing variables, enabling variables, health need variables
Introduction
Providing quality services is one of the many challenges associated with the continued increase in the nation’s older adult population. Services for older adults are generally designed to help them remain independent, reflecting the strong preference most have for remaining in their homes and communities (Eckert, Morgan, & Swamy, 2004). Considering the inevitable increase in the number of older adults (Vincent & Velkoff, 2010), it is reasonable to assume that demand for services designed to facilitate independent living for older adults will show a significant increase (Chen & Berkowitz, 2012). Targeting services to the appropriate groups is challenging, due to a lack of service awareness, as well as affordability and funding concerns (Li, 2006).
Needs assessment data can be useful in assessing the need for services for older adults (Beverly, Mcatee, Costello, Chernoff, & Casteel, 2005; Calsyn, Roades, & Klinkenberg, 1998). With this information, program planners can allocate resources for older adults more efficiently and tailor services to their specific target population (Chen, Thompson, Berkowitz, Young, & Ward, 2011).
This is especially important with the changing composition of the older adult population, which is becoming more racially diverse and increasingly rural (Cromartie & Nelson, 2009; Jones, Kandel, & Parker, 2007; Vincent & Velkoff, 2010).
One of the advantages of traditional needs assessment surveys is their ability to collect a wide range of information. With the information derived from needs assessment surveys, specific theoretical models can be tested in an attempt to predict and ultimately explain the relationships between individual characteristics and the need for and possible utilization of supportive
services. One such theoretical model found to be very reliable in testing the relationships between individual characteristics and service need is the Behavioral Model (Andersen, 1968).
The strength of the Behavioral Model approach lies in its multiple practical implications. By assessing the level of perceived need for supportive services, the Behavioral Model can be utilized to identify which groups have higher levels of service need. The traditional factors of the Behavioral Model (pre-disposing, enabling, and health need variables) can also be used for constructing client profiles by illustrating which types of individuals may be more likely to ultimately utilize services. An approach such as this, which concentrates on a potential client base could aid program planners in more effectively organizing the provision of appropriate services (Calsyn et al., 1998).
The purpose of this study is to measure the level of perceived need for supportive services among older adults in Mississippi. Using data from a statewide needs assessment, this study applied the Behavioral Model (Andersen, 1995; Andersen & Newman, 2005) to explain which of the model’s three traditional factors: (a) pre-disposing variables, which refer to demographic and socioeconomic characteristics, (b) enabling variables, which are related to the logistical aspects of obtaining care, and (c) health need variables, which pertain to perceived (self-reported) or evaluated (professionally diagnosed) health needs of an individual (Andersen & Newman, 2005), best predicted perceived need for supportive services.
In focusing on Mississippi, this study provides an opportunity to contribute to the existing body of work on this topic by looking at a predominately rural state with a significant minority population. Such a study is timely due to the increase in diversity among older adults, with population projections predicting that the proportion of older adults from minority groups will account for approximately 28% of the older adult population by the year 2030 (Administration for Community Living, 2018). It is well documented that older adults from minority groups are more likely to experience higher rates of disability and chronic illness (Clark, 1997; Moody-Ayers, Mehta, Lindquist, Sands, & Covinsky, 2005; Seeman, Merkin, Crimmins, &
Karlamangla, 2010), suggesting that the long-term health care needs of minority groups will continue to be a concern (Bradley et al., 2002).
Service Need and Older Adults 144
Journal of Human Sciences and Extension Volume 7, Number 3, 2019
adults typically are in greater need of assistance (Li, 2006; Schulenberg & Coward, 1998; Sun, 2011). We argue that identifying factors associated with the perceived need for supportive services among older adults can assist caregivers, policymakers, and service providers in the development, planning, and provision of supportive service programs for older adults.
Literature Review
Benefits of Services for Older Adults
Most supportive services designed for older adults fall under the guise of Home- and
community-based services (HCBS). These services are designed to provide assistance to older adults with daily activities in their home or community as opposed to institutional settings (Siegler, Lama, Knight, Laureano, & Reid, 2015; U.S. Department of Health and Human Services, 2017). These services focus on but are not limited to in-home care, home-delivered meals, transportation services, and referral services (Kassner, 2011). Such services are
instrumental in helping older adults remain independent in their homes and communities (Ferris, Glicksman, & Kleban, 2014). Multiple studies have found that older adults with unmet service needs are more susceptible to poor health, higher rates of health service use, and placement in assisted living facilities (Chen & Thompson, 2010; Desai, Lentzner, & Weeks, 2001;Komisar, Feder, & Kasper, 2005). Conversely, the ability to access supportive services has been shown to promote healthy lifestyles in older adults, while reducing health care costs (Felix, Mays, Stewart, Cottoms, & Olson, 2011; Grabowski, 2006; Shapiro, Loh, & Mitchell, 2011).
Perceived Need for Services
A major predictor of the probability of seeking services is the individual’s perceived need for services (Chen et al., 2011). Traditionally, perceived service need measures ask respondents to report their level of need for services regardless of whether they are currently receiving services (Calsyn & Winter, 2001). Perceived need for services is associated with illness or aging-related functional disabilities (Chen et al., 2011). Levels of subjective well-being and self-reported health also are strong predictors of perceived need (Calsyn et al., 1998).
The Behavioral Model
The Behavioral Model is one of the most widely applied theoretical models used to predict the need for and utilization of supportive services (Andersen, 1968). Originally developed to explain which conditions predict, facilitate, or impede the utilization of medical services, this model has grown in utility. As a result, its focus has been expanded to predict perceived and unmet service needs (Calsyn et al., 1998; Calsyn & Winter, 2001).
demographic and socioeconomic characteristics that exist prior to the onset of service utilization (Andersen & Newman, 2005). Enabling variables are related to the logistical aspects of
obtaining care and the means that make utilization possible, including income and family support (Andersen & Newman, 2005). Health need variables are often the strongest predictors of service need. The Behavioral Model breaks health needs into two categories: perceived and evaluated. Perceived need refers to self-reported health problems. In contrast, evaluated need refers to symptoms observed through professional diagnoses (Andersen & Newman, 2005).
The Behavioral Model and Older Adults
Several studies have applied the Behavioral Model when examining the service needs of older adults (Beverly et al., 2005; Bookwala et al., 2004; Calsyn & Roades, 1994; Chen & Thompson, 2010; Sun, 2011). The work of Calsyn et al. (1998) and Calsyn and Winter (2001) in particular relates well to the current study in its ability to identify multiple variables that predicted service need, most notably health factors, race, and income. These studies also found that health factors were the strongest predictors of perceived service need.
The works of Park et al. (2010) and Mattson (2011) serve as examples of how the Behavioral Model can be used to predict the needs for supportive services among older adults. These studies also examine the model’s potential for constructing a client profile and the challenges of delivering services in nonmetropolitan settings. In their study of the self-reported difficulties of rural older adults in Alabama, Park et al. (2010) examined the differences between Whites and African Americans. The study found that African Americans were more likely to report difficulties in accessing services. However, race alone was not the only predictor of self-reported difficulties, as factors such as age, gender, income, and depression also were found to be predictors of self-reported difficulties in accessing services (Park et al., 2010).
Mattson (2011) utilized the Behavioral Model to look at how pre-disposing characteristics could be used to predict the transportation needs of older adults in North Dakota, particularly as it related to physical limitations, mobility, and the use of public transportation in rural and small urban areas. Findings from this study indicated that older adults with physical disabilities expressed difficulty with public transportation. The study also found that women were more likely to utilize public transportation services than men (Mattson, 2011).
The Present Study
Service Need and Older Adults 146
Journal of Human Sciences and Extension Volume 7, Number 3, 2019
1) Increases in age will be associated with increases in perceived need for supportive services.
2) Older adults from minority groups will express higher levels of perceived need for supportive services.
3) Higher levels of self-reported physical health problems will be associated with higher levels of perceived need for supportive services.
4) Higher levels of subjective well-being will be associated with lower levels of perceived need for supportive services.
Methodology
Data Source
Data were collected through a telephone survey of Mississippi adults aged 55 and older. This study included survey participants who were at least 60 years old at the time of the survey, which is typically the minimum age to be considered eligible for supportive services (Sonnega,
Robinson, & Levy, 2017). Survey items focused on a variety of topics, including health status, daily activities, quality of life issues, and service need. The service lists presented to participants were constructed through consultation with the state’s department of aging services.
Study Sample
The sample was drawn and stratified based on the organization of the state’s 10 Area Agencies on Aging. Overall, 1,025 surveys were completed, with at least 100 completed surveys coming from each of the state’s 10 Area Agencies on Aging. Household telephone numbers were selected using random-digit-dialing (RDD) sampling procedures. After drawing the subset of those aged 60 and older, the sample consisted of 838 cases for analysis.
Measures
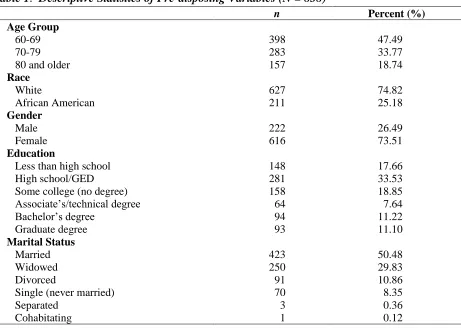
Pre-disposing variables. Five pre-disposing variables, (a) age, (b) race, (c) gender, (d)
education, and (e) marital status, were used to predict participants’ perceived need for services. Table 1 provides descriptive statistics for these variables. Age was treated as a continuous variable. In terms of race, participants were grouped into two categories: White (assigned a code of “0”) and African American (assigned a code of “1”). For gender, females were assigned a code of “0,” and males were assigned a code of “1.” Education was separated into six categories based on the highest level of education completed. Those participants assigned a code of “1” had less than a high school education, while participants assigned a code of “6” had completed a graduate degree. Finally, marital status was grouped into two categories. Those who indicated they were married were assigned a code of “1” while all other marital statuses, which included widowed, divorced, single, separated, and cohabitating, were assigned a code of “0.”
Table 1. Descriptive Statistics of Pre-disposing Variables (N = 838)
n Percent (%)
Age Group
60-69 398 47.49
70-79 283 33.77
80 and older 157 18.74
Race
White 627 74.82
African American 211 25.18
Gender
Male 222 26.49
Female 616 73.51
Education
Less than high school 148 17.66
High school/GED 281 33.53
Some college (no degree) 158 18.85
Associate’s/technical degree 64 7.64
Bachelor’s degree 94 11.22
Graduate degree 93 11.10
Marital Status
Married 423 50.48
Widowed 250 29.83
Divorced 91 10.86
Single (never married) 70 8.35
Separated 3 0.36
Cohabitating 1 0.12
Service Need and Older Adults 148
Journal of Human Sciences and Extension Volume 7, Number 3, 2019
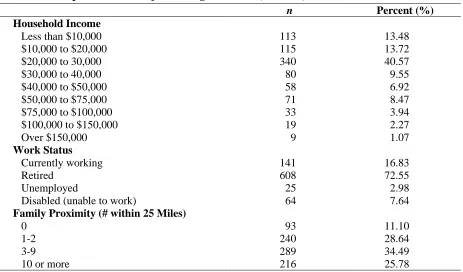
miles of the survey participant. Participants with no family members living within 25 miles of their residence were assigned a code of “0,” those with 1 to 2 family members living within 25 miles of their residence were assigned a code of “1,” those with 3 to 9 family members living within 25 miles of their residence were assigned a code of “2,” and those with 10 or more family members living within 25 miles of their residence were assigned a code of “3.”
Table 2. Descriptive Statistics of Enabling Variables (N = 838)
n Percent (%)
Household Income
Less than $10,000 113 13.48
$10,000 to $20,000 115 13.72
$20,000 to 30,000 340 40.57
$30,000 to 40,000 80 9.55
$40,000 to $50,000 58 6.92
$50,000 to $75,000 71 8.47
$75,000 to $100,000 33 3.94
$100,000 to $150,000 19 2.27
Over $150,000 9 1.07
Work Status
Currently working 141 16.83
Retired 608 72.55
Unemployed 25 2.98
Disabled (unable to work) 64 7.64
Family Proximity (# within 25 Miles)
0 93 11.10
1-2 240 28.64
3-9 289 34.49
10 or more 216 25.78
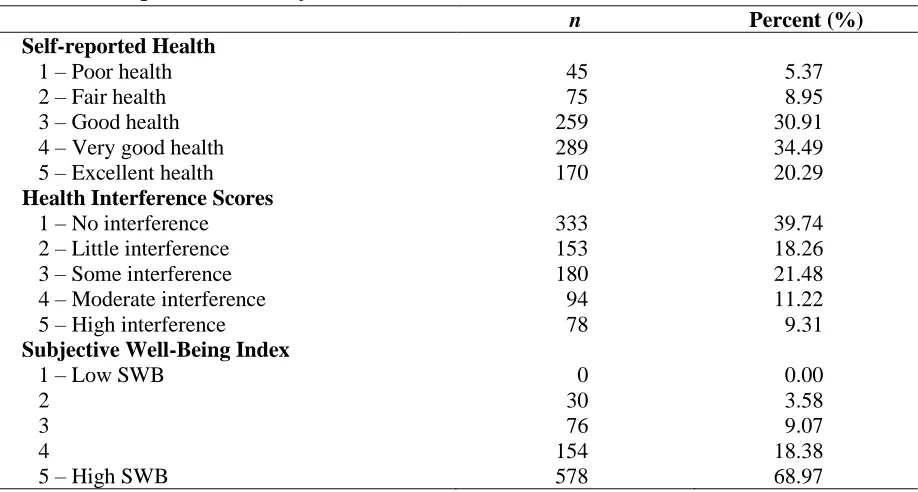
Health need variables. Self-reported health scores, health interference scores, and a Subjective Well-Being Index were used to measure the health needs of participants (see Table 3). Self-reported health was measured through the use of a 5-point Likert-type scale. Higher scores indicated better overall perceived health. Health interference scores also were measured through the use of a 5-point Likert-type scale. In contrast to self-reported health scores, higher scores on this measure indicated that a participant’s physical health was more of a detriment to completing everyday tasks, which are often referred to as activities of daily living (Rippon & Steptoe, 2018).
Responses to the life satisfaction question were self-reported on a scale of 1 to 5, with “1” indicating the most negative score possible and “5” indicating the most positive score possible. Responses to the remaining three items also were self-reported on a scale of 1 to 5, but with “1” indicating that the item (e.g., boredom) was not a problem and “5” indicating that it was a major problem; items related to depression, loneliness, and boredom were reverse coded for purposes of analysis, so that a score of “5” indicated the most positive score possible, staying consistent with the coding used for the life satisfaction question. These four items were combined to create the SWB Index. The Cronbach’s coefficient alpha for this index (α =.793) indicated high
intercorrelation and adequate internal reliability for further analysis.
Table 3. Descriptive Statistics of Health Need and Service Awareness Variables (N = 838)
n Percent (%)
Self-reported Health
1 – Poor health 45 5.37
2 – Fair health 75 8.95
3 – Good health 259 30.91
4 – Very good health 289 34.49
5 – Excellent health 170 20.29
Health Interference Scores
1 – No interference 333 39.74
2 – Little interference 153 18.26
3 – Some interference 180 21.48
4 – Moderate interference 94 11.22
5 – High interference 78 9.31
Subjective Well-Being Index
1 – Low SWB 0 0.00
2 30 3.58
3 76 9.07
4 154 18.38
5 – High SWB 578 68.97
Results
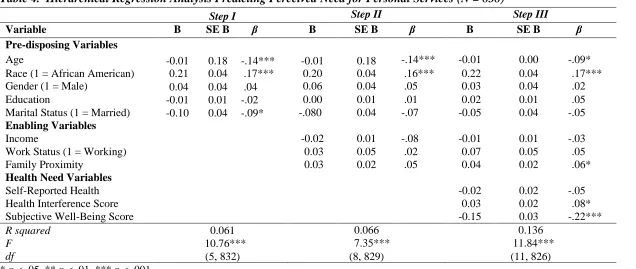
A three-step hierarchical regression model was used to determine what types of potential clients were most likely to express need for supportive services. With each step, a new group of variables from the Behavioral Model was introduced into the regression model. Step I included the pre-disposing variables only. In subsequent steps, enabling and health need variables were added to the model. Attention was paid to which set of variables made the most significant contribution to the model’s explained variance. Table 4 displays the results of this analysis.
Step I introduced the pre-disposing variables into the model. Age (β = -.14, t = -3.94, p < .001) and being married (β = -.09, t = -2.38, p < .05) were negative predictors of perceived need for personal services. Race was a positive predictor of perceived need for personal services (β = .17,
Ser v ice Nee d an d Old er Ad u lt s 1 4 9
Table 4. Hierarchical Regression Analysis Predicting Perceived Need for Personal Services (N = 838)
* p < .05, ** p < .01, *** p < .001.
Step I Step II Step III
Variable B SE B β B SE B β B SE B β
Pre-disposing Variables
Age -0.01 0.18 -.14*** -0.01 0.18 -.14*** -0.01 0.00 -.09*
Race (1 = African American) 0.21 0.04 .17*** 0.20 0.04 .16*** 0.22 0.04 .17***
Gender (1 = Male) 0.04 0.04 .04 0.06 0.04 .05 0.03 0.04 .02
Education -0.01 0.01 -.02 0.00 0.01 .01 0.02 0.01 .05
Marital Status (1 = Married) -0.10 0.04 -.09* -.080 0.04 -.07 -0.05 0.04 -.05
Enabling Variables
Income -0.02 0.01 -.08 -0.01 0.01 -.03
Work Status (1 = Working) 0.03 0.05 .02 0.07 0.05 .05
Family Proximity 0.03 0.02 .05 0.04 0.02 .06*
Health Need Variables
Self-Reported Health -0.02 0.02 -.05
Health Interference Score 0.03 0.02 .08*
Subjective Well-Being Score -0.15 0.03 -.22***
R squared 0.061 0.066 0.136
F 10.76*** 7.35*** 11.84***
df (5, 832) (8, 829) (11, 826)
In Step II, no enabling variables were found to be statistically significant predictors of perceived need for personal services. In this step, marital status became statistically insignificant, while age (β = -.14, t = -3.67, p < .001) and race (β = .16, t = 4.43, p < .001) remained as statistically significant predictors of perceived need for personal services. In Step II, explained variance increased to 6.6%.
In Step III, health need variables were added. Health interference scores (β = .08, t = 2.00, p < .05) and subjective well-being scores (β = -.22, t = -5.80, p < .001) were both significant predictors of the perceived need for personal services. The pre-disposing variables of age (β = -.09, t = -2.50, p < .05) and race (β = .17, t = 5.03, p < .001) remained statistically significant predictors of perceived need for personal services. Among the enabling variables, family proximity (β = .06, t = 1.97, p < .05) became a significant predictor of perceived need for personal services. In Step III, explained variance increased to 13.6%, a statistically significant change from Step II (ΔR2 = .07, F(11, 826) = 22.31, p < .001).
Discussion
The purpose of this study was to measure the level of perceived need for supportive services among older adults in Mississippi. Using data from a statewide needs assessment, this study applied the Behavioral Model (Andersen, 1995; Andersen & Newman, 2005) to explain which of the model’s three traditional factors (pre-disposing, enabling, and health need) best predicted perceived need for supportive services among survey participants.
This study proposed four major hypotheses, which predicted that age, minority status, and
physical health problems would be associated with higher levels of perceived service need, while higher levels of subjective well-being would be associated with lower levels of perceived service need. Factor analyses were conducted to group services more appropriately. Finally, a
hierarchical regression analysis was applied to determine which Behavioral Model variables were the strongest predictors of perceived service need.
Evaluation of Findings
Service Need and Older Adults 152
Journal of Human Sciences and Extension Volume 7, Number 3, 2019
& Allen, 2012). In other words, some survey participants may have reported lower levels of perceived need because they do not think they should be engaging in community activities or they are content allowing family members to help them meet their basic needs.
Minority status and perceived service need. This study identified African American
respondents as being in greater need for services when compared to White respondents, lending support to the study’s hypothesis. These findings are consistent with past research. In their study of rural older adults in Alabama, Park et al. (2010) found that African Americans were more likely than Whites to report difficulties in accessing services. Other studies related to the service needs of minority older adults have found that African Americans, who tend to be challenged with poorer health and lower incomes, may need more health-related services (Roff & Klemmack, 2003). Like past research, the current study revealed that race alone does not predict service need (Park et al., 2010). Therefore, it can be argued that a diverse range of factors must be considered when determining to what groups services should be targeted.
Physical health and perceived service need. Problems with physical health (or health interference) was a significant predictor of perceived service need, following its hypothesized direction. This finding provides further evidence that physical health can limit older adults’ ability to access personal services. The fact that physical health was one of the strongest predictors of service need in this study supports past research that reported similar results (Calsyn et al., 1998).
Subjective well-being and perceived service need. Subjective well-being was found to be the strongest predictor of perceived service need. This marks the third study involving this study’s authors in which this index has played a role in identifying statistically significant relationships with regard to the health and well-being of older adults. This study shows the versatility of this index, as it was the first example of this index being utilized as a predictor variable. The ability of this index to effectively predict perceived need for supportive services lends support to the notion that perceived health needs can act as a predictor of service need (Andersen & Newman, 2005).
Limitations and Directions for Future Research
One limitation of this study was the fact that this study focused only on potential clients. This opens up possibilities for future research that could focus on the challenges faced by service providers, which may elaborate on the difficulties related to providing services to older adults. Such a study also may further illustrate the barriers that potential clients face in accessing services.
A further limitation of this study was that only individuals with land-based telephones
representative samples (Blumenthal, 2010; Christian, Keeter, Purcell, & Smith, 2010). However, older adults are less likely than young adults to have eliminated their landlines, so this may be less of a problem for the current study (Blumberg & Luke, 2008).
Practical Implications
This study has two major practical implications. First, by assessing the level of perceived need for supportive services, the Behavioral Model could be utilized to construct a client profile by identifying which groups had higher levels of need for supportive services. Such a profile could help service providers allocate limited resources more efficiently. Second, a study of this nature, in a state like Mississippi, can illustrate some of the common service needs of older adults in more sparsely populated areas with a significant minority population. Indeed, past research has demonstrated that older adults in these areas typically lack service access and awareness and also are in greater need of services (Li, 2006; Sun, 2011).
This study yielded several findings that are consistent with previous research. In particular, this study provided further evidence that multiple factors can predict service need. The results of this study also showed support for three of the four major hypotheses. Ultimately, this study
provided further evidence of the utility of needs assessment survey instruments for purposes of conducting both applied and basic research. From an applied research perspective, results of this study provide a basis for the argument that identifying factors associated with perceived need for supportive services among older adults can assist policymakers, service providers, and program planners in both the provision of supportive services and the development and planning of services for older adults.
From a basic research perspective, by assessing the level of need for supportive services, this study identified specific groups with higher levels of need for these services. In this case, the application of the Behavioral Model helped construct a potential client profile by predicting which older adult groups in Mississippi reported the highest levels of need for supportive services (i.e., those from minority groups and individuals reporting greater difficulty with their physical health). However, in looking at just one state, it is important to consider matters of both internal and external validity. Indeed, there may be other variables that can be used in the future to strengthen the current analysis. There is also the issue of whether this analysis would have yielded similar results if applied to a different sample of older adults in another region.
Nevertheless, this study serves as an example of how future needs assessment projects can serve as an aid to service providers in how they target and tailor services for older adults.
References
Service Need and Older Adults 154
Journal of Human Sciences and Extension Volume 7, Number 3, 2019
Administration for Community Living. (2018). 2017 profile of older Americans. Retrieved from https://acl.gov/sites/default/files/Aging%20and%20Disability%20in%20America/2017Ol derAmericansProfile.pdf
Andersen, R. M. (1968). A behavioral model of families’ use of health services [Research Series No. 25]. Chicago, IL: Center for Health Administration Studies, University of Chicago. Andersen, R. M. (1995). Revisiting the behavioral model and access to medical care: Does it
matter? Journal of Health and Social Behavior, 36(1), 1–10. doi:10.2307/2137284 Andersen, R. M., & Newman, J. F. (2005). Societal and individual determinants of medical care
utilization in the United States. The Milbank Quarterly, 83(4),1–28. doi:10.1111/j.1468-0009.2005.00428.x
Beverly, C. J., Mcatee, R., Costello, J., Chernoff, R., & Casteel, J. (2005). Needs assessment of rural communities: A focus on older adults. Journal of Community Health,30(3), 197– 212. doi:10.1007/s10900-004-1958-y
Blumberg, S. J., & Luke, J. V. (2008, May 13). Wireless substitution: Early release of estimates from the National Health Interview Survey, July-December 2007. Atlanta, GA: Centers for Disease Control and Prevention, National Center for Health Statistics. Retrieved from https://www.cdc.gov/nchs/data/nhis/earlyrelease/wireless200805.pdf
Blumenthal, M. (2010, May 26). Cell phones and coverage bias. Huffington Post. Retrieved from http://www.huffingtonpost.com
Bookwala, J., Zdaniuk, B., Burton, L., Lind, B., Jackson, S., & Schulz, R. (2004). Concurrent and long-term predictors of older adult’s use of community-based long-term care services: The Caregiver Health Effects study. Journal of Aging and Health, 16(1), 88– 115. doi:10.1177/0898264303260448
Bowling, A. (1995). What things are important in peoples’ lives? A survey of the public’s judgements to inform scales of health related quality of life. Social Science and Medicine, 41(10), 1447–1462. doi:10.1016/0277-9536(95)00113-L
Bowling, A., Farquhar, M., & Browne, P. (1991). Life satisfaction and associations with social network and support variables in three samples of elderly people. International Journal of Geriatric Psychiatry,6(8), 549–566. doi:10.1002/gps.930060803
Bradley, E. H., McGraw, S. A., Curry, L., Buckser, A., King, K. L., Kasl, S. V., & Andersen, R. (2002). Expanding the Andersen model: The role of psychosocial factors in long-term care use. Health Services Research,37(5), 1221–1242. doi:10.1111/hesr.2002.37
Calsyn, R. J., & Roades, L. A. (1994). Predicting perceived service need, service awareness, and service utilization. Journal of Gerontological Social Work, 21(1-2), 59–76.
doi:10.1300/j083V21N01_05
Calsyn, R. J., & Winter, J. P. (2001). Predicting four types of service needs in older adults.
Evaluation and Program Planning,24(2), 157–166. doi:10.1016/S0149-7189(01)00006-4
Chen, Y.-M., & Berkowitz, B. (2012). Older adults’ home- and community-based care service use and residential transitions: A longitudinal study. BMC Geriatrics, 12,Article 44. doi:10.1186/1471-2318-12-44
Chen, Y.-M., & Thompson, E. A. (2010). Understanding factors that influence success of home- and community-based services in keeping older adults in community settings. Journal of Aging and Health, 22(3), 267–291. doi:10.1177/0898264309356593
Chen, Y.-M., Thompson, E. A., Berkowitz, B., Young, H. M., & Ward, D. (2011). Factors and home- and community-based services (HCBS) that predict older adults’ residential transitions. Journal of Service Science and Management, 4(3), 368–379.
doi:10.4236/jssm.2011.43043
Christian, L., Keeter, S., Purcell, K., & Smith, A. (2010, May 20). Assessing the cell phone challenge. Retrieved from https://www.pewresearch.org/2010/05/20/assessing-the-cell-phone-challenge/
Clark, D. O. (1997). U.S. trends in disability and institutionalization among older blacks and whites. American Journal of Public Health,87(3),438–440. doi:10.2105/AJPH.87.3.438 Cromartie, J., & Nelson, P. (2009). Baby boom migration and its impact on rural America
[Economic Research Report No. ERR-79]. U.S. Washington, DC: U.S. Department of Agriculture, Economic Research Service. Retrieved from
https://www.ers.usda.gov/webdocs/publications/46218/9346_err79_1_.pdf?v=41056 Desai, M. M., Lentzner, H. R., & Weeks, J. D. (2001). Unmet need for personal assistance with
activities of daily living among older adults. The Gerontologist, 41(1), 82–88. doi:10.1093/geront/41.1.82
Eckert, J. K., Morgan, L. A., & Swamy, N. (2004). Preferences for receipt of care among community-dwelling adults. Journal of Aging and Social Policy, 16(2),49–65. doi:10.1300/J031v16n02_04
Felix, H. C., Mays, G. P., Stewart, M. K., Cottoms, N., & Olson, M. (2011). Medicaid savings resulted when community health workers matched those with needs to home and community care. Health Affairs, 30(7), 1366–1374. doi:10.1377/hlthaff.2011.0150 Ferris, R. E., Glicksman, A., & Kleban, M. H. (2014). Environmental predictors of unmet home-
and community-based service needs of older adults. Journal of Applied Gerontology,
35(2), 179–208. doi:10.1177/0733464814525504
Grabowski, D. C. (2006). The cost-effectiveness of noninstitutional long-term care services: Review and synthesis of the most recent evidence. Medical Care Research and Review,
Service Need and Older Adults 156
Journal of Human Sciences and Extension Volume 7, Number 3, 2019
Jones, C., Kandel, W., & Parker, T. (2007). Population dynamics are changing the profile of rural areas. Washington, DC: U.S. Department of Agriculture, Economic Research Service. Retrieved from https://www.ers.usda.gov/amber-waves/2007/april/population-dynamics-are-changing-the-profile-of-rural-areas
Kassner, E. (2011). Home and community-based long-term services and supports for older people [Factsheet 222]. Washington, DC: AARP Public Policy Institute. Retrieved from https://assets.aarp.org/rgcenter/ppi/ltc/fs222-health.pdf
Komisar, H. L., Feder, J., & Kasper, J. D. (2005). Unmet long-term care needs: An analysis of Medicare-Medicaid dual eligibles. INQUIRY: The Journal of Health Care Organization, Provision, and Financing, 42, 171–182. doi:10.5034/inquiryjrnl_42.2.171
Li, H. (2006). Rural older adults’ access barriers to in-home and community-based services.
Social Work Research,30(2), 109–118. doi:10.1093/swr/30.2.109
Mattson, J. W. (2011). Aging and mobility in rural and small urban areas: A survey of North Dakota. Journal of Applied Gerontology,30(6), 700–718.
doi:10.1177/0733464811378107
Moody-Ayers, S. Y., Mehta, K. M., Lindquist, K., Sands, L., & Covinsky, K. E. (2005). Black-white disparities in functional decline in older persons: The role of cognitive function.
Journals of Gerontology: Series A, 60(7), 933–939. doi:10.1093/gerona/60.7.933
Park, N. S., Roff, L. L., Sun, F., Parker, M. W., Klemmack, D. L., Sawyer, P., & Allman, R. M. (2010). Transportation difficulty of black and white rural older adults. Journal of Applied Gerontology, 29(1), 70–88. doi:10.1177/0733464809335597
Rippon, I., & Steptoe, A. (2018). Is the relationship between subjective age, depressive
symptoms and activities of daily living bidirectional? Social Science and Medicine, 214,
41–48. doi:10.1016/j.socscimed.2018.08.013
Roff, L. L., & Klemmack, D. L. (2003). Chapter 2: The demographics of aging in rural perspective. Journal of Gerontological Social Work, 41(1-2), 19–35.
doi:10.1300/j083v41n01_02
Schulenberg, N. E., & Coward, R. T. (1998). Residential differences in attitudes about barriers to using community-based services among older adults. Journal of Rural Health, 14(4), 295–304. doi:10.1111/j.1748-0361.1998.tb00635.x
Seeman, T. E., Merkin, S. S., Crimmins, E. M., & Karlamangla, A. S. (2010). Disability trends among older adults: National Health and Nutrition Examination surveys, 1988-1994 and 1999-2004. American Journal of Public Health, 100(1), 100–107.
doi:10.2105/AJPH.2008.157388
Siegler, E. L., Lama, S. D., Knight, M. G., Laureano, E., & Reid, M. C. (2015) Community-based supports and services for older adults: A primer for clinicians. Journal of Geriatrics, 2015, Article 678624. Retrieved from
https://www.hindawi.com/journals/jger/2015/678625/
Sonnega, A., Robinson, K., & Levy, H. (2017). Home and community-based service and other senior service use: Prevalence and characteristics in a national sample. Home Health Care Services Quarterly, 36(1), 16–28. doi:10.1080/01621424.2016.1268552 Sun, F. (2011). Community service use by older adults: The roles of sociocultural factors in
rural-urban differences. Journal of Social Service Research,37(2), 124–135. doi:10.1080/01488376.2011.547446
U.S. Department of Health and Human Services. (2017). Home & community based services. Retrieved from https://www.medicaid.gov/medicaid/hcbs/
Vincent, G. K., & Velkoff, V. A. (2010). The next four decades: The older population in the United States: 2010 to 2050 [Current Population Reports, P25-1138]. Washington, DC: U.S. Census Bureau. Retrieved from https://www.census.gov/prod/2010pubs/p25-1138.pdf
Wiles, J. L., Leibing, A., Guberman, N., Reeve, J., & Allen, R. E. S. (2012). The meaning of “aging in place” to older people. The Gerontologist, 52(3), 357–366.
doi:10.1093/geront/gnr098
Wilmoth, J. D., Adams-Price, C. E., Turner, J. J., Blaney, A. D., & Downey, L. (2014). Examining social connections as a link between religious participation and well-being among older adults. Journal of Religion, Spirituality & Aging, 26(2-3), 259–278. doi:10.1080/15528030.2013.867423
Joshua J. Turner is a postdoctoral fellow in the Department of Human Development and Family Studies and USU Extension at Utah State University.
Carolyn E. Adams-Price is an associate professor of psychology at Mississippi State University, with a specialty in gerontology.