DETERMINING THE INTERDEPENDENCE OF FACTORS,
AFFECTING THE DEVELOPMENT OF FISH FARMING
Iskandar Yunusov
Ph.D student, Tashkent Institute of Irrigation and Agricultural Mechanization Engineers (TIIAME)
1. INTRODUCTION:
The development of any sector is a set of objective, natural, socio-economic, human factors and unrelated laws and regulations that affect the processes occurring in harmony with them, and are able to exert pressure on its development at a certain level. These factors are interpreted as “influencing factors” in the scientific literature and are interpreted and explained differently depending on the nature of the subject and the direction of the subject, as well as the object, purpose and objectives of the research.
Depending on the nature of our research, we must clarify the meaning and essence of the concept of "factor". Factor analysis is a multidimensional method used to study the relationships between the values of variables. The dependence of known variables on some variables and random errors indicates the relevance of the factor.
In General, factor analysis has the following main objectives:
- determine the relationships between variables (“classifications of variables”), i.e. whether they are related to variables in the relationship, directly or indirectly, these relations are characterized directly or indirectly;
- the degree and scope of the relationship between variables; - reduce the number of variables needed to describe the data. Factor analysis allows the researcher to solve two main problems:
- first, in a complex and at the same time compactly detect the object of measurement;
- secondly, factor analysis defines hidden variables responsible for the existence of linear, statistical and correlation relations between the observed variables.
To study relationships between variables, it is proposed to use methods of economic-mathematical modeling and multidimensional statistical analysis – one of the main tools for progressing the economic mechanism, structural transformation of the regional market and forecasting the dynamics of production and sales of products. A variety of economic and mathematical models is the optimization model. Its use allows you to analyze the dynamics of the development of organizations in the region and take advantage of large amounts of real information [11].
2. LITERATURE REVIEW.:
The concept of "Factor" is widely used in special scientific and popular science literature, which implies a
distinctive feature of slowing down, speeding up or sharply slowing down the process. “Factor” is a social category and
may be empirically different depending on the application. As a socio-economic category, it manifests itself in the relationships of people in the processes of production, exchange, distribution and consumption.
The concept and practice of factor analysis was the first used in the field of psychometrics, and today it is a widely used in practice of all areas, such as statistics, economics, trigonometry and modeling.
The basic idea of factor analysis was created by an English psychologist and anthropologist who contributed to the study of personal differences. Scientists in economics: Spar (1904, 1927, 1946 years), Thurston (1935, 1947, 1951 years), Kettel (1946, 1947, 1951 years) and Pearson, Xvan M., Gulyamov S., Dospexov B., Umarov S., Durmanov A., Ponomareva O. studied such issues as factor phenomenon, factor analysis, economic-mathematical modeling of production, economic efficiency indicators in fish farming and interdependence of factors that influence the development of any industry.
Abstract: An important aspect that must be considered when determining the level of factors affecting the development of fisheries is the correct choice of factors. If we analyze this by region or organization, the same factor may have different effects on the socio-economic efficiency of the fish sector. Therefore, this article is devoted to determine the influence level and relationships between factors affecting the development of fish farming. And scientific and practical suggestions regarding the topic are presented in this article.
3. MATERIALS AND METHODS.:
The implementation of factor analysis begins with checking its state. The existence of such conditions will allow us to conclude that the process or phenomenon of the event, its current or future status and the influence of certain factors will allow us to evaluate and predict the course of action or changes in the process. Failure to comply with this requirement may lead to a completely unexpected conclusion and suggestions about what was said.
Mandatory requirements for factor analysis are as follows [1]: - all marks must be quantitative;
- the number of observations should be at least twice as large as the variables; - samples must be identical;
- the initial variables should be symmetrically distributed; - factor analysis should be associated with variables.
From the earliest times of independence, the country's economic and social, organizational and regulatory conditions for economic management and production organization have changed dramatically due to the implementation of economic and social reforms aimed at the formation and development of elements of a market economy in the fisheries. A new system based on market relations was created. As a result of the reform, the fisheries sector led to the work with fish farms of various formations.
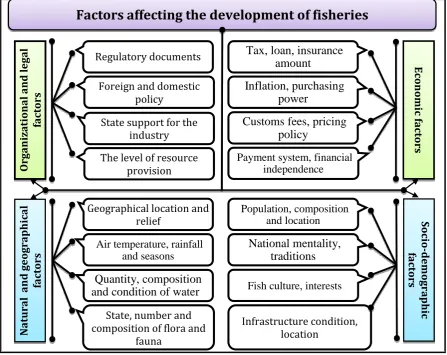
During the study, we analyzed the factors affecting the development of the fish sector on the following four groups (Figure 1):
- Organizational and legal factors; - Economic factors;
- Natural and geographical factors; - Socio-demographic factors.
Organizational and legal factors include regulatory documents, foreign and domestic policies, state support for
industry, the level of resource provision.
Figure 1. Factors affecting the development of fisheries. Source: developed by author based on the monographic research.
Factors affecting the development of fisheries
Regulatory documents
Or
gan
iza
tional
an
d
leg
al
fac
to
rs
Tax, loan, insurance
amount
Inflation, purchasing
power
Customs fees, pricing
policy
Payment system, financial independence
Ec
on
omic fa
ctor
s
Geographical location and relief
Air temperature, rainfall and seasons
Quantity, composition
and condition of water
N
at
u
ral
and
g
eogr
aphic
al
fac
to
rs
State, number and composition of flora and
fauna
Population, composition and location
National mentality,
traditions
Fish culture, interests
Infrastructure condition, location
So
cio
-dem
ogra
phic
fac
to
rs
Foreign and domestic policy
State support for the industry The level of resource
Decrees and resolutions of President of the Republic of Uzbekistan, decrees and resolutions of the Cabinet Ministers of the Republic, as well as decisions and regulations adopted by the interested ministries, departments and organizations (Ministry of Agriculture, Ministry of Water Resources, “Uzbekfishindustry” Association), are directly used for the development of fisheries.
It should be noted that over the past two years, conceptual changes have been made on the ground as part of the
reorganization of the “Uzbekbaliksanoat” Association and within its objectives and capabilities. In addition, due to organizational and economic changes in the system of ensuring the feed base of the fish sector, especially, in providing material and technical resources, as well as new rules and regulations, the economic activity of fisheries has changed in a positive way.
Natural and geographical factors - the geographical location and relief, air temperature, rainfall and season; the
number, composition and status of water; the state, number and structure of the animal and plant world are natural - geographic factors.
Economic factors – factors such as tax, credit, insurance, inflation, customs fees, purchasing power, pricing
policy, payment system, monetary policy by central bank, foreign currency liberalization, including, financial independence.
Socio-demographic factors - such as population, composition and location, National mentality, traditions, Fish
culture, interests and Infrastructure condition, location.
In many spheres the problem is that, according to the results of observations, it is necessary to determine the relationship between the associated parameters.
The relationship and influence between factors have been studied widely in foreign literatures, use of these factors in the development of region and fishery sector allows them to substantiate not only economic, but also ecological sustainability [2,3,4].
4. RESULTS AND DISCUSSIONS:
In agriculture and economics, it is necessary to work with empirical, that is, formulas found in observations or experiments. One of the ways to find such formulas is the least squares method. The meaning of this method is as follows: we say that a function with the name y = ax + b consists of straight line function. In this case, the minimum condition for the sum of squared deviations is expressed as follows [7].
S(a, b) = ∑ui=1[yi-(axi+ b )] 2→ min (1)
It is known from mathematical methods that in order to fulfill this condition, the partial derivatives obtained from the parameters a and b must be equal to zero. If the derivatives are zero, we will create two unknown systems of linear equations. Using them, we can determine the unknowns a and b by the following formula.
( 2)
The coefficients a and b, defined by the formula (2), are called regression coefficients. Determining the coefficients a and b, we find y = f (x) = ax + b with the value of the function for any value of the argument x = x *. Using the linear coefficients a and b, the line representing the formula y = ax + b is called the regression line.
Various factors in the production of fish products also depend on various service and organizational factors. Therefore, in this case, it is desirable to use multifactor correlation methods. First of all, it is necessary to determine the type of regression equation and the main factors influencing the production of the product. The structure of the data obtained from the farms shows that it is desirable to obtain a regression equation in the form of a linear relationship.
In the linear case, we describe the regression equation:
y = a0+ a1x1+ a2x2+ … + anxn (3)
Where:
y - the quantity of goods;
a0, a1, .... regression coefficients;
x1, x2, ..., xn - the number of factors affecting the quantity of a product.
n i n i i i n i n i i i n i n i n i i i i i x n f y n b x x n y x y x n a 1 1 1 2 1 21 1 1
/ /
1
In this case, we use the least squares method to find the regression coefficients. And the minimum condition for the sum of squared deviations is expressed [6]:
𝑆(𝑎0, 𝑎1, … 𝑎𝑛) = ∑𝑢𝑖=1[𝑦𝑖− (𝑎0+ 𝑎1𝑥1𝑖+. . . 𝑎𝑛𝑥𝑛𝑖)] 2→ 𝑚𝑖𝑛 (4)
It is well known that in order to fulfill this requirement, the partial derivatives obtained from the parameters a0,
a1, ... an must be equal to zero. If the partial derivatives are zero, then we get n + 1 unknowns from n + 1 system of linear
equations.
{
𝑁𝑎0+ 𝑎1∑ 𝑥1+ 𝑎2∑𝑥2+ . . . + 𝑎𝑛∑ 𝑥𝑛= ∑ 𝑦
𝑎0∑ 𝑥1+ 𝑎1∑ 𝑥12+ 𝑎2∑𝑥1𝑥2+ . . . + 𝑎𝑛∑ 𝑥1𝑥𝑛= ∑ 𝑥1𝑦
𝑎0∑ 𝑥2+ 𝑎1∑ 𝑥1𝑥2+ 𝑎2∑ 𝑥2
2+ . . . + 𝑎
𝑛∑ 𝑥2𝑥𝑛= ∑ 𝑥2𝑦
− − − − − − − − − − − − − − − − − − −
𝑎0∑ 𝑥𝑛+ 𝑎1∑ 𝑥1𝑥𝑛+ 𝑎2∑ 𝑥2𝑥𝑛+ . . . + 𝑎𝑛∑ 𝑥𝑛 2 = ∑ 𝑥
𝑛𝑦
(5)
(3) the coefficients of the regression equation are derived from the solution of the system of equations (5). In this connection, the values of the coefficients a0, a1, ..., аn are determined. The found values are put in the
formula (3), the regression equation is obtained. As a result, a production function is obtained, that is a prediction function, associated with factors affecting the production of product.
The correlation coefficient is required to determine the relationship between factors. The linear correlation coefficient is determined by the following formula [7,8].
𝑟 = 𝑁 ∑ 𝑥𝑦−∑ 𝑥 ∑ 𝑦
√𝑁 ∑ 𝑥2−(∑ 𝑥)2√𝑁 ∑ 𝑦2−(∑ 𝑦)2; (6)
To find the correlation coefficient of the multivariate linear regression equations, the following determinant is formed:
D =
| | |
1 𝑟𝑥1𝑦 𝑟𝑥2𝑦 … … 𝑟𝑥𝑛𝑦 𝑟𝑥1𝑦 1 𝑟𝑥1𝑥2 … … 𝑟𝑥1𝑥𝑛 𝑟𝑥2𝑦 𝑟𝑥1𝑥2 1 … … 𝑟𝑥2𝑥𝑛
𝑟𝑥3𝑦𝑟𝑥1𝑥3𝑟𝑥2𝑥3 … … 𝑟𝑥3𝑥𝑛 … … … … … … … … … … … … … … … … … … … … … … … … … … … … … …
𝑟𝑥𝑛𝑦𝑟𝑥1𝑥𝑛𝑟𝑥2𝑥𝑛 … … 1 | | |
(7)
(7) The first row and column in the determinant are deleted and the determinant D11 is generated [6]:
D11 =
| | |
1 𝑟𝑥1𝑥2𝑟𝑥1𝑥3 … … 𝑟𝑥1𝑥𝑛 𝑟𝑥1𝑥2 1 𝑟𝑥2𝑥3 … … 𝑟𝑥2𝑥𝑛
𝑟𝑥1𝑥3𝑟𝑥2𝑥3 1 … … 𝑟𝑥3𝑥𝑛 𝑟𝑥1𝑥4𝑟𝑥2𝑥4𝑟𝑥3𝑥4 … … 𝑟𝑥4𝑥𝑛 … … … … … … … … … … … … … … … … … … … … … … … … … … … … … …
𝑟𝑥1𝑥𝑛𝑟𝑥2𝑥𝑛𝑟𝑥3𝑥𝑛 … … 1 | | |
(8)
The correlation coefficient of the regression equation is obtained by the following formula:
𝑅 = √1 −𝐷𝐷
The correlation coefficient determines the ratio between the x and y factors. If 0<R <0,3, the correlation between the factors is weak, if 0,3 <R <0,7, then the relationship between the x and y factors is average, if R>0,7, then the correlation between the factors is strong.
To explore the essence of the generated regression equation, we need to define some other indicators. In particular, the errors of the standard of the correlation coefficient are determined by the formula:
𝑆𝑅= √ 1−𝑅2
𝑁−2, (10)
The essence of the correlation coefficient is determined by the formula.
𝑡𝑅 = 𝑅
𝑆𝑅 (11)
The essence of the multifactor correlation is determined by the F-criterion:
𝐹𝑟𝑒𝑎𝑙= 𝑅2 1−𝑅2∗ (
𝑛−𝑘
𝑘−1), (12)
The independent F-criterion levels are theoretically defined as V1 = k-1 and V2 = n-k, and can be found from the Fisher table. Then the values of Freal and Ftab are compared. If Freal>Ftab, then the multivariate correlation coefficient is
really significant, and the regression equation is also significant.
We will try to find a solution to this problem with the help of economic indicators of fisheries in Namangan region of the republic for 2015-2017.
We consider the factors that affect the development of fishery in farms.
Based on monographic studies conducted in seven fish farms of Namangan region, we selected 6 main factors affecting fish production. Then the regression equation is:
y
= a0+ a1x1+ a2x2+ a3x3+ a4x4+ a5x5+ a6x6 (13)a1, a1, ... a6, are regression coefficients that are not yet known.
Where:
y - fish production, million UZS; x1 - the single land tax, million UZS;.
x2 - average annual water supply, million m3. UZS;
x3 - the rate of inflation, in percent;
x4 - feed prices, UZS;
x5 - the amount of the soft loan, mln. UZS;
x6 - electr energy for the pump, mln. UZS
We use the least squares method to find the regression coefficients and generate a system of 7 equations (7), unknown as a result of (5), of which the regression coefficients are a0, a1, a2, a3, a4, a5, a6, from the formulas (7) and ( 8)
we find the values of D and D11 dermermenants and other necessary parameters.
The results of the calculation parameters of the regression equation are shown in Table 1. Table -1
Estimation of regression parameters in fish production.
Regression statistics
Multifactorial R 0,803
R- square 0,646
Source: Calculated by author based on the monographic data.
a0= 7,46; a1= 10,76; a2= 14,13; a3= 2,15; a4= -12,65; a5= -0,98; a6= -15,61.
Putting the found values in the formula (3), we will create a regression equation:
According to the coefficients of the regression equation, one of the variables changes by one (except that the value of other variables remains unchanged) indicates how y changes.
The coefficient of multifactorial correction from table 1 is R = 0,803. According to this result, since R> 0.7, the relationship between the factors is fairly strong.
The essence of multifactor correlation, regression equations:
𝐹𝑟𝑒𝑎𝑙 = 0,8032 1−0,8032∗ (
148−6
6−1 ) = 51,37 (15)
5. CONCLUSIONS:
Thus, Freal> Ftab (Ftab = 3,71) has the essence of the regression equation. As a result, (14) a function was created
to forecast and plan fish production in various situations or for other farms or for the coming period. The study revealed that there is a link between fish farming and the feeding system in private farms.
Of course, it is difficult to clearly define the purpose of a study conducted on the example of fish farms in one region, since the numbers that we consider in our case are somewhat contradictory, given the need for at least 5-year data for correlation. Nevertheless, it is possible to achieve effective results by applying the above model to calculate factors affecting the development of fish farming.
In general, using the above model, it is possible to assess the factors affecting the development of the fisheries, to prepare conclusions, to identify factors and eliminate problems relative to the sector, and in the end this can be give great results.
REFERENCES:
1. Shumetov V. G., Shumetova L. V. “Factor analysis: an approach using a computer”. OrelGTU, Orel, 1999.– p. 88.
2. Factor analysis for sustainable development of the regions of Russian Federation. Xvan M.S. “Novosibirsk state university
of Economics and Management”, Novosibirsk, Russia.
3. Albiter L.M., Smirnova S.B. Economic and environmental efficiency at the macro level. – [Electron resource] – Access mode: http://vestnik.samgtu.ru/uploads/series/1/22/242/2012-3--0013.pdf.
4. Xvan M.S. Development of methods for statistical assessment of the level of sustainable development of socio-economic systems / Glinskiy V.V., Sepga L.K., Xvan M.S., Filatov S.A. // Ideas and ideals. 2013. Т. 1 №3. p. 48-56.
5. Abruev A. “Improving the productivity of livestock based on the development of agricultural services” Abstract of dissertation (PhD) on economic sciences. 2018. p. 23-24. library.ziyonet.uz
6. Gulyamov S.S. Problems of modeling the development of regional agro-industrial complexes. Abstract of doctoral dissertation (DSc) on economic sciences. – Moscow, 1986. – p.36.
7. Dospexov B.A. Methods of field research (with new statistical results) – 5-edition, additional and processing. – M.:
“Agropromizdat”, 1985.– p.351.- (Textbooks and tutorials for universities).
8. Kursonov A.P., Sinelnikova M.M. Computing and economic-mathematical methods in agriculture. Tutorials. 2-edition, additional and processing. –М., “Statistics”, 1977.
9. Kosaurov S.D., Muravev A.S., Oleynik G.G. Regulatory guide to the economy and organization of agricultural production..
–“KOLOS”. Moscow-1967. – 510 p.
10. Umarov S.R. (2017). Innovative development and main directions of Water Management. Economy and Innovative Technologies (1). Available at: https://goo.gl/eEHSJK (in Uzbek).
11. Durmanov A.Sh., Umarov S.R. (2018). Economic-mathematical modeling of optimization production of agricultural production. Asia Pacific Journal of Research in Business Management, 9(6), p.10-21.
12. Umurzakov, U.P., Ibragimov, A.G., Durmanov, A.S. Development of the organizational-economic mechanism and development of scientific, methodological and theoretical foundations for improving the efficiency of the rice growing
industry to ensure the country's food security // Science and Practice Bulletin. Electron. journals 2017. №11 (24). P. 103 -118. Access mode: http://www.bulletennauki.com/umurzakov. DOI: 10.5281 / zenodo.1048318
13. Durmanov, A. (2018). Cooperation as a basis for increasing the economic efficiency in protected cultivation of vegetables. Bulletin of Science and Practice, 4(8), 113-122.
14. Durmanov, A. Sh., & Yakhyaev, M. M. (2017). Measures to increase the volume of exports of fruit and vegetables. Herald of the Caspian, (4).
15. Ibragimov, A. G., & Durmanov, A. S. (2017). Issues of the development of competitiveness and the prospects of specialization in rice farms. SAARJ Journal on Banking & Insurance Research, 6(5), 14-19. doi:10.5958/2319-1422.2017.00021.2.
16. Durmanov, A. Sh., & Khidirova, M. H. (2017). Measures to increase the volume of exports of fruit and vegetable products. Economics, (9), 30-34. (in Russian).
17. Eshev A. S., Nazarova F. Kh. (2019). Influencing factors for the development of agricultural strategy in the republic of Uzbekistan. International journal for innovative research in multidisciplinary field. V - 5, I - 7, July – 2019. 151-160 p.