http: // www.ijrtsm.com© International Journal of Recent Technology Science & Management 1
ISSN : 2455-9679
[Jitendra et al. , 3(9), Sept 2018] Impact Factor : 2.865
IJRTSM
INTERNATIONAL JOURNAL OF RECENT TECHNOLOGY SCIENCE & MANAGEMENT
“ANALYSIS AND OPTIMIZATION OF FACTOR CONTRIBUTION FOR FSW JOINT OF
ALUMINIUM ALLOY BY TAGUCHI METHOD ON MINITAB SOFTWARE
”
Jitendra Bamne
1,
Prof. Neeraj Nagayach
21,
PG, Scholar, Dept. of Mechanical Engineering, OIST, Bhopal, MP, India
2
Associate Professor, Dept. of Mechanical Engineering, OIST, Bhopal, MP India
ABSTRACT
In this project, CNC Milling Machine is used to weld the parts together. Here we will weld dissimilar material aluminum alloy AA5086 H32-AA6061 T6 plate of thickness 6 mm. The range of rotational speed is from 900 rpm to 1500 rpm while the welding speed range is from 10 to 30 mm/min. The other parameter considered is the tool profile. The dimensions of the parts are (300mm x 30mm x 6mm) which are welded to form a butt joint. The effect of different tool geometry having different pin profiles on the quality of the welded joint is also studied. In this study we have considered different tool pin profiles are round threaded, circular/round and square. The tools are designed using CATIA V5 R20 software and are manufactured on a conventional lathe machine. After the parts are welded, various tests are performed on the welded parts such as tensile strength and the Vickers’s hardness test. The optimum value of process parameters such as spindle speed, feed rate and tool profile are found to be 1200 rpm (level 2), 20 mm/min (level 2) and square tool pin (level 3) respectively and The optimum value of process parameters such as spindle speed, feed rate and tool profile are found to be 1200 rpm (level 2), 30 mm/min (level 3) and round tool pin profile (level 3) respectively. The maximum hardness value achieved was 55.53 HV while welding at 1200 rpm with 30 mm/min feed using the square tool.
KEYWORD: Tool Profile , welding, Speed, Feed, CATIA, Vicker’s Hardness, AA5086 H32-AA6061 T6
I.
I
NTRODUCTIONFriction welding is known for its welding procedure in which the heat required for welding is gotten by rubbing between the end to end sections to be joined. One of the parts to be joined is turned at a high speed around 3000 rpm and the other part is pivotally lined up with the second one and pressed tightly against it. Due to high friction between the two parts, the temperature at the interface increases. At that point the when the rotation of the part is stopped unexpectedly and it cause increase in pressure on the fixed part with the goal that the joining happens. This is
http: // www.ijrtsm.com© International Journal of Recent Technology Science & Management 2
ISSN : 2455-9679
[Jitendra et al. , 3(9), Sept 2018] Impact Factor : 2.865
Figure.1 Schematic of principle of Friction stir weld
1.1 Taguchi technique
Taguchi technique is statistical method developed by Genichi Taguchi to enhance the performance and quality of the products. Based on Taguchi, the main point just before analysis is establishment of the experiment. Only by this method, it's possible to enhance the quality of the process. This method could achieve the last output value and reduced the variability across the output value by minimum cost. He believed that the easiest way to enhance quality was to create and construct it into the product. The main purpose of this method is to create good quality product at inexpensive to the manufacturer. Taguchi developed a way for experiment design to examine how various parameters
affect the mean and difference of a process performance characteristic
.
1.2 Minitab
Minitab is really a statistics package. It was developed at the Pennsylvania State University by analysts Barbara F. Ryan, Thomas A. Ryan, Jr., and Brian L. Joiner in 1972. Minitab offers a collection of software, support materials and services that enable you to control your quality and method development processes. This application is useful for Data and File Management- spreadsheet for better data analysis; Analysis of Difference; Regression Analysis; Power and Sample Size; Tables and Graphs; Multivariate Analysis - involves factor analysis; cluster analysis; correspondence analysis; etc., Nonparametric tests including sing test, runs test, Friedman test, etc., Time Series and Forecasting tools that help show trends in data as well as predicting future values. In this function, the Minitab 18 software is useful for obtaining ANOVA.
II.
METHODOLOGY
• Accordingly the present study has been done through the following plan of experiment.
• Checking and preparing the power hacksaw and Lathe ready for performing the machining operation.
• Cutting of aluminium, stainless steel-304 according to required length on power hack saw.
• Fix the cutting tool on tool post & fix the stainless steel-304 in rotating chuck on lathe for the preparation of different welding tool pin profile.
http: // www.ijrtsm.com© International Journal of Recent Technology Science & Management 3
ISSN : 2455-9679
[Jitendra et al. , 3(9), Sept 2018] Impact Factor : 2.865
• Turning of tool to get the required diameter
• Checking of required diameter with the help of vernier calliper
• Tool and Sample is ready for welding.
• Conduct tensile test and hardness test on Universal Testing Machine (UTM) and vicker’s hardness testing machine.
III.
EXPERIMENTS
WORKS
3.1 Experiments
The current experimental research is a try to discover the feasibility of using FSW method in joining dissimilar AA5086 H32-AA6061 T6 grade aluminium alloy sheets of 6 mm thickness. Two workpieces of size 300 mm x 30mm x 6 mm are joined collectively to make butt joint.
http: // www.ijrtsm.com© International Journal of Recent Technology Science & Management 4
ISSN : 2455-9679
[Jitendra et al. , 3(9), Sept 2018] Impact Factor : 2.865
Figure.3.2 Tool Profile CATIA
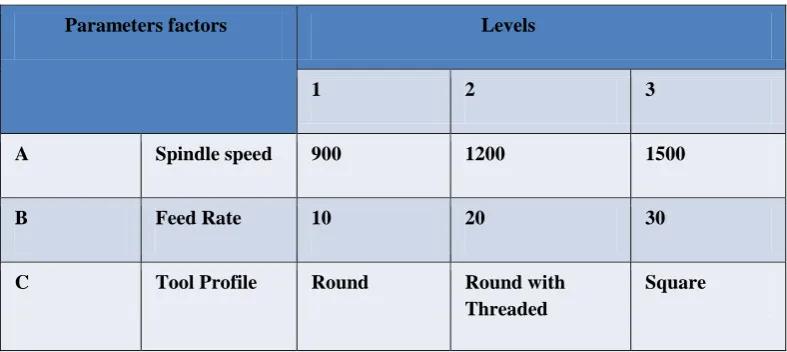
Table 3.2 Table Process variables and their limits
Parameters factors Levels
1 2 3
A Spindle speed 900 1200 1500
B Feed Rate 10 20 30
C Tool Profile Round Round with
Threaded
http: // www.ijrtsm.com© International Journal of Recent Technology Science & Management 5
ISSN : 2455-9679
[Jitendra et al. , 3(9), Sept 2018] Impact Factor : 2.865
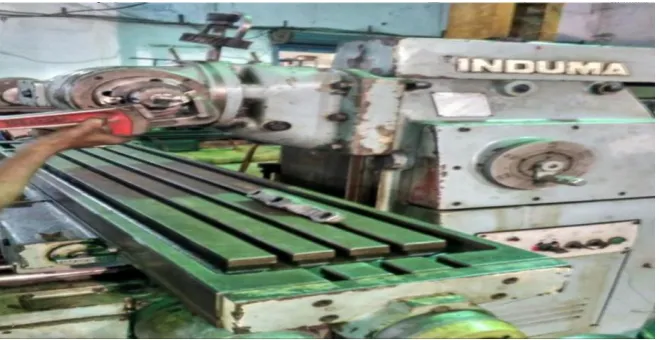
Table 3.3 Simple milling machine
Spindle Position Vertical position
Max. rpm 4700
Diameter of Tool Holder 17 mm
Motor 4 Horse Power(hp), 1420 rpm
Longitudinal Transverse speed Range 12-800 mm/min
3.2 FRICTION STIR WELDING PROCEDURE
9 experiments had been performed on AA5086 H32-AA6061 T6 grade aluminium alloy plates. The three factors used in this experiment are the rotating speed, feed and tool pin profile. The elements and the levels of the process parameters are presented. The experiments are completed on a vertical milling machine.
http: // www.ijrtsm.com© International Journal of Recent Technology Science & Management 6
ISSN : 2455-9679
[Jitendra et al. , 3(9), Sept 2018] Impact Factor : 2.865
Rotating tool is ready for friction weldingFig.3.4 CATIA Plate model
http: // www.ijrtsm.com© International Journal of Recent Technology Science & Management 7
ISSN : 2455-9679
[Jitendra et al. , 3(9), Sept 2018] Impact Factor : 2.865
Fig.3.6 Specimen Before Failure
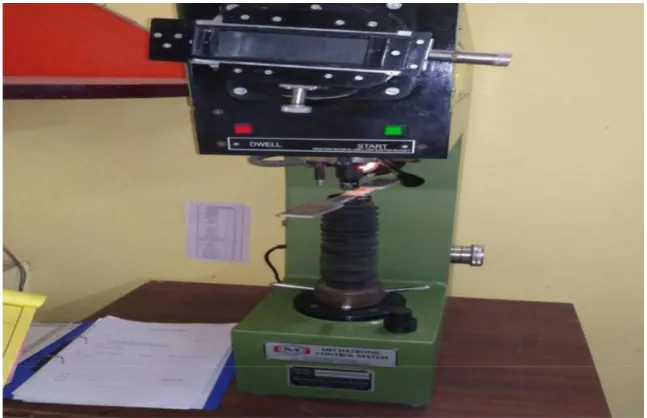
3.3 VICKERS HARDNESS TEST
The Vickers hardness test includes indenting the test material with a diamond indenter as shown in fig.within the shape of a right pyramid with a rectangular base and a perspective of 136 degree among opposite faces subjected to a load of 1 to 100 kgf. The whole load is usually applied for 10 to 15seconds. The 2 diagonals of the indentation left within the surface of the material after elimination of the load are measured the use of a microscope and their average calculated.
http: // www.ijrtsm.com© International Journal of Recent Technology Science & Management 8
ISSN : 2455-9679
[Jitendra et al. , 3(9), Sept 2018] Impact Factor : 2.865
3.4 SIGNAL –TO - NOISE RATIOParameters that affect the output can be divided in two parts: controllable (or design) factors and uncontrollable (or noise) factors. The difference between controllable and uncontrollable factors is that the value of controllable factors can be adjusted by the designer but the value of uncontrollable factors cannot be changed because they are the sources for variation because of operational environment. The best setting of control factors as they influence the output is determined by performing taguchi’s design of experiments. Bigger-the-Better is used for tensile strength and hardness value.
3.5 MEASUREMENT OF F-VALUE OF FISHER’S F RATIO
The F values determine the importance of the parameters. Larger the F value, the greater the effect on the performance characteristic due to the change in that process parameter, F value is defined as:
3.5.1 DATA COLLECTION
http: // www.ijrtsm.com© International Journal of Recent Technology Science & Management 9
ISSN : 2455-9679
[Jitendra et al. , 3(9), Sept 2018] Impact Factor : 2.865
3.6 DATA COLLECTION
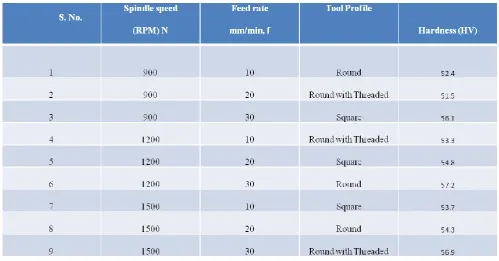
Table 3.4 Vicker’s Hardness test result
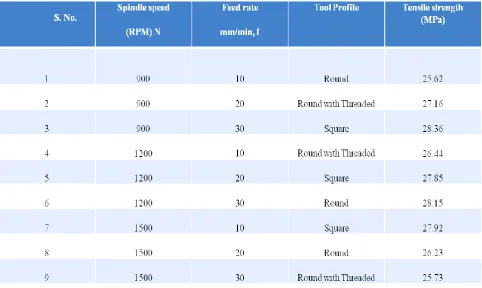
3.6.1 CALCULATIONS OF S/N RATIOS FOR TENSILE TEST
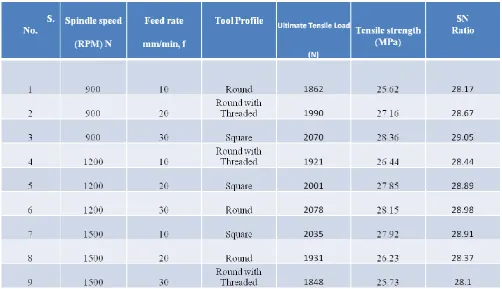
• S/N Ratio (Experiment 1) = η1= -10log [1/n (∑ 1/Yi2)] =-10 log [1/ (25.62)2] = 28.17
• S/N Ratio (Experiment 2) = η2= -10 log [1/ (27.16)2] = 28.67
• S/N Ratio (Experiment 3) = η3= -10 log [1/ (28.36)2
] = 29.05
• S/N Ratio (Experiment 4) = η4= -10 log [1/ (26.44)2
] = 28.44
• S/N Ratio (Experiment 5) = η5 = -10 log [1/ (27.85)2] = 28.89
• S/N Ratio (Experiment 6) = η5 = -10 log [1/ (28.15)2] = 28.98
• S/N Ratio (Experiment 7) = η6= -10 log [1/ (27.92)2] = 28.91
• S/N Ratio (Experiment 8) = η7= -10 log [1/ (26.23)2] = 28.37
http: // www.ijrtsm.com© International Journal of Recent Technology Science & Management 10
ISSN : 2455-9679
[Jitendra et al. , 3(9), Sept 2018] Impact Factor : 2.865
3.7 DATA COLLECTIONTable 3.5 Tensile test result with S/N Ratio
3.7.1 CALCULATIONS OF S/N RATIOS FOR VICKER’S HARDNESS
• Bigger the better is selected for the calculation of S/N ratio
• S/N Ratio (Experiment 1) = η1= -10log [1/n (∑ 1/Yi2)] =-10 log [1/ (52.4)2] = 34.3
• S/N Ratio (Experiment 2) = η2= -10 log [1/ (51.5)2] = 34.27
• S/N Ratio (Experiment 3) = η3= -10 log [1/ ( 56.1 )2] = 34.97
• S/N Ratio (Experiment 4) = η4= -10 log [1/ (53.3 )2] = 34.53
• S/N Ratio (Experiment 5) =η5 = -10 log [1/ (54.8 )2] = 34.77
• S/N Ratio (Experiment 6) =η6 = -10 log [1/ ( 57.2 )2] = 35.14
• S/N Ratio (Experiment 7) = η7= -10 log [1/ ( 53.6 )2] = 34.58
• S/N Ratio (Experiment 8) = η8= -10 log [1/ (54.2 )2] = 34.68
http: // www.ijrtsm.com© International Journal of Recent Technology Science & Management 11
ISSN : 2455-9679
[Jitendra et al. , 3(9), Sept 2018] Impact Factor : 2.865
Table 3.6 S/N ratio for Vicker’s hardness testresult
3.8 ANOVA Method
ANOVA is a statistical tool which determines the contribution of individual factors to control the final response. It calculates the parameters like sum of squares (SSS), degree of freedom, variance, f value P value for each factor. The
ANOVA calculations were done using the help of the MINITAB 18 software.
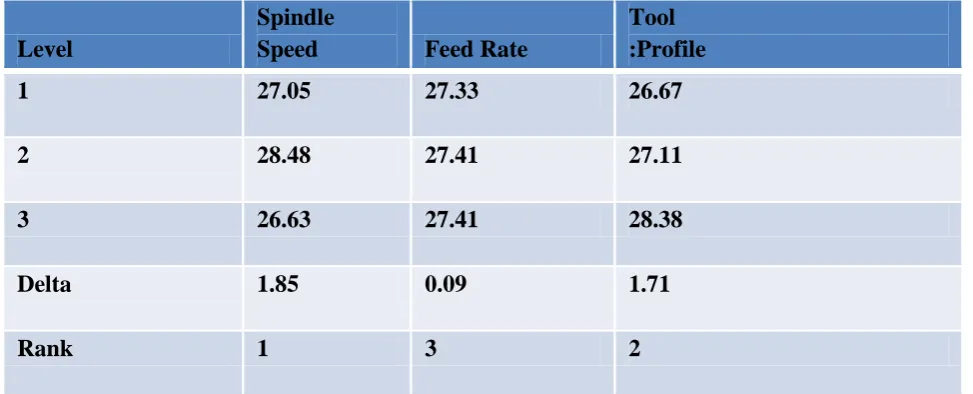
Table 3.7 Analysis of Variance for Means of tensile strength
Level
Spindle
Speed
Feed Rate
Tool
:Profile
1
27.05
27.33
26.67
2
28.48
27.41
27.11
3
26.63
27.41
28.38
Delta
1.85
0.09
1.71
http: // www.ijrtsm.com© International Journal of Recent Technology Science & Management 12
ISSN : 2455-9679
[Jitendra et al. , 3(9), Sept 2018] Impact Factor : 2.865
Table 3.8 Response table for S/N ratio for tensile strengthhttp: // www.ijrtsm.com© International Journal of Recent Technology Science & Management 13
ISSN : 2455-9679
[Jitendra et al. , 3(9), Sept 2018] Impact Factor : 2.865
Fig.3.8 Main effects plot for means for tensile strength
http: // www.ijrtsm.com© International Journal of Recent Technology Science & Management 14
ISSN : 2455-9679
[Jitendra et al. , 3(9), Sept 2018] Impact Factor : 2.865
3.9 ANOVA FOR VICKER’S HARDNESSTable 3.10 Analysis of variance for means for vicker’s
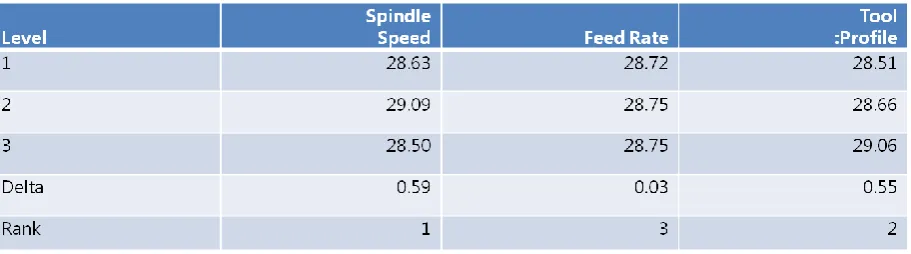
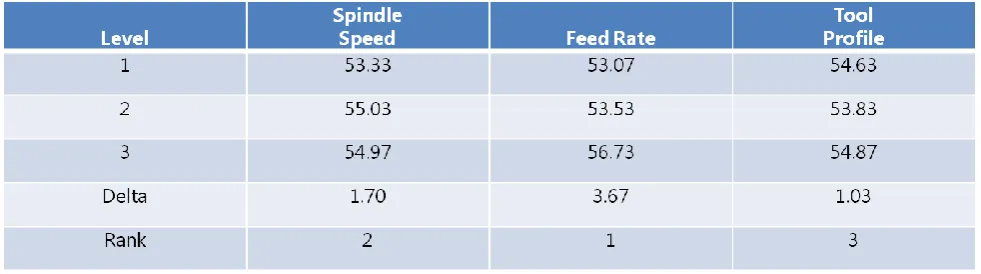
Table 3.11 Response table for SN for vicker’s hardness
http: // www.ijrtsm.com© International Journal of Recent Technology Science & Management 15
ISSN : 2455-9679
[Jitendra et al. , 3(9), Sept 2018] Impact Factor : 2.865
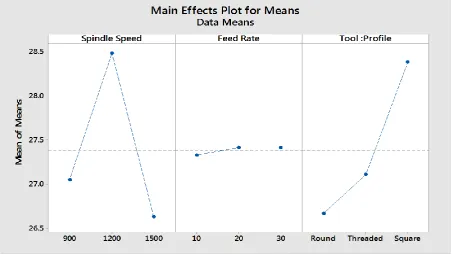
Fig. 3.10 Main effects plot for means for vicker’s hardness
http: // www.ijrtsm.com© International Journal of Recent Technology Science & Management 16
ISSN : 2455-9679
[Jitendra et al. , 3(9), Sept 2018] Impact Factor : 2.865
3.10 DETERMINATION OF OPTIMUM SOLUTIONFig 3.12 Percentage contribution of process parameters on tensile strength
http: // www.ijrtsm.com© International Journal of Recent Technology Science & Management 17
ISSN : 2455-9679
[Jitendra et al. , 3(9), Sept 2018] Impact Factor : 2.865
IV.
CONCLUSION
4.1 CONCLUSIONS FOR TENSILE STRENGTH VALUE
The subsequent conclusions are finished via the analysis
• It can hence be concluded that use of square tool profiles yield better results than that of the square tool and round with thread tool profiles.
• The tensile strength increases with increase in the spindle speed. The optimum value of process parameters such as spindle speed, feed rate and tool profile are found to be 1200 rpm (level 2), 20 mm/min (level 2) and square tool pin (level 3) respectively.
• The maximum tensile strength achieved was 28.97 MPa while welding at 1200rpm with 20 mm/min feed using the square tool.
• The analysis of variance for the tensile result concludes that the spindle speed is the most significant parameter with a percentage of 45.98%, followed by the feed of 0.12% , spindle speed 45.98 % and error percentage 9.69% . Friction stir welding is applied successfully for AA5086 H32- AA6061 T6 grade aluminium alloy by milling machine.
4.2 CONCLUSIONS FOR HARDNESS VALUE
• It can hence be concluded that use of square tool profiles yield better results than that of the round tool and round with thread tool profiles.
• The hardness increases with increase in the tool feed rate. The optimum value of process parameters such as spindle speed, feed rate and tool profile are found to be 1200 rpm (level 2), 30 mm/min (level 3) and round tool pin profile (level 3) respectively. The maximum hardness value achieved was 55.53 HV while welding at 1200 rpm with 30 mm/min feed using the square tool.
The analysis of variance for the hardness value result concludes that the feed rate is the most significant parameter with a percentage of 5.55 %, followed by the spindle speed 17.72 % and feed rate 75.34 % and error 1.56%
• Friction stir welding is applied successfully for AA5086 H32- AA6061 T6 grade aluminium alloy by milling machine.
.
V.
FUTURE
SCOPE
• The conclusions presented in this section may be used to develop methods to enhance specific properties for industrial applications. The selection of the welding parameters used fully determines the tensile behaviour of the material. Accordingly, specific parameter combinations may be chosen for industrial applications in order to develop enhanced properties of frictions stir welds in the AA5086 H32- AA6061 T6 grade aluminium alloy.
• There are several suggestions for this study. These include further tests and analysis of sample response to both static and dynamic loads.
• Perform tensile testing on a larger set of welding parameters with multiple tests for each set of welding parameters.
http: // www.ijrtsm.com© International Journal of Recent Technology Science & Management 18
ISSN : 2455-9679
[Jitendra et al. , 3(9), Sept 2018] Impact Factor : 2.865
• Analyze the residual stress distribution for several sets of welding parameters using the accurate methods to determine how residual stresses change with welding parameters.
REFERENCES
1. Ali Akbar Nadim, Hakeemuddin Ahmed (2014), “Design, Fabrication and Testing of Friction Stir Welded Joints”, International Journal of Innovative Research in Science, Engineering and Technology, Vol. 3, Issue 11, PP: 17261-17268.
2. Sivakumar, Vignesh Bose (2014), “Review Paper on Friction Stir Welding of various Aluminium Alloys”, IOSR Journal of Mechanical and Civil Engineering, Vol. 3, Issue 4, PP: 46-52.
3. G. Gopala Krishna, P. Ram Reddy, M. Manzoor Hussain (2014), “Mechanical Behaviour of Friction Stir Welding Joints of Aluminium alloy of AA6351 with AA6351 and AA6351 with AA5083”, International Journal of Engineering Trends and Technology, Vol.10, Issue 4, PP: 161-165.
4. Sadeesh P, Venkatesh Kannan M, Rajkumar V, Avinash P, Arivazhagan N, Devendranath Ramkumar K and Narayanan S (2014), “Studies on friction stir welding of AA 2024 and AA 6061 dissimilar metals”, 7th International conference on materials for advanced technology, Vol.3, Issue 5, PP: 145–149.
5. Sachin Kumar, Deepak Bhardwaj, Jagdeep Sangwan (2014), “A Research Paper on Temperature Modelling of Friction Welding of Aluminium and Stainless Steel-304”, International Journal of Enhanced Research in Science Technology & Engineering, Vol. 3 Issue 6, PP: 319-327.
6. Prakash Kumar Sahu, Sukhomay Pal (2015), “Multi-response optimization of process parameters in friction stir welded AM20 magnesium alloy by Taguchi grey relational analysis”, Journal of Magnesium and Alloys 3, Vol. 5, Issue 1, PP: 36-46.
7. Vanita S. Thete, Vijay L. Kadlag (2015), “Effect of Process Parameters of Friction Stir Welded Joint for Similar Aluminium Alloys H30”, Int. Journal of Engineering Research and Applications, Vol. 5, Issue 5, PP: 10-17.