ISSN 1822–8402 EUROPEAN INTEGRATION STUDIES. 2012. No 6
CURRENT ASSETS STRUCTURE AND EXPLORATION OF BUSINESS IN LATVIA
Iluta Arbidane, Elvira Zelgalve
Rezekne Higher Educational Institution,University of Latvia, Latvia e-mail: [email protected], [email protected]
http://dx.doi.org/10.5755/j01.eis.0.6.1518
Current assets as the object of the study of foreign authors in the literature and studies have been studied sufficiently, and this object is viewed in different sub-sectors. In Latvia for the current asset management has not been extensive research. New specific circumstances in which business takes place, limited availability, high investment risk, highly competitive, new requirements in connection with accession to the EU makes it necessary to plan investment in the development, improvement and expansion. Mission statement becomes effective on the company’s existing and future resource planning and management of the production process by using new management methods in the ever changing economic conditions. Increasingly important in the control system acquires an objective need time to identify problems and determine the most current options for managing the assets.
In order to ensure the financial sustainability of companies under current economic conditions successful management of current assets is crucial. In practice it is quite often observed that the decisions of current assets management in companies are made in the short-term aspects not making analysis. The aim of the article is to explore and analyse the structure of current assets the effectiveness of the indicators characterizing the Latvian business changing economic conditions. In order to reach the aim the author solves the following tasks in the research: to explore and analyse the structure of current assets, its changes and trends in the companies of Latvia; to perform calculations and analysis of the indicators characterizing the effectiveness of current assets; basing on the analysis to evaluate the development tendencies of the structure and indicators of current assets at various stages of economic development and to determine the correlations between these indicators. The research is based on the data obtained by the Central Statistics Bureau. The research covers the period of 1995–2010. Study involve the use of conventional logic analysis and synthesis methods, content analysis and analysis of monographic. The article is focused on the exploration and analysis of the Latvian statistical data describing the amount, structure of current assets in business and its changes at various stages of economic development. Performing the analysis of current assets in the national economy of Latvia in general there are calculated and analysed various indicators, for example, liquidity, turnover of current assets, working capital. The research does not deal with the analysis of current assets in the aspect of branches. The calculations let estimate the changes of these indicators and their correlations as well as trends in the companies of Latvia. The current assets of companies in Latvia, their structure and indicators to a large extent are influenced by the economic situation in Latvia. Under conditions of a stable and flourishing economic situation companies have stable development indicating balanced increase of financial indicators. Upon increase of net turnover the amount of current assets also increases. When the national economy and business indicators improve, the proportion of assets flexibly reacts by increasing the proportion of current assets in the total structure of assets. However, when business activity decreases, the proportion of assets in the total structure of assets reduces. As a result of analysis there can be observed a correlation that the amount of stock and debts of debtors are interrelated with the net turnover of companies. The dynamics of cash and short-term securities shows that in the economic recession period it even increases. The economic situation in the state does not change very significantly the indicators of the current assets structure. Slight changes in the proportion of stock and cash prove that under condition of recession the managerial staff of Latvian companies pays attention to introduction of effective current assets management. The changes of current assets and their decrease in the recession period indicate that economic processes influence this indicator. The analysis of liquidity indicators did not reflect significant correlation between economy and changes of these indicators; however, the companies of Latvia typically do not have high liquidity indicators which shows some problems, but which cannot be identified not knowing certain conditions. The analysis of the structure and indicators of current assets using a maximally longer period of time enables to make timely and effective managerial decisions.
The study is based on the literature and scientific publications, analysis and evaluation of commercial financial indicators and their role in the company’s performance evaluation. The study results may be useful in Latvian commercial owners and management, as well as public and private bodies which carry out macro-economic indicators and business analysis.
Introduction
Nowadays when the national economy and companies experience significant changes and various economic events occur both from the side of business entities and state legislation more and more attention is paid to business management. More emphasis is put on the necessity for efficient resources management. The economic measures of any company and its competitiveness directly depends on managerial staff skills to analyse the current situation and basing on the results of analysis make economically correct decisions and also plan further actions. A developing, financially stable and competitive business entity not only in the local, but also global market is a sufficiently strong base for the overall state development, stabilization of its economic condition.
In order to ensure financial sustainability of a company under current economic conditions successful management of current assets of a company is essential. Current assets and their management opportunities in business context in Latvia have not been throughout researched in Latvia. However, in Russia, the EU, the USA and other states such researches are widespread. As the empirical researches of the author prove, the decisions of current assets management, especially in small and medium-sized companies, quite often are short-term not analysing the performance of previous periods. In order to pay attention to the current assets management problems in some companies, it is significant to analyse current assets and the indicators characterizing their efficiency in Latvia. It lets make significant conclusions about business development tendencies in Latvia; it is a comparative base to make analysis in the aspect of an individual company.
The aim of the article is to explore and analyse the structure of current assets the effectiveness of the indicators characterizing the Latvian business changing economic conditions.
The present article has the following tasks:
• to explore and analyse the structure of current assets, its changes and trends in the companies of Latvia; • to calculate and analyse the indicators characterising
the efficiency of current assets;
• to evaluate the development tendencies of the structure of current assets and their indicators in various stages of economic development basing on the performed analysis as well as to determine the interrelations of these indicators.
The research is based on the data obtained by the Central Statistics Bureau.
The research covers the period of 1995–2010.
The research is based on conventional logic analysis and synthesis methods, content analysis and analysis of monographic.
In order to evaluate the quality of current assets, determine and interpret the efficiency indicators, various analytical methods have been historically created and applied. Qualitative analysis is a precondition of the correct, timely and objective decisions to be made being the basis of successful business performance. Analysis is one of the major components of the managerial system aimed at provision of stable company development and it is a precondition for making decisions (Novašina, 2005, Brigham, Houston, 2001). Therefore, in the author’s opinion, it would be incorrect for managers to exclude this
stage or pay insufficient attention to it because thus the company envisages exploration of the essence, interrelations, tendencies and phenomena of the economy, business activities of all levels and social sphere, analysis is widely use to perform these activities serving as the main precondition for forecasting, planning and managing economic objects and their processes. Exactly analysis provides an opportunity to substantiate scientifically the accepted activities and decisions in the field of economy, social-economic policy and facilitate the choice of the best alternatives. Therefore, analysis gains economic nature facilitating formation of independent analysis, which is called economic analysis by theoreticians. On practice it is often observed that the current asset management business decisions are made without an analysis of short-term perspective. Factors affecting the company’s determination is based on the company’s research complex, while the results of the analysis serves as a base for future development strategy and management decision-making (Averina,2009).
Economic analysis, due to external and internal environment, is divided into macro- and microanalysis where in the first case analysis refers to the exploration of the processes of the national economy, but microanalysis envisages research of the business entity and events related to its performance, which is often expressed as the analysis of financial-economic activities. The scientific literature mentions the 1970s as the origin of financial analysis when the information of financial statements was requested to grant loans. It provided an opportunity to make comparative data analysis. Gradually upon development of the financial analysis approach the interrelations of financial indicators were searched for. Exactly since this period of time assets have been grouped into current and non-current assets and current assets have been compared with short-term liabilities (Foulke, 1961). Current assets by their nature are dynamic. In the company functioning process their amount and structure change all the time. More complete view on qualitative changes in the structure of resources and the structure of their sources as well as the dynamics of their changes can be obtained by vertical and horizontal analysis. One of the simplest financial analysis methods is considered to be the horizontal analysis method of company financial statements envisage the research of changes of absolute indicators. Great changes of the indicators of the most important financial statements items have significant influence on the stable development of company business performance in the future. However, it is important to note that not always conclusions and statements made on the analysis of changes in items can be completely correct because the analysis of the causes of these changes is essential. Vertical or structural analysis is made to find out the proportion of individual statement items in the total sum which is assumed to be 100 per cent. There can be distinguished two basic characteristics determining the necessity and effectiveness of making vertical analysis:
• transition to relative indicators let make the inter-business comparison of economic potential and comparison of performance results of companies differing by the amount of used resources and other indicators of amount;
make it difficult to compare them managerial system will be destroyed or weakened and qualitative results will not be reached. As the economic system
in dynamics (Kovalev,2006).
Similarly to the complete analysis of the balance the structure of current assets and its changes by periods can be analysed separately assuming that the total sum of current assets is 100 per cent and calculating the proportion of currents assets items. Vertical and horizontal analysis complements each other. This analysis helps compare companies, besides, relative indicators even up the negative impact of inflation processes (Bank, 2006). English scientists (Alexsander, Britton, Jorissen., 2009) explain the term of vertical analysis by the result achieved by the company, e.g., comparison of the state reflected in the balance at a certain period of time with the respective average results of other companies or branches.
The American scientist Higgins (2007) acknowledges that efficient business performance of a company can be ensured by being aware of management methods and activities. In order to explore these managerial aspects deeper there shall be researched the impact of prior activities, decisions on the financial state of a company which is ensured using the analysis of financial coefficients. Financial coefficients are relative indicators letting evaluate dynamics and analyse indicators by branches (Jefimova, 2006).As a result of prior researches the author dares to express an assumption that Latvian researchers also consider the method of financial coefficients to be the most important. In scientific papers under the headlines of financial or statements analysis the most frequently the aspects of coefficient calculation and application are researched. Foulke (1961) in his works indicates that exactly since 1891 has been used the liquidity coefficient, current assets/ short-term liabilities. Division of current assets into three groups by the degree of their liquidity lets distinguish three analytical coefficients which can be used for summarizing assessment of liquidity, e.g., coefficients of total, inter-coverage and absolute liquidity. In 1930 Smith (1930) in his researches noted significant coefficients describing company’s business performance as sustainable which prove negative tendencies. As regards current assets and their management Smith R. mentions liquidity indicators and working capital indicators. In scientific literature a lot of attention is paid to current or working capital describing the correlations between current assets and short-term liabilities. The basic characteristic of capital is providing gains. Capital is a production factor (Samuelson, Nordhaus, 1989). Net working capital is a margin between current assets and short-term liabilities (Breili, Maier, 1997). Positive working capital demonstrates efficient management of current assets. Such scientists as Newton (2003), Fitzpatrick (1932), Beaver (1967,1968), Arnold (2008), Drake (2010), Amarjit (2010) have devoted their researches to exploration of financial analysis indicators, for example, structure, liquidity, return and their regularities. Currently their cognitions are the basis of financial analysis as regards current assets. Hofs, Marinska, (2002) consider that by the analysis of (financial) statements companies gain a range of key indicators which both individually and in the context of several periods provide useful information and basis for making decisions about the opportunities for current assets management. Financial analysis experienced the most rapid development in the beginning of the 21st century, mainly due
to the impact of two factors. Firstly, the economic crises of the 20th century activated scientific activities oriented towards search for objective methods of analysis which could serve as a safe basis for the decisions of company managers regarding development of economic activities and investments. Secondly, rapid development of information technologies and computer sciences facilitated wide opportunities for processing and exchanging economic information (Šnaidere, 2004). Santoro (2008) concludes that the main difference between companies that successfully adapt to current economic situation and the companies who can’t do it so well, is their ability to correctly learn the processes and technologies that help raise awareness of current asset management.
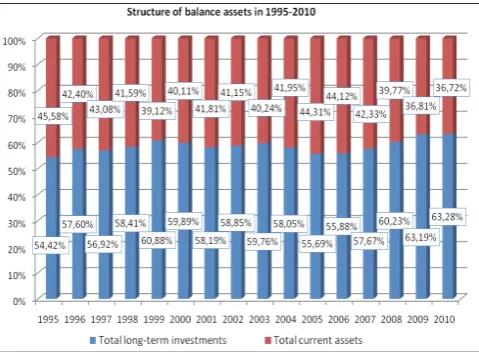
Figure 1. Structure of balance assets in companies of Latvia in 1995–2010 (%) (compiled by the author according to the data of the Central Statistical Bureau)
Current assets comprise a significant part of assets in the company balance. According to the total sum of current assets the potential, solvency and liquidity of the company are evaluated. In each individual company the amount of current assets, their composition and structure depend on the nature and complexity of production, production cycle, costs of raw materials, terms of raw materials supply, procedure of payment, etc. In some branches the proportion of current assets in total assets of the company differs.
assets also increases. The structure of assets to a large extent is influenced by the branch the company represents. In this research the aspect of branches is not explored.
When the economic situation worsens, what actually already started in the USA in 2007 and in Latvia in 2008, we can see in Figure 1 that the structure of current assets of the companies changes too. Current assets are mobile company assets flexibly reacting to business indicators. Upon decreasing business activity net turnover drops as well; in the period of time from 2007 (34 067 million LVL) to 2010 (28 108 million LVL) it has reduced by approximately 17.5%, besides, the proportion of current assets in the total structure of assets also decreases. According to the data seen in Figure 1 it can be concluded that since 1995 there has been the lowest proportion of current assets in the structure of company assets in the period from 2008 to 2010, respectively in 2008 - 39.77%, 2009 - 36.81%, 2010 – 36.72%. As the empirical researches of the author prove in this period the companies of Latvia have a necessity to introduce essential measures regarding the stock level formation policy, debtors’ discipline which also influence the amount of current assets and the structure of assets. They are considered to be essential internal factors influencing the structure of assets.
Figure 2. The structure of balance current assets in the companies of Latvia in 1995–2010 (million LVL) (compiled by the author according to the data of Latvian Central Statistical Bureau)
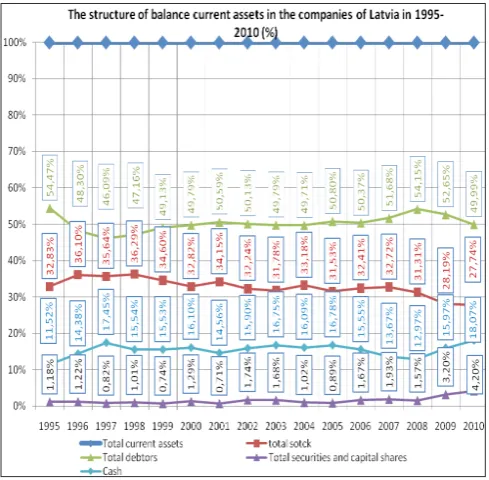
As an essential aspect of the analysis of current assets in the scientific literature is considered a separate type of structure of current assets. Nazir and Afza (2008) explains that companies can reduce the risk of current asset management and improve the overall working capital levels, properly understand the role of business in this category. As it has been mentioned above, the proportion of current assets in companies flexibly reacts to the development of economy in the world and in Latvia. The data depicted in Figure 2 prove that there are certain regularities in the change of the current assets structure. According to the data of Figure 2, it can be concluded that in the period of time from 1995 to 2010debts of debtors comprise the largest part in
the structure of current assets. As the analysis of the current assets structure shows, the debts of debtors sharply increased in the period from 1995 to 2008 if calculated in monetary units. The amount of debtors’ debts has increased 7.4 times in the period from 1995 to 2008, which is almost proportional to the increase of turnover by 7.9 times in the respective period. During the economic crisis in Latvia since 2008 the amount of the debts of debtors has reduced, similarly as the net turnover of companies. The changes in the stock amount in the respective period are similar to the changes observed in the debts of debtors. As a result it can be concluded that the amount of stock and debtors’ debts are interrelated with the net turnover of companies. The dynamics of cash and short-term securities seen in Figure 2 causes interest. As we can see, the dynamics of these two kinds of assets in the period of economic recession does not decrease, but even increases. Therefore, it can be concluded that the managerial staff of companies accumulate cash in enterprises or invest in short-term securities. Instability causes concerns about the future and companies make so called “safety bags”.
Figure 3. The structure of balance current assets in the companies of Latvia in 1995–2010 (%) (compiled by the author according to the data of Latvian Central Statistical Bureau)
finds that firms that focus on money management companies with more seasonal in nature. While small businesses are focusing on inventory management. American economist Amarjit, G. (2010) in his study shows receivables that slowly leads to low profitability
Prior analysis of assets and current assets caused author’s interest to explore the indicators of current assets turnover. Due to restricted statistical data it is impossible to analyse all turnover indicators. Therefore, Table 1 provides only summary of debtors’ debts and current assets turnover indicators. As it is seen in Table 1, in the period of economic growth these indicators are quite similar and fluctuations are not significant. Under conditions of the economic crisis the turnover indicators have a tendency to decrease. Especially rapidly this indicator
decreased in 2009, respectively the turnover of debtors’ debts was 4.4 times per year and the turnover of current assets – 8.1 times per year. As it is seen in Table 1, in 1995 and 2010 these indicators are quite similar and show efficient management of debtors’ debts and current assets turnover. Therefore, it can be concluded that under economic recession in Latvia the managerial staff of companies pays attention to introduction of effective management of current assets. The empirical researches of the author let expression an opinion that during this time special attention was paid to the discipline control of debtors, which to a large extent determine positive changes in the turnover indicators.
Table 1 Indicators of current assets turnover (times per year) from 1995 to 2010 (compiled by the author according to the data of Latvian Central Statistical Bureau)
Indicator 1995 1996 1997 1998 1999 2000 2001 0220 2003 2004 2005 0620 2007 2008 2009 2010 Turnover
coefficient of
debtors’ debts 4.2 5.0 5.6 6.2 5.0 5.5 5.6 6.2 5.5 5.1 4.9 5.4 4.6 4.6 3.9 4.4 Turnover
coefficient of
current assets 8.6 10.5 11.4 11.5 12.0 11.9 11.8 12.3 12.2 12 11.5 10.8 10.1 9.2 8.1 8.8
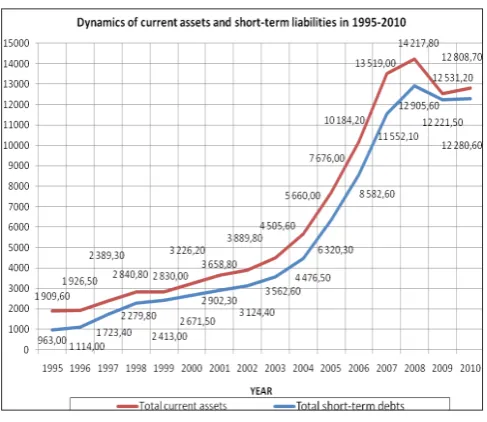
Figure 4. Dynamics of balance current assets and short-term liabilities in the companies of Latvia in 1995–2010 (million LVL) (compiled by the author according to the data of Latvian Central Statistical Bureau)
In Figure 4 depicts the dynamics of current assets and short-term liabilities in the respective period showing the development tendencies of these two indicators. From1995 to the economic crisis of 2008 current assets and short-term liabilities had been increasing quite equally making a positive and stable level of working capital mostly fluctuating at the level of 20 %. The level of working capital slightly decreased from 1998 to 2001. Similarly significant changes were observed in the period from 2008 to 2010, when working capital rapidly reduced below 10 %. The indicator reached
its critical limit in 2009, when working capital comprised only 2%. In 2010 there was observed improvement, which lets conclude that the management of current assets improves in the companies of Latvia. Comparing the changes of current assets in Figure 4 with the structure of assets in Figure 1 it can be concluded that there is definite interrelation. Working capital reduces in the periods when the proportion of current assets in the balance decreases as well.
In the scientific literature researchers describe this interval of these indicators as an optimal one differently. The author will be base the analysis of liquidity indicators on prior theoretical cognitions. The total liquidity indicator characterizes the ability to cover short-term liabilities using current assets. It is assumed that this indicator shall be within the limits of 1-2 according to the opinions of various authors. As it is seen in Figure 5, the total liquidity indicator in the companies of Latvia in the period from 1995 to 1998 has a tendency to decrease from 2 to 1.2. In further periods this indicator stabilized within the limits of 1.2 -1.3, but did not reach 1.5 or 2, which some scientists consider to be the optimal level. In 2008 this indicator had a tendency to decrease and in 2009, 2010 this indicator reached its critical limit of 1 having a slight tendency to improve in 2010. It can be concluded that under conditions of booming economy the total liquidity indicator stabilized in the companies of Latvia and for a short period stayed at the same level, but the economic crisis has influenced the liquidity indicator negatively. The current liquidity coefficient or inter-coverage coefficient describes the ability of the company to cover short-term liabilities using current assets, except stock. The norm of this indicator is within the limits of 1 or above 1. As it is depicted in Figure 5 this indicator has a similar tendency to change in the respective period as the total liquidity indicator, but the attention is drawn by the fact that this indicator had not reached its optimal limit of 1 in the period from 1998 to 2010. It proves that overall in the companies of Latvia there are significant problems to cover one’s liabilities in the short-term. The absolute liquidity coefficient shows company’s ability to cover term liabilities using cash and short-term financial investments. There is still a discussion in the scientific literature about the optimal level, thus various authors describe this indicator within the limits from 0.1 to 0.7. As it is seen from the data in Figure 5, opposite to the indicators mentioned above the absolute liquidity indicator in the respective period has almost not changed. The indicator keeps quite even dynamics within the limits from 0.3 to 0.2, but not reaching the highest peak of 0.7. It can be concluded that the companies of Latvia can cover their liabilities in a sufficiently short period. The analysis of liquidity indicators in the companies in companies only describe the tendencies, but does not let make significant conclusions because these indicators require detailed information for analysis.
Conclusions
Summarizing the results of the analysis made within the research for the period from 1995 to 2010, the author concludes that the current assets, their structure and indicators in the companies of Latvia to a large extent are influenced by the economic situation in Latvia. Under conditions of stable and booming economy there is observed stable development in companies. When net turnover increases, the amount of current assets increases as well. Upon recovery of national economy and improvement of business indicators, the proportion of assets flexibly reacts to changes. Therefore, the proportion of current assets in the total structure of assets also increases. When business activity goes down, the proportion of current
assets in the total structure of assets also decreases. Changing economic situation in the negative direction, the companies held by the asset structure changes. Current assets flexibly respond to business performance. As a result of the business activity, hence the net turnover, decreasing the proportion of current assets to total assets structure. As a result of analysis there is observed regularity that the amount of stock and debtors’ debts are interrelated with net turnover of companies. The dynamics of cash and short-term securities shows that in the period of economic recession it even increases. In the study period from 1995 until 2010 the working capital structure of most forms of receivables. As shown by the working capital structure analysis, the monetary units of the receivables in the period from 1995 to 2008 is likely to increase rapidly. Accounts receivable amount increases in proportion to the increase in turnover during this time. Latvian economic crisis of the 2008th of accounts receivable decreases, similar to the commercial net sales. The trend in stocks is similar to the changes of the amount receivable. As a result, it can be concluded that the inventory and the receivable is linked with a company’s net turnover. The difference in the dynamics of development in respect of cash and short-term securities. These two active dynamics of economic downturn instead of declining, but increasing. Thus, it can be concluded that the managerial staff of companies accumulate cash or invest in short-term securities. The analysis of the current assets structure lets conclude that the state economic situation does not significantly change the structure indicators. Slight changes in the proportion of stock and cash prove that under conditions of recession the managerial staff of the companies in Latvia pays attention to introduction of effective management of current assets. The changes of working capital and its reduction in the period of crisis indicate the impact of economic processes on this indicator. The analysis of liquidity indicators does not reflect significant interrelations of economy and changes of these indicators; however, it shall be concluded that high liquidity indicators are not typical for the companies of Latvia, which indicate certain problems, but which cannot be identified not knowing specific conditions. Latvian economy upward total liquidity ratio of commercial stabilization and long term remains nearly stable, but the economic crisis in the total liquidity ratio is affected negatively.
References
Alexander, D., Britton, A., Jorisen, A. (2009). International financial reporting and analysis. Cengage Learning EMEA, 894 p
Amarjit G. (2010). Relationship Between Working Capital Management And Profitability: Evidence From The United States [online] Business and Economics Journal, Vol. 10, p. 1-9 on-line data: http://mbatutorial.net/ articles/working-capital-management/BEJ-10_Vol2010. pdf
Averina J.(2009). Uzņēmuma vērtības saglabāšanu un palielināšanu ietekmējošie faktori, Latvijas Universitātes raksti, 744.sējums ,,Ekonomika un vadības zinātne: LU, pp.7-19.
Банк, В. Р., Банк, С. В. (2006). Финансовый анализ. Москва: Издательство Проспект, 345 p.
Beaver W. H. (1996) Financial ratios as Predictors of Failure, Empirical Research in Accounting – Selected Studies 1966 //Supplement to the Journal of Accounting Research, pp. 71–111.
Beaver W. H. (1968). Market Prices, Financial Ratios, and the Prediction of Failure //Journal of Accounting Research, pp. 179–192. http://dx.doi. org/10.2307/2490233
Брeйли Р., Майерс С. (1997). Принципы корпоративных финансов:Пер. с англ.- М.:ЗАО Олимп- Бизнес, pp.796- 798.
Brigham U.F., Houston J.F. (2001). Fundamentals of financial Management. ASV: Harcourt College Publishers, 2001. 748 p
Drake P. (2010). Financial ratio analysis. Journal of Business and Finance. Vol. 12. p. 1-14
Ефимов О.В., Мельник М.В.и.др. (2006).Анализ финансовой отчетности. 2-е изд. Москва: Омега-Л, pp. 234-269.
Higgins C. (2007). Analysis for financial management. New York McGraw-Hill Irwin, 8th ed., 432 p.
Fitzpatrick P.J. (1932). A Comparison of the Ratios of Successful Industrial Enterprises with those of Failed Companies //Certified Public Accountant, 1932, October, November, December, pp. 598–731.p
Foulke R.A.(1961). Practical Financial Statement Analysis. – 5–th ed. – McGrow–Hill Book Company, 611 p. Hofs, K.G., Marinska, K.(2002). Biznesa ekonomika. Rīga:
Jāņa rozes apgāds, tulkojums no norvēģu val., pp.308-309.
Ковалев В.В. (2006) Финансовый анализ: методы и процедуры. Москва: Финансы и статистика, 256-291.p.
Laziridis I., Tryfonidis D. (2006). The relationship between working capital management and profitability of listed companies in the Athens Stock Exchange. Journal of Financial Management and Analysis, Vol. 19, p. 1-12.
Ludboržs A. (2007) Apgrozāmā kapitāla vadīšana nelielos uzņēmumos.Rīga: Lietišķās informācijas dienests, pp.41-68.
Nazir, M.S. & Afza, T. (2009). Working Capital
Requirements and the Determining Factors in Pakistan. IUP Journal of Applied Finance, 15(4), 28-38.
Newton G. W. (2003) Corporate Bankruptcy. – John Wiley & Sons Inc, 280 p.
Needles, B.E., Powers, M., Crosson, S.V. (2002) Financial & Managerial Accounting. Boston, New York: Houghton Mifflin Company, 17.p.
Новашина Т.С., Карпунин В.И. и.др.(2005). Финансовый анализ.Москва: Московская финансово –
промышленная академия, pp.166-188.
Palepu K.G., Paul M.Healy, Erik Peel. (2010). Business analysis and valuation. IFRS edition: Text and Cases. Second edition Cengage Learning EMEA, p. 761 Peterson Drake, P., Fabozzi, F. J. (2010). The Basics of Finance: An Introduction to Financial Markets, Business Finance, and Portfolio Management. – New Jersey: John Wiley & Sons.pp.123-130. http://dx.doi. org/10.1002/9781118267790
Samuelson, P.A., Nordhaus, W.D. (1989) Economics. New York a.o.:Mc Graw-Hill, 963 p.
Santoro, D. (2008). Managing working capital in the new economic envoroment IBM global business services.
Vol.03008, p.1-6.
Smith R. F. (1930). A Test Analysis of Unsuccessful
Industrial Companies //University of Illinois, Bulletin 31. – University of Illinois Press, pp.11.-16.
Spīča, I. Finanšu analīzes, plānošanas un prognozēšanas metodika on-line data: http://www.slideshare.net/ zemunde/finanu-analzes-plnoanas-un-prognozanas-metodika
Statistics Databases of the Central Statistical Bureau: on-line data http://www.csb.gov.lv/statistikas-temas/ uznemejdarbibas-finanses-galvenie-raditaji-30309.html Thomas R. Robinson, Hennie van Greuning, Elaine Henry,
Michael A. Broihahn (2009). International Financial Statement analysis. CFA Institute, John Wiley & Sons, Inc., Hoboken, New Jersey, p. 828
Шатунов А.Н. ,Система управления оборотным капиталом предпринимателских структур. Экономика предпринимательства. Вестник Орел ГИЭТ, 2010, №3(13), 77-83
Šneidere R. (2004). Finanšu analīzes metožu vēsturiskā attīstība un to pielietojums uzņēmumu maksātspējas prognozēšanai. Ekonomika un vadības zinātne: Latvijas Universitātes raksti. Rīga: Latvijas Universitāte, 677. sēj., pp. 403. -412.
The article has been reviewed.