doi: 10.15171/rdme.2019.003 https://rdme.tbzmed.ac.ir/
Attitudes of faculty members towards using e-learning
Maryam Akbarilakeh1ID, Alireza Razzaghi2*ID, Hossein Delavar Pour Moghaddam1*ID
1Department of Medical Education, Shahid Beheshti University of Medical Sciences, Tehran, Iran
2Safety Promotion and Injury Prevention Research Center, Shahid Beheshti University of Medical Sciences, Tehran, Iran
Introduction
Today, the use of learning and teaching tools such as information technology and the internet is growing rapidly. E-learning is one of the most important learning environments in the information age. E-Learning generally includes any learning through digital media.1,2 E-Learning
is a large collection of applied software and educational methods, including computer-based education, web-based education, and virtual classrooms. E-learning is provided through computers, via electronic media, the Internet, organized networks such as extranets and intranets, satellite broadcasting, compact discs such as DVDs and
CD-ROMs.3 E-learning method can enhance interactive
learning by sharing resources, and can be beneficial both to learners and instructors. Some of these benefits include: easy and quick access to educational resources; providing a quick and easy way for creating, updating, and editing lessons through learning management software, flexible interaction with students, presentation independent from
the time and place.4
Efforts and experiences related to electronic learning around the world have highly taken for granted. In Iran, most universities are making extensive use of this technology. In Iran, most universities are making extensive use of this technology. In fact, some of them have started the admission of students for distance learning. However, effective development of electronic education in the country will not be successful without regarding the faculty members’ attitude.5
In teaching of medical science lessons, there has been a growing trend in replacing traditional teaching with e-learning, especially combined e-learning in other countries to meet the student’s needs regarding the ease of access to information and other technological capabilities.6
The remarkable point is that effective development of e-learning will not be successful without regard to the
attitude of instructors and students.7 Liaw and Huang
propose three factors in the design of effective e-learning
*Corresponding authors: Alireza Razzaghi, Email: [email protected];Hossein Moghadam, Email: [email protected]
© 2019 The Authors. This is an Open Access article distributed under the terms of the Creative Commons Attribution License
Publishing Group TUOMS
Article Type:
Original Research
Article History:
Received: 16 May 2019 Accepted: 19 June 2019 epublished: 30 June 2019
Keywords:
Attitudes E-learning Faculty members
Abstract
Background:Faculty member’s attitude is one of the most important factors in the success of electronic learning. Understanding the attitudes of teachers toward e-learning can lead to an appropriate learning environment. This study aimed at examining the attitude of faculty members towards e-Learning at Shahid Beheshti University of Medical Sciences in 2016.
Methods: In this cross-sectional study, 334 faculty members from the faculties of university were selected by random stratified sampling method and their attitude was assessed by questionnaires. Data was analyzed using SPSS 20.
Results: The mean age of subjects was 49.09 (SD = 7.41). Of the total study population, 57.75% (190) were males and 42.25% (139) were females. The highest mean score among the dimensions of attitude assessment was related to sense of enjoyment with a mean of 29.26 (SD = 0.71) and the lowest mean related to self-efficacy (mean = 5.96) (SD = 0.82).
Conclusion: The results of this study show that the attitude of faculty members is positive towards using appropriate e-learning. However, more studies are needed to assess the obstacles and approaches to improve the attitude of faculty members towards e-learning.
Article info
Please cite this article as: Akbarilakeh M, Razzaghi A, Delavar Pour Moghaddam H. Attitudes of faculty members towards using
environments: the characteristics of learners and instructors, the structure of learning, and interaction.8
If e-learning officials have a positive tendency toward e-learning, they will be motivated to use it, and specialized resources for this kind of training will result in higher
productivity.9 The attitude of instructors towards
information technology and e-learning has a significant relationship with their use of information technology.10
The acceptance of e-learning by faculty members and their positive attitude toward changing educational approach are the effective factors in the success of implementing the e-learning system and continuing its process.11 Based
on what mentioned, in order to use effective e-learning strategies and also with regard to the essential role of faculty members in a virtual educational system, recognition of their attitude towards the implementation of this educational method is necessary. The purpose of this study was to examine the attitude of faculty members toward electronic learning at Shahid Beheshti University of Medical Sciences.
Materials and Methods
Setting of study
In this study 334 faculty members were studied. The minimum sample size using the correlation coefficient in previous studies was calculated 300. Considering the 20% attrition in responding to the questionnaires, the sample size reached to 360. Finally, 342 faculty members participated in the study which removing the missing questionnaires there was 334 participated faculty
members. This analytical cross-sectional was conducted
in 2017 and aimed at examining the attitude of the faculty members at Shahid Beheshti University of Medical Sciences regarding e-learning.
Sampling method
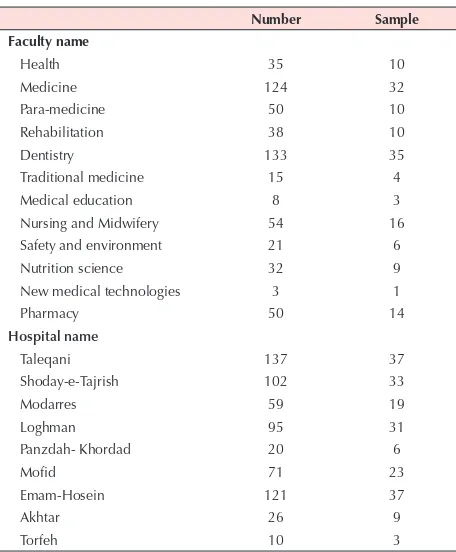
The sampling method in this study was the quota sampling. The number of memberships in faculties and hospitals was determined and then the proportional samples of each center was determined (Table 1).
After this stage, a number of faculty members previously calculated enrolled in the study using simple random sampling by referring to the faculty and the hospital. The faculty members were asked to participate in the study. In case they agreed to participate in the study, a questionnaire was given to complete. All the faculty members were assured that all the information including their names would be confidential and it was mentioned at the beginning of the questionnaire to highlight it.
The results of the Sayed Naghavi’s study, entitled,” The attitude of faculty members and students towards
e-learning”,12 was used to estimate the minimum sample
size required in this study.
The using instrument for gathering data
The tool used in this study was a questionnaire designed
Table 1. The number of faculty membership in Faculties and Hospitals and samples
Number Sample Faculty name
Health 35 10
Medicine 124 32
Para-medicine 50 10
Rehabilitation 38 10
Dentistry 133 35
Traditional medicine 15 4
Medical education 8 3
Nursing and Midwifery 54 16
Safety and environment 21 6
Nutrition science 32 9
New medical technologies 3 1
Pharmacy 50 14
Hospital name
Taleqani 137 37
Shoday-e-Tajrish 102 33
Modarres 59 19
Loghman 95 31
Panzdah- Khordad 20 6
Mofid 71 23
Emam-Hosein 121 37
Akhtar 26 9
Torfeh 10 3
by Alabdullaziz et al at the University of Colorado.13
This questionnaire localized in Iran by Naghavi.12 This
all questions in the questionnaire, the results of which are presented in Table 2.
Inclusion and exclusion criteria
The inclusion criteria were: Faculty members of the schools and hospitals affiliated to Shahid Beheshti University of Medical Sciences with not less than 6 months of job experience. Also, the faculty members who did not want to participate in the study were excluded from the study and were replaced by the other ones based on sampling.
The using statistical methods
The descriptive analysis was done using the mean and frequency analysis. Pearson correlation coefficient was used to examine the correlation of scores among the domains studied and questions. Multivariate linear regression analysis was performed using backward method to determine the predictive factors of the faculty members’ attitude as well. In multivariate linear regression the covariates of age; sex and the work experience were considered as potential confounders. Prior the applying the analysis the required assumptions were tested to ensure the using test is correct. The analysis was done using SPSS version 20 and AMOS version 20.
Results
Descriptive results
In this study, 334 faculty members were studied. The mean age of the subjects was 49.09 (±7.41). In terms of sex. In this study 190 were male (57.75%) and 139 were female (42.25%). The mean job experience was 15.77
years (±7.65). In terms of academic degree, the number of the full professors were 49 (14.7%), associate professors 85 (25.4%), assistant professors 180 (53.9%) and instructors 14 (2.4%).
The results of univariate analysis
The highest coefficient for Cronbach’s alpha was seen for the domain of intention to use e-learning with 0.895. The total coefficient was 0916 (Table 3).
The highest average score was for the question: “I am satisfied with the use of online teaching”, in area of sense of satisfaction in the use of e-learning (Table 4). The highest correlation coefficients were seen between the domains of satisfaction with the use of e-learning and intention to use e-learning with 0.59. the lowest coefficient was seen between the domains of Multimedia educations and Self-efficacy (Table 5). All Pearson correlation coefficients among the domains were statistically significant. According to total score, the highest correlation coefficient with the total score of attitude was related to the sense of enjoyment and multimedia teaching.
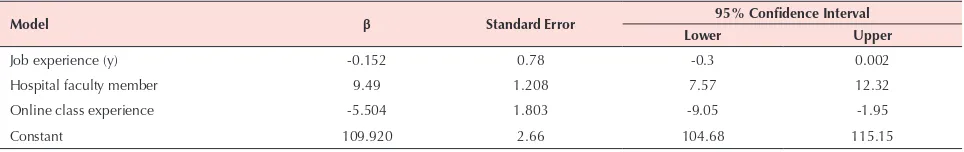
The results of multivariable linear regression model The results of linear regression analysis were modeled in 6 steps. In step 6 of the modeling, the variables of job experience, place of work and experience with text processor software were statistically significant. The results of this study show that the attitude score decreases by as much as 0.152 if the job experience of the faculty members increases one year. In terms of changing the
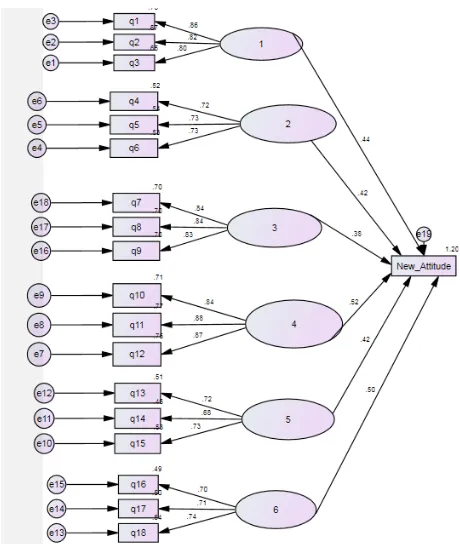
Figure 1. Confirmatory factor analysis diagram.
Table 2. Fit indexes in confirmatory factor analysis
Fit indexes Observed values
Chi-square 1204
Degrees of freedom 247
The significance level 0.01
The ratio of chi-square to degree of freedom 4.87
Goodness of fit index 0.951
Adjusted goodness of fit index 0.901
Bentler-Bonnet normed fit index 0.929
Comparative fit index 0.931
Root mean square error of approximation 0.081
Table 3. Cronbach’s alpha coefficients for each domain
Domain Cronbach's alpha coefficient Self-efficacy in using e-learning 0.86
Interest in using e-learning 0.765
Usefulness in using e-learning 0.874
Intention to use e-learning 0.895
Satisfaction with the use of e-learning 0.747
Multimedia educations 0.751
place of work, the results indicated that changing the place of work from faculty to hospital, the attitude score increased to 9.949. In addition, the faculty members who do not have experience working with text processor software, the attitude score is reduced by as much as 5.504 (Table 6). The regression fit model using the coefficient of determination (R2) indicates that the variables of the
model justify about 19% of the changes in the attitude of the faculty members (R2 = 0.188).
Discussion
In this study, six sections of self-efficacy, perceived enjoyment, perceived usefulness, the intention of using e-learning, satisfaction and multimedia education in relation to the attitude of faculty members towards e-learning was reviewed using 7-Likert scale questionnaire that range from totally disagree (1) to totally agree (7).
Feeling self-efficacy in using e-learning
“Self-efficacy” is defined as individuals’ beliefs about their capabilities to produce designated level of performance. Faculty members’ self- efficacy is remarkable in the use of e-learning and the results of studies have shown that the behavioral tendency and satisfaction of faculty members and students to use e-learning systems are affected by self-efficacy of individuals.14,15 In the present study, the mean
score of self-efficacy scale was 5.96. In other words, it was in the domain of “I agree” to use e-learning in Likert scale. In this study, the correlation between “self-efficacy” with total score of attitude was 0.67. The “self-efficacy” scale had the lowest correlation with the total score of attitude compared to other scales. However, in the Alabdullaziz et al study, this scale had the highest correlation with the total score of attitude (0.78).13 In a study, researchers found
that sense of self-efficacy can be effective in behavioral
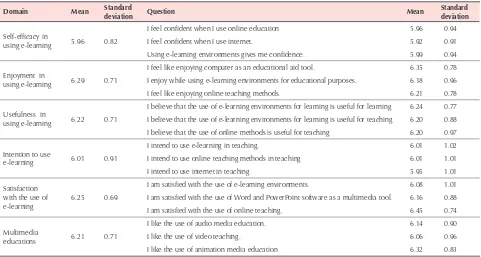
Table 4. Mean and standard deviations of domains and items of faculty members’ attitude assessment toward electronic learning
Domain Mean Standard deviation Question Mean Standard deviation
Self-efficacy in
using e-learning 5.96 0.82
I feel confident when I use online education 5.96 0.94
I feel confident when I use internet. 5.92 0.91
Using e-learning environments gives me confidence. 5.99 0.94
Enjoyment in
using e-learning 6.29 0.71
I feel like enjoying computer as an educational aid tool. 6.35 0.78 I enjoy while using e-learning environments for educational purposes. 6.18 0.96
I feel like enjoying online teaching methods. 6.21 0.78
Usefulness in
using e-learning 6.22 0.71
I believe that the use of e-learning environments for learning is useful for learning 6.24 0.77 I believe that the use of e-learning environments for learning is useful for teaching 6.20 0.88 I believe that the use of online methods is useful for teaching 6.20 0.97
Intention to use
e-learning 6.01 0.91
I intend to use e-learning in teaching. 6.01 1.02
I intend to use online teaching methods in teaching 6.01 1.01
I intend to use internet in teaching 5.95 1.01
Satisfaction with the use of e-learning
6.25 0.69
I am satisfied with the use of e-learning environments. 6.08 1.01 I am satisfied with the use of Word and PowerPoint software as a multimedia tool. 6.16 0.88
I am satisfied with the use of online teaching. 6.45 0.74
Multimedia
educations 6.21 0.71
I like the use of audio media education. 6.14 0.90
I like the use of video teaching. 6.06 0.96
I like the use of animation media education 6.32 0.83
Table 5. Coefficients of correlation among the studied domains
Domain Self-efficacy Self- enjoyment Sense of usefulness Intention to use e-learning Satisfaction with the use of e-learning Multimedia educations Total attitude score
Self-efficacy 1 0.44 0.35 0.44 0.41 0.34 0.67
Self- enjoyment 0.44 1 0.55 0.45 0.57 0.51 0.77
Sense of usefulness 0.35 0.55 1 0.51 0.58 0.43 0.75
Intention to use e-learning 0.44 0.45 0.51 1 0.59 0.42 0.78
Satisfaction with the use of e-learning 0.41 0.56 0.58 0.59 1 0.54 0.81
Multimedia educations 0.34 0.51 0.43 0.42 0.54 1 0.71
intention of faculty members in the use of e-learning. An important point in this regard is the easy use of e-learning tools and techniques. To ensure successful electronic learning, people need to be able to easily work with modern educational technologies and have the experience and ability to develop an e-learning program and use different audio and video media.16,17
Perceived enjoyment (sense of interest) in the use of e-learning
Perceived enjoyment points to the scope that a person perceives the activity of using a computer system only
for himself and apart from its instrumental value.18,19
“Perceived pleasure” is an internal motivation in individuals that affects the amount of technology used. “Perceived Enjoyment” is one of the key elements in the Technology Acceptance Model (TAM). The technology acceptance model has been defined to explain and predict behavior in decision making and to accept the use of a particular technology.20 In this study, the mean scores of
interest scale was 6.29. On Likert scale, this average score is in the “I agree” domain. Also, the amount of “sense of interest “ correlation with total score of attitude was 0.77. In some studies, the degree of “sense of interest” correlation with the total score of attitude was in the second place.13 In
a study by Ghotbadini and Moshkani aiming at evaluating the effect of computer self-efficacy and perceived enjoyment based on the Davis TAM, it was found that the effect of perceived enjoyment on the behavior intention to use computer and user perceived ease of use is stronger than self-efficacy.21 In the present study, the correlation of
perceived enjoyment with self-efficacy was 0.44. In other studies, the direct effect of perceived enjoyment on self-efficacy is such that, the more people perceive pleasure for the use of a computer only for its own sake, and apart from its instrumental value, the more positive their judgment is for their ability to use technology.21
Perceived usefulness in the use of e-learning
The mean score of the sense of usefulness scale in this study was 6.22. On Likert scale, this average score is in the “I agree” domain. In the study of Naghavi, With the aim of assessing the attitude of faculty members and students towards e-learning at universities with e-learning program, the results showed that the mean perceived usefulness scale on the Likert scale was “relatively agree”.5 It seems
that the faculty members at Shahid Beheshti University
of Medical Sciences are in a good situation regarding perceived usefulness. In educational models such as the TAM, some factors such as internal motivation, previous use, organizational support, education level are defined as external variables. These factors can affect the intrinsic variables such as “Perceived usefulness”. Perceived usefulness refers to the application of technology to the extent that a person believes that the use of a particular technology strengthens his performance. Perceived usefulness is a determinant of behavioral intention.21 It
has been shown that “perceived usefulness” of technology directly and significantly predicts the tendency of the use of technology by faculty members and has a direct and significant effect on it.22 E-learning is time and cost
effective for faculty members and educational officials because in this way, the materials are developed once and used repeatedly and in different places. The results of various studies have shown that e-learning is more efficient than traditional one, and learners are more pleased with this educational method.23
The intention to use e-learning
Behavioral intention is the use of technology by the user. “Behavioral intention” is derived from the attitude to the technology and leads to actual behavior in the individual.19
At the scale of “intention to use electrical training,” the average score was 6.17. In behavior models, various factors have been introduced on behavioral intention. Based on the planned behavior model, which is one of the behavioral models of concern for researchers, “behavioral intention” can indicate the individual’s motivation to adopt a behavior and behavioral intention “is also a result of an individual’s perception of the social norms on the people around and the environment, and the individuals’ perception about how much control they have over performing and not performing some behavior.24 A survey
on the attitudes of faculty members at virtual universities using the same tools used in this study showed that the average score of “behavioral intention” scale in this group of faculty was 5.61. In other words, it was in the scale of
“I agree to some extent” on the Likert scale.5 However,
the mean score was in the “I agree” on the Likert scale in the faculty members of the present study. Behavioral intention in using educational technology can directly be affected by the perceived usefulness and attitude toward
the use of technology.21 In this study, the behavioral
intention correlation with total score of attitude equal
Table 6. Multivariate linear regression analysis results
Model β Standard Error 95% Confidence Interval
Lower Upper
Job experience (y) -0.152 0.78 -0.3 0.002
Hospital faculty member 9.49 1.208 7.57 12.32
Online class experience -5.504 1.803 -9.05 -1.95
to 0.88 indicates a positive and strong correlation and with a perceived usefulness of 51.0 represents a positive and moderate correlation. In other words, the higher the behavioral intention level of faculty members to use e-learning will be, the higher their attitude towards e-learning will be. In a study conducted by Bashirian et al in 2014 with the aim of analyzing the predictive factors for intention to e-learning among faculty members using the planned behavior theory, it was found that 42.5% of participants in the study did not intend to use e-learning in the future. It was mentioned in this study that based on the findings of behavior theory, perceived behavioral attitude and control were used as predictors of behavioral intention in using e-learning.24
Satisfaction in using e-learning
Despite the potential benefits of information technology (IT) and the Internet in the field of education, the development and deployment of these technologies alone are not enough to take the educational advantages, but technology should be used by users. In case of dissatisfaction and the continued use of this type of technology, investment in the intended area will not be fulfilled. Hence, one of the important issues in the electronic learning system is identifying the needs of learners and educators, the educational behavior, and its usefulness. These characteristics are among the most important aspects of the interaction in the educational process, meeting of which satisfies both e-learning educators and learners. In this study, the average satisfaction level of e-learning was 6.25. On Likert scale, the mean score is in the “I agree” domain. In this study, the highest correlation of the scales with total score of attitude was for “sense of satisfaction”, 0.81. The average of faculty members’ satisfaction with the medical education system in the study of Naghavi was 5.68.5 On a Likert scale, the
mean score is in the “I agree to some extent” domain.
Multimedia educations
Multimedia education has made more progress in education in recent decades, and today, multimedia education has led the industrial societies be developed with the help of the electronic revolution. The invention of the computer and its increasing growth have got the attention of the educational authorities and planners. Utilizing multimedia education has many benefits; (1) Using multiple senses to learn, (2) More practicing to gain control, (3) Facilitate participation to build relationships between concepts, (4) Facilitate repetition of lessons for re-use, (5) cost-effective in terms of economic, (6) Flexibility of the program to the need of learners, (7) Establishing a two-way interaction and relation among users, and (8) Providing a friendly learning environment.25 The average
of the questions related to the multimedia education in this study was 6.21. On a Likert scale, the mean score is in the “I agree” domain, which reflects the agreement of
faculty members with the multimedia education program. In the study of Naghavi, using the same tool, the average
of multimedia education was 5.90.5
In this study, the results of multivariate linear regression analysis for the attitude score of faculty members regarding the use of e-learning showed that the place of work and job experience with text processor software were predictive factors on the attitude of faculty members. The attitude level in younger faculty members is more than other ones. Regarding the place of work, the attitude level of the faculty members working in the hospital is higher than those working in the faculty. Also, faculty members who have experience with text processor software have a higher level of attitude than others. Considering the fact that the effect of each variable is examined by controlling the possible effect of other variables on the attitude score, these results are of great importance and one can apply appropriate interventions to improve the attitude of faculty members in the university by identifying effective factors. In a study with the aim of examining the relationship between the dimensions of faculty members’ readiness for using e-learning, the results of multivariate regression analysis that introduced the variables of sex, age, academic degree, academic rank, job experience and the faculty showed that the PhD degree with a positive effect, and the master degree with negative affect the readiness (total scores of knowledge, attitude, facilities and skills) of faculty members in e-learning.16 Considering the
e-learning infrastructure is of great importance in creating e-learning in the academic system. In a study conducted in Tehran University of Medical Sciences in 2016, it was found that faculty members in the attitude section have scored more than half the total score (3.8 out of 5) and overall, a good attitude toward e-learning was observed in Tehran University of Medical Sciences. However, faculty members did not have enough knowledge about e-learning. In this study, technical support was in the highest priority in terms of the impact of using e-learning facilities from viewpoint of faculty members.26 The results of this study
show that in general the attitude of faculty members in using electronic education is appropriate in comparison with other universities. However, faculty members’ attitudes toward e-learning are not at the acceptable level in some universities. For example, in a study conducted by Ghanbari Khanghah and Moghadasi Rostamnia in Gilan University of Medical Sciences to examine the knowledge, skills and attitudes of faculty members and students about e-learning, it showed that 52.6% of faculty members had an undesirable attitude toward e-learning. About 80.8% of faculty members and students at Guilan University of Medical Sciences did not have enough knowledge about
e-learning environments.27 Also, identification of some
is suggested that obstacles in faculty members ‘attitude towards e-learning as well as teachers’ behaviors in e-learning- based learning be examined in future studies through qualitative study. According to findings of this study. it is recommended for policy makers in University that to pay more attention hospital faculty members by providing the related equipment. The results of this study can be used for planning about e-learning not only for Shahid Beheshti University of Medical Sciences, but also for other universities.
There are some limitations in our study. There is some potential source of bias in our study. For example, responding the participants to questions may have been mistaken in selecting the appropriate response in questionnaire. Also, the best method to study the attitudes of faculty members toward using the e-learning need to perform the qualitative and quantitative study using the mixed-method approach. This is only a quantitative study and it is suggested to carry out the mixed methods approach for futures studies.
Conclusion
The results of this study show that the attitude of faculty members is positive towards using appropriate e-learning. However, more studies are needed to assess the obstacles and approaches to improve the attitude of faculty members towards e-learning.
Competing interests
There is no any conflict of study for authors in this study.
Ethical approval
This study was approved at Shahid Beheshti University of Medical Sciences with the code of ethics IR.SBMU. RETECH.REC.1396.211.
Authors’ Contributions
All authors met the criteria of authorship based on the recommendations of the international committee of medical journal editors.
Acknowledgements
The faculty members of Shahid Beheshti University of Medical Sciences are thanked for their participating in this study.
References
1. Mason R. Globalising education: Trends and applications. New York: Routledge; 1998.
2. Abbas Zadeh N. Attitudes, barriers and motivations from the viewpoint of faculty members of Imam Ali to electronic learning. Modiryat Nezami Journal. 2012;47(12):35-70. [Persian].
3. Mirzaei M, Ahmadipour F, Azizian F. Viewpoints of students of Shahid Sadoughi University of Medical Sciences towards e-Learning in teaching clinical
biochemistry. The Journal of Medical Education and Development. 2012;7(2):67-74. [Persian].
4. Rossen E, Hartley D. Basics of e-learning. Alexandria, VA: American Society for Training and Development; 2001.
5. Seyed Naghavi MA. Evaluating the attitudes of faculty and students towards e-learning: A Survey on E-learning Universities in Iran. Quarterly Journal of Research and Planning in Higher Education. 2007;13(1):157-76. [Persian].
6. Thurmond VA. Defining interaction and strategies to enhance interactions in Web-based courses. Nurse Educ. 2003;28(5):237-41.
7. Smith B, Caputi P, Rawstorne P. Differentiating computer experience and attitudes toward computers: an empirical investigation. Comput Human Behav. 2000;16(1):59-81. doi: 10.1016/S0747-5632(99)00052-7.
8. Liaw SS, Huang HM. An investigation of user attitudes toward search engines as an information retrieval tool. Comput Human Behav. 2003;19(6):751-65. doi: 10.1016/S0747-5632(03)00009-8.
9. Liaw SS. Considerations for developing constructivist web-based learning. Int J Instr Media. 2004;31(3):309-21.
10. Oliver R. Assuring the quality of online learning in Australian higher education. Gold Coast: Norsearch Reprographics; 2001.
11. Yaghoubi J, Malek Mohammadi I, Iravani H, Attaran M. Desired characteristics of faculty members and students in E-learning in higher education of Iran: Virtual students’ viewpoint. Quarterly Journal of Research and Planning in Higher Education. 2008;14(1):159-73. [Persian].
12. Naghavi S. Study of teachers and students attitude toward e-learning: surveying in Iran’s e-learning universities. Quarterly Journal of Research and Planning in Higher Education. 2007;43:159-81. [Persian]
13. Alabdullaziz F, Alanazy MM, Alyahya S, Gall JE. Instructors’ and Learners’ Attitudes Toward e-learning within a College of Education. Available from: https://pdfs.semanticscholar.org/9be2/29d0e 81afdb3577303b004694bd7d47f74a3.pdf. Accessed date 29 June 2019.
14. Khorrami-Arani O. Researching computer self-efficacy. International Education Journal. 2001;2(4):17-25. [Persian].
15. Ambrose PJ. Metacognition and software developer competency: construct development and empirical validation. Issues in Information Systems. 2007;8(2):273-9.
[Persian].
17. Tucker S, Pigou A, Zaugg TD. e-Learning: making it happen now (Proceedings of the 30th annual ACM SIGUCCS conference on User services). Providence, Rhode Island, USA; ACM; 2002.
18. Hafsteinsson LG. The interactive effects of achievement goals and task complexity on effort, mental focus and enjoyment [dissertation]. Blacksburg, VA: Virginia Tech; 2004.
19. Yi-Cheng C, Yi-Chien LV, Ron-Chuen Y. Examining factors influencing behavioral intentions to use asynchronous web-based language learning. PACIS 2006 Proceedings; 2006. p. 65.
20. Teo T, Noyes J. An assessment of the influence of perceived enjoyment and attitude on the intention to use technology among pre-service teachers: A structural equation modeling approach. Comput Educ. 2011;57(2):1645-53. doi: 10.1016/j. compedu.2011.03.002.
21. Ghotbadini M, Moshkani M. The Effect of Computer Self-Efficacy and Perceived Enjoyment on Davis, Technology Acceptance Model Constructs. J Psychol. 2011;15(1):58-75. [Persian].
22. Seif M, Taleebi S, Alipour S. Factors associated with accepting and using information and communication technology among faculty members of Payam-e-Noor University (PNU). Global Journal on Technology.
2012; 2012:138-141.
23. Davis J, Chryssafidou E, Zamora J, Davies D, Khan K, Coomarasamy A. Computer-based teaching is as good as face to face lecture-based teaching of evidence based medicine: a randomised controlled trial. BMC Med Educ. 2007;7:23. doi: 10.1186/1472-6920-7-23. 24. Bashirian S, Jalilian F, Barati M, Ghaffari A. A study
on the predicting factors of intended e-learning among faculty members based on theory of planned behavior. Journal of Medical Education Development. 2014;7(15):10-21. [Persian].
25. Asgari A, Khaghanizadeh M. Multimedia method of education. Education Strategies Journal. 2009;2(4):173-6. [Persian].
26. Mohammadi A, Gharib M, Zolfaghari M, Mojtahedzadeh R, Ahmadian S. Knowledge, attitude and faculty members’ performance on e-Learning in Tehran University of Medical Sciences. Journal of Medical Education Development. 2016;11(2):104-16. [Persian].