A validated RP – HPLC method for simultaneous estimation of diacerine and aceclofenac in tablet dosage form
8
0
0
Full text
(2) 126. Chandran M et al., Int. Journal of Pharmacy & Industrial Research Vol – 02 Issue – 02 Apr – Jun 2012. DIC and ACE by RP-HPLC17, indicating HPLC. 19. 18. .. Stability. The purpose of this study. was to develop a shorter run time. And also to maintain. a lower PH 3.0. for reducing the. retension. Thus the peak tailing is minimised . So that it is a simple, rapid, precise and accurate. RP-. HPLC. method. for. the. simultaneous estimation of both the drug in combined tablet dosage form.. : 20 µl. Temperature. : Ambient. Construction of calibration curve: Standard stock solution of DIC and ACE were prepared separately in 50ml of mobile phase to get the concentration of 50mcg/ml and 500mcg/ml respectively. From the standard stock solution. calibration curves were constructed. (Fig 3.). on Shimadzu LC-10 ATVP solvent delivery system, with Shimadzu SPD-10 AVP UV – Visible detector and Rheodyne 7725i universal loop injector of injection capacity 20mcL. The equipment was controlled by a PC work station with Winchrom software. Ultra sonicator, Model Soltec -2200 MH was used. Reference standards of DIC and ACE were obtained as gift samples from Arthi drugs LTD and used as such, Pondicherry. The Tablet dosage form was procured from the local pharmacy, (Label claim : DIC 50mg and ACE 100mg),. All the chemicals and reagents used were of HPLC grade or Analytical Reagent from. Injection volume. injected and their peak area was measured and. Chromatographic separation was carried out. purchased. : 270 nm. of drugs, different dilutions were prepared,. Materials and Methods. grade. Detector wavelength. Qualigens,. Fine. Chemicals, Mumbai, India.. Physical mixture: From the standard stock solution of the drugs, physical mixtures containing DIC and ACE in the ratio of 2:12 ,4:10, 6:8, 8:6, 10:4, 12:2 respectively were prepared and analysed and. the results are. given in Table 1. Sample Preparation: Average weight of the tablet was determined by weighing twenty tablets. The tablets were crushed to a fine powder and the tablet powder equivalent to 100mg of ACE was transferred to 100ml volumetric flask, dissolved in about 60ml of methanol by sonication for 15 minutes and made up to the volume with methanol. The solution was filtered through Whatman filter paper#41.This filtrate was further diluted with mobile phase to get the final concentration of 80mcg/ml for DIC and 160mcg /ml for ACE.. Experiments and results:. The resulting solution was injected for. Chromatographic Condition:. quantitative analysis. The amount of DIC and. Column : Phenomenex Luna C18 column (150mm x4.6mm i.d, 5mm particle). ACE was calculated by using the calibration curve. The results are reported in Table 2.. Mobile phase : Acetonitrile: Methanol: buffer ( potassium dihydrogen ortho phosphate PH 3.0) in the ratio of35:20:45 %[v/v] was prepared and degassed with Ultra-sonicator. Filtered through 0.45µ membrane.. Validation of the developed method Specificity To evaluate the specificity solution of DIC, solution of ACE and solution of placebo, all. www.ijpir.com.
(3) Chandran M et al., Int. Journal of Pharmacy & Industrial Research Vol – 02 Issue – 02 Apr – Jun 2012. prepared in mobile phase individually, were injected in to the system and it was observed that DIC and ACE peaks were well separated and there was no interference from placebo (Fig 2). 127. Y ACE= 22.0752X ACE - 228.808 [r2= O.999] Where Y DIC and YACE are response [peak area] for DIC and ACE respectively and X DIC and X ACE. are the concentration of DIC and ACE. respectively.. System suitability. Accuracy. Solution containing both DIC and ACE in the mobile phase was injected and the system suitability parameters were determined. The results are given in Table: 3. Accuracy of developed method was confirmed by doing recovery study at three different concentration levels. 80%, 100% and 120%. each in triplicate. The result of accuracy study. Linearity. is reported in Table.4. Linearity was evaluated from the calibration. Precision. curve data and linear response was observed between 80 to 120 mcg/ml for DIC and 160 to 240 mcg/ml for ACE with a correlation coefficient of 0.996 for DIC and 0.999 for ACE. Regression equations were constructed for both the drug and given below. The tablet formulation was analysed for the content of DICand ACE six times on the same day to determine intra day precision. The results are given in Table: 2 and analysed on three different days to determine inter-day precision. The results are given Table: 5. Y DIC= 53.71X DIC + 82.615 [r2= 0.996]. Figure 01: Overlain Spectra of DIC and ACE. Figure 02: Chromatogram of Placebo. www.ijpir.com.
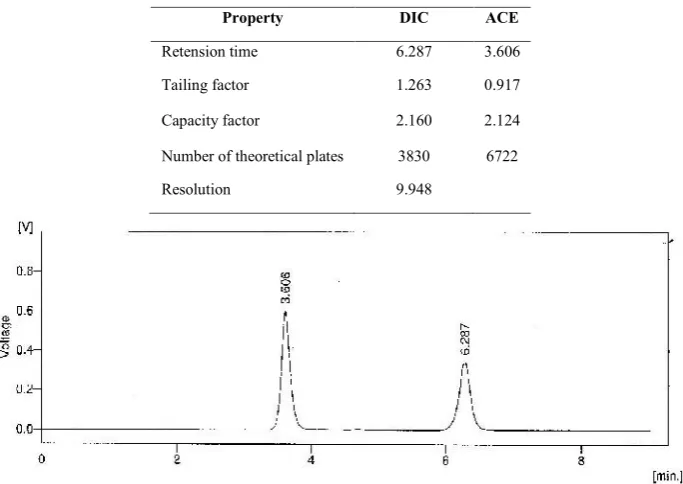
(4) 128. Chandran M et al., Int. Journal of Pharmacy & Industrial Research Vol – 02 Issue – 02 Apr – Jun 2012. Table 01: Analysis of Physical Mixture Theoretical Concentration of (mcg/ml). Experimental values for (mcg/ml). % of theoretical value. DIC. ACE. DIC. ACE. DIC. ACE. 160. 1920. 159.04. 1934.10. 99.40. 100.50. 320. 1600. 316.18. 1570.80. 98.80. 98.27. 480. 1280. 472.00. 1275.21. 98.33. 99.62. 640. 960. 630.28. 967.41. 98.40. 100.70. 800. 640. 794.12. 638.12. 99.26. 99.71. 960. 320. 968.20. 315.90. 100.80. 98.73. Mean. 99.18. 99.56. Standard Deviation. 0.7681. 0.8712. Table 02: Assay of Tablet Formulation % label claim. AMOUNT found (mg). Replicate. DIC. ACE. DIC. ACE. 01. 50.32. 100,41. 100.64. 100.86. 02. 50.26. 99.06. 100.52. 98.93. 03. 49.85. 99.29. 99.70. 98.40. 04. 50.65. 101.30. 101.30. 99.60. 05. 49.29. 98.58. 98.58. 100.40. 06. 50.52. 101.04. 101.04. 100.83. SD. 0’5901. 0.5789. %COV. 0.595. 0.5815. SE. 0.3515. 0.3950. Lable claim: DIC 50mg/tablet and ACE 100mg/tablet.SD: standard deviation, COV: coefficient of variance, SE: standard error. Table 03: System suitability parameters Property. DIC. ACE. Retension time. 6.287. 3.606. Tailing factor. 1.263. 0.917. Capacity factor. 2.160. 2.124. Number of theoretical plates. 3830. 6722. Resolution. 9.948. Figure 03: Chromatogram of DIC and ACE in mixed standard solutions. www.ijpir.com.
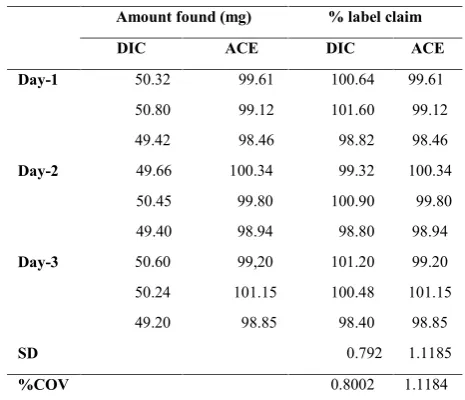
(5) Chandran M et al., Int. Journal of Pharmacy & Industrial Research Vol – 02 Issue – 02 Apr – Jun 2012. Figure 04: Chromatogram of DIC and ACE in sample solution with their retention time. Table 04: Recovery Studies Drug. Amount Added (mg). 80%. 100%. 120%. Amount found. % recovery. DIC. ACE. DIC. ACE. DIC. ACE. 39.123. 79.451. 39.316. 79.021. 100.49. 99.45. 39.594. 80.034. 39.054. 79.512. 98.63. 99.33. 40.256. 79.812. 40.126. 80.042. 99.67. 100.20. 50.854. 99.464. 50.364. 99.360. 99.01. 99.89. 49.694. 99.742. 50.014. 99.442. 100.61. 100.86. 49.952. 99.455. 49.746. 99.211. 99.58. 100.12. 59.918. 119.246. 59.840. 119.960. 99.86. 100.59. 59.105. 120.081. 59.464. 119.246. 100.60. 99.30. 60.515. 120.142. 60.024. 119.061. 99.18. 101.01. Mean. 99.76. 100.09. %COV. 0.6481. . 0.5796. Table 05: Inter Day Precision. Day-1. Day-2. Day-3. Amount found (mg). % label claim. DIC. DIC. ACE. ACE. 50.32. 99.61. 100.64. 99.61. 50.80. 99.12. 101.60. 99.12. 49.42. 98.46. 98.82. 98.46. 49.66. 100.34. 99.32. 100.34. 50.45. 99.80. 100.90. 99.80. 49.40. 98.94. 98.80. 98.94. 50.60. 99,20. 101.20. 99.20. 50.24. 101.15. 100.48. 101.15. 49.20. 98.85. 98.40. 98.85. SD. 0.792. %COV. 0.8002. 1.1185 1.1184. Label claim: DIC 50mg/tablet and ACE 100mg/tablet.SD: standard deviation, COV: coefficient of variance. www.ijpir.com. 129.
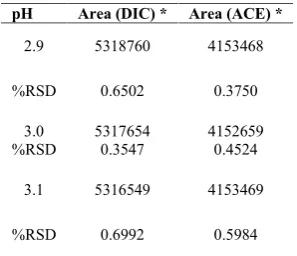
(6) 130. Chandran M et al., Int. Journal of Pharmacy & Industrial Research Vol – 02 Issue – 02 Apr – Jun 2012. Table 06: Robustness for flow rate studies (temperature) Temperature (oC) Area (DIC) * Area(ACE)* 30 5317509 4152287 %RSD 0.4142 0. 4896 25 5316879 4151672 %RSD 0.6927 0.7971 35 5315468 4152329 %RSD 0.9657 0.6058 * mean of three readings. Table 07: Robustness for PH studies pH. Table 08: Robustness for Flow rate Studies. Area (DIC) *. Area (ACE) *. 2.9. 5318760. 4153468. %RSD. 0.6502. 0.3750. 3.0 %RSD. 5317654 0.3547. 4152659 0.4524. %RSD. 0.3451. 0.2435. 2.2. 5317236. 4151683. 3.1. 5316549. 4153469. %RSD. 0.0947. 0.3462. %RSD. 0.6992. 0.5984. Flow rate (ml./mt). Area (TAD) *. Area (DAP) *. 1.8. 5318654. 4153607. %RSD. 0.0854. 0.5624. 2.0. 5318990. 4152697. *mean of three readings.. * mean of three readings. Limit of Detection and Limit of Quantization. The proposed method was estimated in terms of limit of quantification (LOQ) and the lowest concentration. detected. under. the. chromatographic conditions as the limit of detection (LOD). The LOD and LOQ were calculated by the use of the equation LOD =. sample at 25° and 35°C (nominal temperature 30 C ) at flow rates of 1.8 and 2.2 (nominal flow rate 2mL/min ) and pH 2.9 and 3.1 (nominal pH 3.0) and the % RSD of peak area was calculated. The results are reported in (Table 6, 7, 8). 3.3X N/B and LOQ = 10XN/B where N is the. Discussion. standard deviation of the peak areas of the. HPLC method development and optimization. corresponding drug sample, taken as the. Preliminary. measure of the noise, and B is the slope of the. revealed that C18 column gave a better. corresponding calibration plot.. resolution and run time than C8 and hence C18. study. on. column. selection. column was used for further study.. Mobile. The LOD was found to be 0. 490 mcg/ml ,. phase and flow rate selection was based on the. 5.129mcg/ml for DIC and ACE respectively. peak. where as the LOQ was found to be. theoretical. 1.485. parameters plates,. [height, capacity. area,. tailing,. factor. and. mcg/ml, 15.542 mcg/ml for DIC and ACE. resolution] and run time. Good separation. respectively. could be obtained by use of35: 20: 45 [v/v] ratio. of. acetonitrile,. methanol. :. buffer. Robustness. (potassium dihydrogen ortho phosphate. Robustness was established in a triplicate by. 3.0) with 2.0mL/min. UV spectrum of DIC. analyzing system suitability standard and. exhibited absorption maximum at about 258. www.ijpir.com. PH.
(7) Chandran M et al., Int. Journal of Pharmacy & Industrial Research Vol – 02 Issue – 02 Apr – Jun 2012. 131. nm where as ACE exhibited absorption. proposed method is suitable for routine. maximum at about 275nm Considering the. analysis of the tablet formulation containing. absorptivity of. DIC and ACE.. the drugs and their relative. quantity in the formulation , 270 nm was selected as detector wavelength.. From the overlain UV spectra [Shimadzu-1700], suitable wave length considered for monitoring the drugs was 270 nm. [Fig 1] Under the optimized chromatographic conditions the drug peaks are well separated and there was no. Acknowledgement The authors are thankful to Arthi Drugs LTD Puduchery for providing the gift samples of DIC and ACE.. interfering peak from placebo, thus the method. References. has required specificity. The retention time. 1.. Budawari s, The Merck Index; 13th. obtained for DIC and ACE were 6.287 and. edition, Merck and Co. Inc Whitehouse. 3.606, respectively ( Fig 4).. Station. NJ, 2001.. The capacity factor, tailing factor, theoretical. 2.. Martindale;. The. Complete. Drug. plates count and resolution are with in the. Reference; 33 rd Edition, Pharmaceutical. acceptance. Press, London. 2002. criteria. (Table-3).. From. the. physical mixture analysis, the Statistical results were found to be within the range of. 3.. Indian pharmacopeia, 2007, Published by the Controller of Publications, New Delhi. acceptance ie . %COV < 2 .0 and S.D. < 1.0. on behalf of Govt, of India Ministry of. (Table 1).. Health and Family Welfare, Vol iii, page. The mean recovery was 99.76 and 100.09% for DIC and ACE respectively which confirms the accuracy of the method. (Table 4).. 1743. 4.. Giannellini V, Salvatore F, Bartolucci G, Coran SA, Albertis MB,. J. pharm. Small change in the experimental parameters did not did not affect the chromatographic behaviour indicating the robustness of the. Biomed. Anal 2005; 39: 776-80. 5.. Osha A, Rathod.r, padh H,. J. Chromatogr B. 2009. 877: 1145-8.. method .( Table 6,7,8). 6.. Borgmann SH, Parcianello L.M Arend MZ, Cardoso SG, Pharmazie 2007, 62-. Conclusion. 483-5.. A new, reversed –phase HPLC method has been developed for simultaneous analysis of. 7.. by. DIC and ACE in a tablet formulations. It has. UV. spectroscopy. method.. International journal of pharm Tech.. been shown that, the method is, accurate,. Research coden [USA] IJPRIF Dec 2010. precise and specific proving the reliability of. vol z no 4 pp 2313-2318.. the method. The run time is relatively short , i.e, 7 min., which enable rapid determination. Diacerin in pharmaceutical dosage form. 8.. Manzoor A, Manohara YN and Appala. of any samples in routine quality control. Raju S, the Indian Pharmacist 2005, 11;. analysis of tablet formulations... 102-3.. Hence the. www.ijpir.com.
(8) 132. Chandran M et al., Int. Journal of Pharmacy & Industrial Research Vol – 02 Issue – 02 Apr – Jun 2012. 9.. Carolin. Nimila,. P.Balan. S.Rajasekar,. 15. Ritu.V, Kimbahune, NIkunji kumar patel. Pharma Tech vol. 2 no 4 p-2313-2318 oct. Vaibher Desmukhe. Journal pharmacy. 2010.. research vol. 4 no. 6 2011. 10. Raja R K, Sankar GC , Rao A L and. 16. M.V. Bhure, A.K. Hemke and K.R. Gupta.. Sheshagiri R J. Indian drugs 2005, 42 [10]. Journal of pharmaceutical sciences. : 693-695.. research vol.2(7) 2010 p-426-432.. 11. Gharge,. D,. Dhabale,P. Simultaneous. and. 17. R.Sivkumar, N. Srisutherson, W.D Sam. estimation of aceclofenac and paracetamol. Soloman,. International journal of chem. TECH.. R.Venkatanarayanan Pharma Tech vol.2. research 2010;2[2].. no 1 p 940-944 March 2010.. 12. PR. Mahaparale, JN. Sangshelti, B S Kuchekar,. Indian. journal. 18. V.Sekar,. of. P.Kumar. S.. Jayaseelan. Nallasivam. ,. N.Subash,. P.perumal. Chem Tech vol 2. No. 1 pp. pharmaceutical sciences 2007; 69:2. 168-171.. 13. Topale, M.R Gaikwad, N.J, and Tajane M.. 19. S.P. Gandhi, M.G. Dewani T.C Borole. R Indian drugs 2003 40 ;119.. and M.C.Damle IJRPC vol 1(4) 2011.. 14. Manoj Charde, Imran shekh, Avinesh. 20. ICH Q 2 (R1). Validation procedure; Text. kesture Journal of pharmacy research vol. and. 3 no. 6. 2010. conference on Harmonization. Geneva 2003.. www.ijpir.com. Methodology,. International.
(9)
Figure

Related documents
Our aims were to describe the progression rate of neurological manifestations in a new SCA2 cohort, as measured by the ataxia scales SARA, SCAFI, and CCFS, and by a
Key search terms included diabetic foot ulcer, peripheral vascular disease, peripheral neuropathy, infection, osteomyelitis, wound and ulcer care, and amputation.. Unfor tunately,
We investigated the impact of physical fitness, BMI and gender of the provider on the quality of ECC when per- forming CVRs of 15:2 and 30:2. Our main findings are as follows: 1)
The four statements from part B of the instrument (barriers to the application of research in CAM ) that achieved an agreement rating ≥ 70% included “ inconsist- ent research
Conclusions: The findings from this study indicate the importance of “ pushing ” active classroom teachers from the design to the mapping arena by instituting curriculum
Results: There were not significative differences in clinical characteristics between patients that used enoxaparin or fondaparinux as thromboprpophylaxis for SARS
Marie has neither taken an essentialised position that only “Māori work with Māori”, nor that she has an essential right to work with Māori. To work tentatively does not
Chemical composition, olfactory analysis and antibacterial activity of Thymus vulgaris chemotypes geraniol, 4-thujanol/terpinen-4-ol, thymol and linalool cultivated in
