http://www.sciencepublishinggroup.com/j/ijssam doi: 10.11648/j.ijssam.20180302.11
ISSN: 2575-5838 (Print); ISSN: 2575-5803 (Online)
Determines Hyperglycaemia Spreads in Generations with
Multiple Complications That Imposing Towards Death
Sohani Afroja
1, Masudul Islam
1, 2, *, Mohammad Emran Hossen
1, Tapos Kumar Biswas
11Statistics Discipline, Khulna University, Khulna, Bangladesh
2Department of Mathematical Science, Ball State University, Muncie, USA
Email address:
[email protected] (M. Islam)*Corresponding author
To cite this article:
Sohani Afroja, Masudul Islam, Mohammad Emran Hossen, Tapos Kumar Biswas. Determines Hyperglycaemia Spreads in Generations with Multiple Complications That Imposing Towards Death. International Journal of Systems Science and Applied Mathematics.
Vol. 3, No. 2, 2018, pp. 16-23. doi: 10.11648/j.ijssam.20180302.11
Received: May 23, 2018; Accepted: June 14, 2018; Published: July 13, 2018
Abstract:
Diabetes mellitus is one of the fast-growing global problems in the modern era. Khulna Division is not out of that. So, in this paper, it has been tried to recognize the multiple difficulties of hyperglycemia in Khulna, one of the divisions of Bangladesh. Branching process is obtained to determine the probability of ultimate extinction of hyperglycemia in generations. Bivariate and hierarchical multiple logistic regression models are used to examine the association of the determinants and hyperglycemia. Poisson regression is used to look at the number of multiple complications for forthcoming death. The place of resident, marital status, diabetes symptoms: nausea, diabetes symptoms: frequent previous generation and treatment gap are identified most significantly associate with the occurrence of hyperglycemia. Also, nausea person has further chance to attain a hyperglycemia as compared to non-nausea peoples in addition to male patients, if all other factors are constant. Also, the probability of extinction expresses zero for the people with diabetes and the tree diagram exhibits swiftness in the generation to generation. Overall, mortality risk factors among the people with diabetes for numerous worries are estimated by Poisson regression and try to avoid widespread of hyperglycemia in Khulna by diminishing the community health problem of diabetes.Keywords:
Hyperglycemia, Mortality, Branching Process, Polytomous Regression, Multiple Complications1. Introduction
Diabetes mellitus (DM) is a non-communicable chronic disease that requires medical follow-up to reduce the risk of long-term complications and care to stop critical complications. Diabetes care is intricate and requires that numerous issues, beyond glycemic control to be addressed. A huge frame of indication exists that supports a range of involvements to improve diabetes consequences [1]. It is characterized by chronic elevation of blood glucose level above normal value. Current time, it is detected that the number of people having DM increasing so speedily. All of us are at risk of developing diabetes. Hence, everybody must know how this disease demonstrates itself and how everyone can defend ourselves from disease [2]. DM takes a widespread form and its prevalence is increasing at a scary rate [3]. Diabetes mellitus is prejudiced by physiology, genetics and
prevalence of diabetes among adults had increased noticeably, from 4% in 1995 to 2000 and 5% in 2001 to 2005 to 9% in 2006 to 2010 [18]. As stated by the International Diabetes Federation, the prevalence will be 13% by 2030 [19]. The purpose of this study is to explore and account for certain factors which are associated with the increasing prevalence of diabetes according to the World Health Organization (WHO). The study will explore the underlying association between the factors and predict the reasons behind diabetics by appropriate models with higher accuracy. Jacobson (1948) noticed that cancer occurs more frequently than expected among people with diabetes [20]. Forssas et al (2016) observed that a people with diabetes related difficulty (acute myocardial infarction, stroke, lower extremity amputation, and end stage renal disease) aggravate everybody’s to death [21]. Since diabetics increased the risk of having different disease such as stroke, renal disease which provokes towards death [22-23]. Hence, it can be warned everyone about this silent killer through this research.
Hyperglycemia is a trade mark insignia of diabetes (both type-1 and type-2 diabetes) and prediabetes that have an unusually high blood glucose level. The foremost symptoms of hyperglycemia are enlarged dehydration and a recurrent necessity to urinate [24]. Hyperglycemia has been well-defined by the World Health Organization as: blood glucose levels greater than7.0mmol/L (126 mg/dl) when fasting or blood glucose levels greater than 11.0 mmol/L (200 mg/dl) 2 hours after meals [24]. Though blood sugar levels above 7 mmol/L for prolonged stages of time can start to cause harm to internal organs, symptoms may not develop until blood glucose levels over do 11 mmol/L. It may be a solemn problem if not treated in time with symptoms: shortness of breath, nausea and vomiting, and very dry mouth. Some of the complications of hyperglycemia in poorly controlled diabetes are: increase the risk of heart attack, stroke, kidney failure, nerve damage, eye diseases, including damage to the retina, glaucoma, and cataracts and gum disease [24-25]. It scars the heart in patients without a antiquity of heart disease and is strongly linked with heart attacks and death. In this paper, firstly, the significant factor, quantity its contributions to the diabetes and measures the association between factors that affecting the growth of the diabetes are determined. Secondly, analyze the presence of demographic and socio-economic characteristics of diabetes affected patients. Thirdly, demonstrate the use of branching process for getting knowledge about the pictorial scenario of the disease on one generation to next generations. Finally, identify the multiple complications by counting among diabetic people through Poisson regression for predicting mortality.
2. Materials and Methods
2.1. Data and Variables
A hospital based retrospective study of diabetes causes and etiology in Khulna Diabetes Hospital, Khulna was conducted from August 19, 2017 to October 20, 2017. The survey was led
by face to face talk via a standard questionnaire setup. From interview, information was obtained about respondent socio-demographic characteristics, diabetes history, health state descriptions, habitual factor, risk factors and medication. Data has been collected from Khulna Diabetes Hospital by individually interview to 254 diabetes patients. There were about 1200 Patients, a simple random sampling technique was conducted [26] to determined sample size and select 254 Patients.
2.2. Socio-demographics Variables
The interviewers noted the respondent’s femininity as either male or female based on their observation while the respondents stated their age in years, which was then characterized into less than 35 years, 35-45 years, 45-55 years, 55-65 years and 65 plus years’ age brackets. Information on the region of residence (rural/urban) family size (less than 5 members, 5 to 8 members and greater than 8 members) and their marital status (currently married or single) was also grouped. Respondents were also requested to tale their level of education as characterized by illiterate and educated. Body Mass Index (BMI) was calculated based on weight (in kilogram) and height (in squared meters). Respondents were then classified based on BMI as underweight (<18.5 kg/m2), normal (18.5 to 24.9 kg/m2), Obesity (>25 kg/m2). Wealth quintiles were generated based on family income such as less than or equal 10 thousand, 10- 30 thousand, 30 thousand plus. Employment was assessed based on unemployed and employed. Self-reported diabetes or hyperglycemia was assessed based on the questions – “Have you ever been suffering from any of the symptoms such as nausea, frequent urination etc.?”, “Did your previous generation affect form diabetics?” and “Have you ever been treatment gap?”. It can generate the idea about the daily life of the respondent by asking food habit (standard, vegetarian or high fat diet) or exercise (taking or not).
2.3. Methods
respectively. Also, frequency distributions of offspring is premeditated to discover the probability of extinction in the generation and the graphical representation by the tree diagram [27-29], then the mean number of offspring and variance who are suffering from diabetics are observed.
Table 1. Frequency distribution of offspring.
No. of offspring (x) Frequency Probability (p,k)
1 45 .57
2 14 0.18
3 20 0.25
Total 79 1
From the given dataset, mean is 1.68 and is 0.72 respectively. Since, 1 (super-critical), probability of ultimate extinction for diabetes affected offspring can be solved by equations ∑ and get the ultimate probability of extinction is -1.72 or 0 approximately. Since is near to 0. Hence the diabetes may not be extinct in the generations. Graphical representation of the affected 1st and 2nd generations are presenting through the tree diagram. By the graphical representation it can be easily recognize that how rapidly generations are affecting through this non-communicable disease.
Figure 1. Tree diagram of offspring.
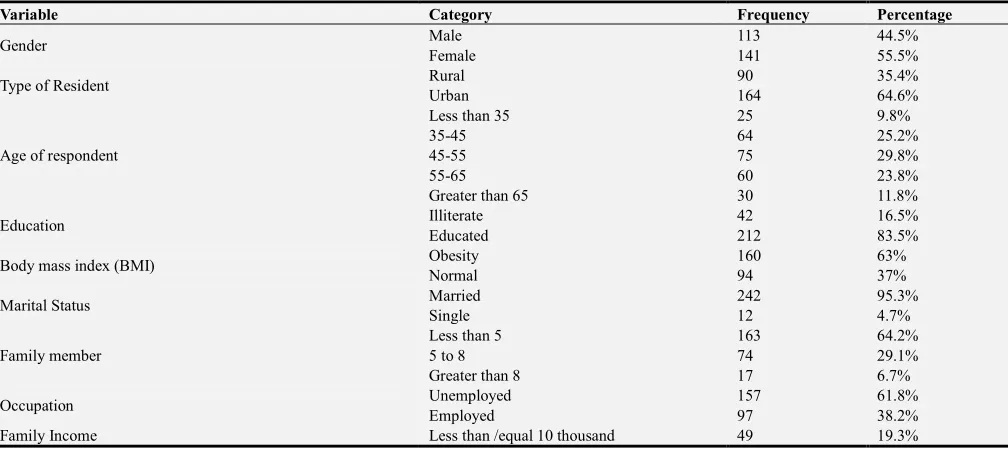
Table 2. Frequency table for the selected variables.
Variable Category Frequency Percentage
Gender Male 113 44.5%
Female 141 55.5%
Type of Resident Rural 90 35.4%
Urban 164 64.6%
Age of respondent
Less than 35 25 9.8%
35-45 64 25.2%
45-55 75 29.8%
55-65 60 23.8%
Greater than 65 30 11.8%
Education Illiterate 42 16.5%
Educated 212 83.5%
Body mass index (BMI) Obesity 160 63%
Normal 94 37%
Marital Status Married 242 95.3%
Single 12 4.7%
Family member
Less than 5 163 64.2%
5 to 8 74 29.1%
Greater than 8 17 6.7%
Occupation Unemployed 157 61.8%
Employed 97 38.2%
Variable Category Frequency Percentage
10- 30 thousand 162 63.8%
Upper than 30 thousand 43 16.9%
Diabetes symptoms: nausea Yes 44 17.3%
No 210 82.7%
Diabetes symptoms: frequent Urination Yes 157 61.8%
No 97 38.2%
Previous Generation affected by diabetics Yes 79 31.1%
No 175 68.9%
Food habit
Vegetarian 37 14.6%
Standard 200 78.7%
High Fat diet 7 2.8%
Lower Class 10 3.9%
Exercise Yes 171 67.3%
No 83 32.7%
Treatment Gap Yes 98 38.6%
No 156 61.4%
Yes 196 77.2%
Hyperglycaemia No 58 22.8%
The relationship between selected explanatory variables and hyperglycemia status has been assessed in bivariate and multivariate system. Recall that the dependent variable hyperglycemia status is measured in nominal scale. In the bivariate system, the association is assessed by comparing percentages of response categories conditional on the nominal explanatory variables.
For testing statistical significance of association in the bivariate system, Chi-squared test of independence for nominal explanatory variable is used. Bivariate analysis results are reported in Table 3. In the case of multivariate analysis, multiple logistic regression and Poisson regression for assessing multiple complications have been used [30-33], given in the Table 4 and Table 5 respectively.
3. Results and Discussion
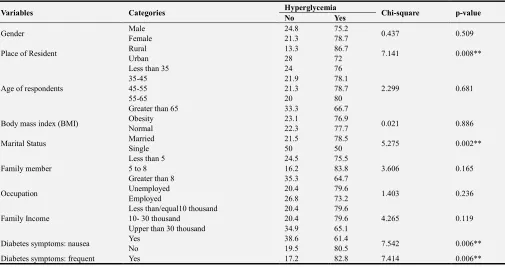
The consequences of variables and hyperglycemia status are exposed in table-3. From the table, it is certain that place of resident, marital status, diabetes symptoms: nausea, diabetes symptoms: frequent urination and treatment Gap have significant monotone relation with hyperglycemia status. In the group of respondents who have food habit with a high-fat diet, has maximum prevalence of hyperglycemia (85.7%). Out of respondents who resided in rural areas 86.7% are hyperglycemic. These figures were 72% for those patients who resided in urban areas, respectively. 83.7% of the respondents are trailing from hyperglycemias that have a gap in treatment. Most of the respondents (82.8%) have the symptoms of frequent urination who are suffering from this disease.
Table 3. Association between particular covariates and hyperglycemia status using chi- square test.
Variables Categories Hyperglycemia Chi-square p-value
No Yes
Gender Male 24.8 75.2 0.437 0.509
Female 21.3 78.7
Place of Resident Rural 13.3 86.7 7.141 0.008**
Urban 28 72
Age of respondents
Less than 35 24 76
2.299 0.681
35-45 21.9 78.1
45-55 21.3 78.7
55-65 20 80
Greater than 65 33.3 66.7
Body mass index (BMI) Obesity 23.1 76.9 0.021 0.886
Normal 22.3 77.7
Marital Status Married 21.5 78.5 5.275 0.002**
Single 50 50
Family member
Less than 5 24.5 75.5
3.606 0.165
5 to 8 16.2 83.8
Greater than 8 35.3 64.7
Occupation Unemployed 20.4 79.6 1.403 0.236
Employed 26.8 73.2
Family Income
Less than/equal10 thousand 20.4 79.6
4.265 0.119
10- 30 thousand 20.4 79.6
Upper than 30 thousand 34.9 65.1
Diabetes symptoms: nausea Yes 38.6 61.4 7.542 0.006**
No 19.5 80.5
Variables Categories Hyperglycemia Chi-square p-value
No Yes
Urination No 32 68
Previous Generation affected by diabetics
Yes 27.8 72.2
1.636 0.201
No 20.6 79.4
Food habit
Vegetarian 35.1 64.9
6.052 0.109
Standard 20 80
High fat diet 14.3 85.7
Lower Class 40 60
Exercise Yes 21.1 78.9 .943 0.331
No 26.5 73.5
Treatment Gap Yes 16.3 83.7 3.836 0.05**
No 26.9 73.1
Education Illiterate 23.8 76.2 0.027
0.027
0.869 0.869
Educated 22.6 77.4
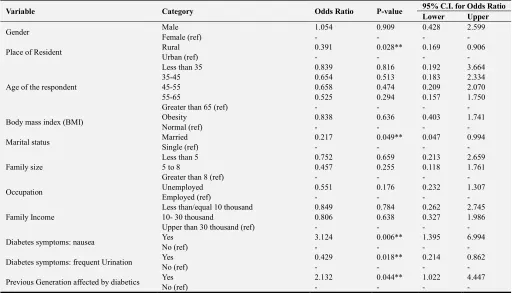
Then multiple logistic regression is applied to adjust for the socio-demographic, socioeconomic, behavioral factors. Odds ratios with p-values of less than 0.05 are considered statistically significant. It is noticed that place of resident, marital status, diabetes symptoms: nausea, diabetes symptoms: frequent urination, previous generation and treatment Gap have significant monotone relation with hyperglycemia status by multiple logistic regression (From the table 4). The odd ratio of 1.054 for gender indicates that probability of having hyperglycemia for male patients are 1.054 times more than female, keeping all other factor constant. The odd ratio of 0.391 for resident indicates that probability of having hyperglycemia for rural patients are 0.609 times less than Urban, keeping all other factor constant. The reference group for Nausea was taken as Non-nausea persons. The odd ratio for Nausea is 3.124, which shows that a Nausea person has 3.124 times more chance of getting a significant
Hyperglycemia as compared to Non-nausea persons keeping all other factors constant. The reference group for Diabetes affected previous generation was taken as Diabetes non-affected previous generation persons. The odd ratio for Diabetes affected previous generation is 2.132, which shows that a Diabetes affected previous generation person has 2.132 times more chance of getting a significant Hyperglycemia as compared to diabetes non-affected previous generation keeping all other factors constant. The odd ratio of 0.521 for exercise indicates that persons who take exercise have 49.4% less chance of getting a Hyperglycemia as compared to the persons who don’t take Exercise, keeping all other factor constant. The odd ratio of 0.435 for treatment gap indicates that persons who have treatment gap 56.5% less chance of getting a significant Hyperglycemia as compared to the persons who get regular treatment, keeping all other factor constant.
Table 4. Prevalence of hyperglycemia status according to variables by multiple logistic regression.
Variable Category Odds Ratio P-value 95% C.I. for Odds Ratio
Lower Upper
Gender Male 1.054 0.909 0.428 2.599
Female (ref) - - - -
Place of Resident Rural 0.391 0.028** 0.169 0.906
Urban (ref) - - - -
Age of the respondent
Less than 35 0.839 0.816 0.192 3.664
35-45 0.654 0.513 0.183 2.334
45-55 0.658 0.474 0.209 2.070
55-65 0.525 0.294 0.157 1.750
Greater than 65 (ref) - - - -
Body mass index (BMI) Obesity 0.838 0.636 0.403 1.741
Normal (ref) - - - -
Marital status Married 0.217 0.049** 0.047 0.994
Single (ref) - - - -
Family size
Less than 5 0.752 0.659 0.213 2.659
5 to 8 0.457 0.255 0.118 1.761
Greater than 8 (ref) - - - -
Occupation Unemployed 0.551 0.176 0.232 1.307
Employed (ref) - - - -
Family Income
Less than/equal 10 thousand 0.849 0.784 0.262 2.745
10- 30 thousand 0.806 0.638 0.327 1.986
Upper than 30 thousand (ref) - - - -
Diabetes symptoms: nausea Yes 3.124 0.006** 1.395 6.994
No (ref) - - - -
Diabetes symptoms: frequent Urination Yes 0.429 0.018** 0.214 0.862
No (ref) - - - -
Previous Generation affected by diabetics Yes 2.132 0.044** 1.022 4.447
Variable Category Odds Ratio P-value 95% C.I. for Odds Ratio
Lower Upper
Food habit
Vegetarian 0.842 0.841 0.157 4.509
Standard 0.296 0.112 0.066 1.327
High fat diet 0.124 0.180 0.006 2.616
Lower class (ref) - - - -
Exercise Yes 0.521 0.083 0.250 1.088
No (ref) - - - -
Treatment gap Yes 0.435 0.033** 0.202 0.937
No (ref) - - - -
Education Illiterate 1.470 0.443 .549 3.932
Educated (ref) - - - -
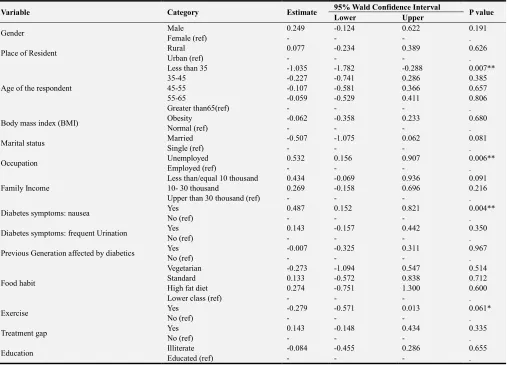
Table 5. Prevalence of number of complications for hyperglycemia by Poisson regression model.
Variable Category Estimate 95% Wald Confidence Interval P value
Lower Upper
Gender Male 0.249 -0.124 0.622 0.191
Female (ref) - - - .
Place of Resident Rural 0.077 -0.234 0.389 0.626
Urban (ref) - - - .
Age of the respondent
Less than 35 -1.035 -1.782 -0.288 0.007**
35-45 -0.227 -0.741 0.286 0.385
45-55 -0.107 -0.581 0.366 0.657
55-65 -0.059 -0.529 0.411 0.806
Greater than65(ref) - - - .
Body mass index (BMI) Obesity -0.062 -0.358 0.233 0.680
Normal (ref) - - - .
Marital status Married -0.507 -1.075 0.062 0.081
Single (ref) - - - .
Occupation Unemployed 0.532 0.156 0.907 0.006**
Employed (ref) - - - .
Family Income
Less than/equal 10 thousand 0.434 -0.069 0.936 0.091
10- 30 thousand 0.269 -0.158 0.696 0.216
Upper than 30 thousand (ref) - - - .
Diabetes symptoms: nausea Yes 0.487 0.152 0.821 0.004**
No (ref) - - - .
Diabetes symptoms: frequent Urination Yes 0.143 -0.157 0.442 0.350
No (ref) - - - .
Previous Generation affected by diabetics Yes -0.007 -0.325 0.311 0.967
No (ref) - - - .
Food habit
Vegetarian -0.273 -1.094 0.547 0.514
Standard 0.133 -0.572 0.838 0.712
High fat diet 0.274 -0.751 1.300 0.600
Lower class (ref) - - - .
Exercise Yes -0.279 -0.571 0.013 0.061*
No (ref) - - - .
Treatment gap Yes 0.143 -0.148 0.434 0.335
No (ref) - - - .
Education Illiterate -0.084 -0.455 0.286 0.655
Educated (ref) - - - .
From table 5, it is clear from the estimated Poisson regression coefficient of age of the respondent, occupation, diabetes symptoms: nausea, and exercise have significant monotone relation with number of complication. Considering, other variables constant in this model, the difference in the logs of expected complications is expected to be 0.249 unit advanced for males compared to females, So, two patients are considered here, one male and one female, with identical occupation, nausea, exercise, treatment gap and food habit etc., the male patients will have a progressive predicted value number of complications than the female patients. For comparing age group of with 65+ year’s patients, it has been observed that the expected number of complications is
4. Conclusion
In this paper, the significant factors of the growth in hyperglycemia incidence are identified. For this data, the place of resident, marital status, diabetes symptoms: nausea, diabetes symptoms: frequent previous generation and treatment gap are found significantly associate with the occurrence of hyperglycemia by multiple logistic regression. Moreover, it has been observed that, if all other factors constant, nausea person has more chance of getting a significant impact on hyperglycemia as compared to non-nausea persons as well as male patients has a high risk of getting Hyperglycemia then female patients. Also, the probability of extinction shows zero for the diabetic patients and the tree diagram exhibit that diabetic is spreading swiftly in generation to generation. The Poisson regression is usage to predict mortality risk factors among the diabetic patients for multiple complications and try to prevent hyperglycemia epidemic in the population to reduce the public health burden of diabetes.
References
[1] Chowdhury MA, Uddin MJ, Khan HM, Haque MR. Type 2 diabetes and its correlates among adults in Bangladesh: a population-based study. BMC Public Health. 2015 Dec;15(1):1070. DOI: doi.org/10.1186/s12889-015-2413-y
[2] American Diabetes Association. Standards of medical care in diabetes—2015 abridged for primary care providers. Clinical diabetes: a publication of the American Diabetes Association. 2015 Apr;33(2):97. DOI:doi.org/10.2337/diaclin.33.2.97
[3] Wefuan FK. The escalating diabetes epidemic: determinants of prevalence disparity between country income groups (master’s thesis (published), University of Tromsø, Norway), 2013.
[4] Dinca-Panaitescu S, Dinca-Panaitescu M, Bryant T, Daiski I, Pilkington B, Raphael D. Diabetes prevalence and income: results of the Canadian Community Health Survey. Health policy. 2011 Feb 1; 99(2):116-23. DOI: 10.1016/j.healthpol.2010.07.018.
[5] Hruby A, Hu FB. The epidemiology of obesity: a big picture. Pharmacoeconomics. 2015 Jul 1; 33(7):673-89. DOI:10.1007/s40273-014-0243-x
[6] Aljefree N, Ahmed F. Association between dietary pattern and risk of cardiovascular disease among adults in the Middle East and North Africa region: a systematic review. Food & nutrition research. 2015 Jan 1;59(1): 27486. DOI: 10.3402/fnr.v59.27486
[7] Gutiérrez-Pliego LE, del Socorro Camarillo-Romero E, Montenegro-Morales LP, de Jesus Garduño-García J. Dietary patterns associated with body mass index (BMI) and lifestyle in Mexican adolescents. BMC public health. 2016 Dec;16(1): 850. DOI: 10.1186/s12889-016-3527-6.
[8] Ahmad Z, Pervaiz MK. Risk factors and diabetes mellitus (statistical study of adults in Lahore, Pakistan). Journal of Statistics. 2006; 13(1):46-66. ISSN 1684 – 8403.
[9] Chowdhury MA, Uddin MJ, Khan HM, Haque MR. Type 2 diabetes and its correlates among adults in Bangladesh: a
population-based study. BMC Public Health. 2015 Dec; 15(1):1070. DOI: 10.1186/s12889-015-2413-y.
[10] Wild SH, Byrne CD. Risk factors for diabetes and coronary heart disease. Bmj. 2006 Nov 9; 333(7576):1009-11. DOI:10.1136/bmj.39024.568738.43.
[11] Mozaffarian D. Dietary and policy priorities for cardiovascular disease, diabetes, and obesity: acomprehensive review. Circulation. 2016 Jan 12; 133(2): 187225. DOI: doi.org/10.1161/CIRCULATIONAHA.115.018585
[12] Joseph J, Svartberg J, Njølstad I, Schirmer H. Incidence of and risk factors for type-2 diabetes in a general population: the Tromsø Study. Scandinavian journal of public health. 2010 Nov;38(7): 768-75. DOI: 10.1177/1403494810380299
[13] Kautzky-Willer A, Harreiter J, Pacini G. Sex and gender differences in risk, pathophysiology and complications of type 2 diabetes mellitus. Endocrine reviews. 2016 May 9;37(3):278-316. DOI: doi.org/10.1210/er.2015-1137.
[14] Darnton-Hill I, Nishida C, James WP. A life course approach to diet, nutrition and the prevention of chronic diseases. Public health nutrition. 2004 Feb; 7(1a):101-21. DOI: 10.1079/PHN2003584.
[15] Sicree R, Shaw J. Type 2 diabetes: An epidemic or not, and why it is happening. Diabetes & Metabolic Syndrome: Clinical Research & Reviews. 2007 Jun 1;1(2):75-81. ISSN 1011 5528.
[16] Rahim MA. Diabetes in Bangladesh: Prevalence and determinants (master’s thesis-published, University of Oslo, Norway), 2002.
[17] Bangladesh population and housing census (2011). Dhaka: Bangladesh Bureau of Statistics, Government of the People’s Republic of Bangladesh; 2012.
[18] Saquib N, Saquib J, Ahmed T, Khanam MA, Cullen MR. Cardiovascular diseases and type 2 diabetes in Bangladesh: a systematic review and meta-analysis of studies between 1995 and 2010. BMC public health. 2012 Dec;12(1):434. DOI:doi.org/10.1186/1471-2458-12-434
[19] Yokota F, Ahmed A, Islam R, Nishikitani M, Kikuchi K, Nohara Y, Okajima H, Kitaoka H, Nakashima N. The Relationships and Risk Factors Associated with Hypertension, Diabetes, and Proteinuria among Adults from Bheramara Upazila, Bangladesh: Findings from Portable Health Clinic Data, 2013-2016. International Journal of Medical Research & Health Sciences, 2018 J;7(2):1-12. ISSN No: 2319-5886
[20] Jacobson PH. A statistical study of cancer among diabetics. The Milbank Memorial Fund Quarterly. 1948 Jan 1;26(1):90-118. DOI:10.2307/3348157
[21] Forssas E, Arffman M, Manderbacka K, Keskimäki I, Ruuth I, Sund R. Multiple complications among people with diabetes from Finland: an 18-year follow-up in 1994–2011. BMJ Open Diabetes Research and Care. 2016 Oct; 4(1): 000254. DOI: 10.1136/bmjdrc-2016-000254
[22] Umpierrez GE, Isaacs SD, Bazargan N, You X, Thaler LM, Kitabchi AE. Hyperglycemia: an independent marker of in-hospital mortality in patients with undiagnosed diabetes. The Journal of Clinical Endocrinology & Metabolism. 2002 Mar 1;87(3):978-82. DOI:0013-7227/02/$15.00/0
[23] Poisson regression.
[24] Hyperglycamia.
https://www.medicinenet.com/hyperglycemia/article.htm.
[25] Imtiaz KS, Chowdhury M, Nazneen H, Begum N, Tamanna N, Alam F, Akter J. Knowledge Regarding Diabetes Mellitus among Rural People in a Selected Area of Bangladesh.
Northern International Medical College Journal. 2016 Sep 19;7(2):131-4. DOI: 10.1186/s12889-017-4285-9
[26] Islam MN. An introduction to sampling methods: theory and applications. 3rd ed. Mullick & Brothers; 2014.
[27] Bhat UN. Elements of applied stochastic processes. 2nd ed. New York: Wiley; 1981.
[28] Branching process.
https://en.wikipedia.org/wiki/Branching_process.
[29] Hossain MM. and Rios R. An application of branching process in multi-level marketing (MLM). Lap Lambert Academic publications; 2013. DOI: ISBN: 978-3-659-44547-7.
[30] Logistic regression.
https://en.wikipedia.org/wiki/Logistic_regression.
[31] Montgomery DC. and Peek E. An introduction to regression analysis. 3rd ed. New York: John Wiley and Sons; 2004.
[32] Gujarati DN., Porter DC. and Gunasekar S. Basic econometrics. 5th ed. New York: McGraw; 2015.