INTRODUCTION
The alkaline earth metal soaps are of great significance of their uses in various industries under different conditions. The soaps are widely used in industries as antibacterials1, dryers, fungicides, stabilizers2-4, cosmetic5, binding insulators, adhesives and to improve the heat resistance and binding capacity6-7. The methods of preparation and physico chemical properties provide the basis of the selection of metal soap for industrial use. The methods of preparation metal soap were described by several workers8-15. The Infra-red spectra, X-ray diffraction and thermal analysis of Magnesium soaps were investigated by Chitra et al.16. The thermodynamics of dissociation of Calcium and Lithium soaps were investigated by Updhyaya17 and Verma et al.18. The ultrasonic velocity measurements of Lithium soaps were made by Upadhaya19 and the ultrasonic, conductivity and viscosity measurements of Strontium and Barium soaps were made by Rawat et al.20,21. From the literature it has been revealed that Berrylium soap has not been thoroughly investigated in splite of the large number of application of alkaline earth metal soaps in
Materials Science Research india Vol. 4(1), 187-194 (2007)
industry. The present work includes molar volume, viscosity and conductivity measurements of beryllium soaps to study the micelles properties in pure benzene.
EXPERIMENTAL Preparation of soap
The soaps of beryllium (Caprate, Laurate and Myristate) were prepared by direct metathesis of corresponding potassium soaps with the required amount of aqueous solution of beryllium sulphate at 50-55°C under vigorous stirring. The precipitated soaps were washed several times with of distilled water and acetone to remove the excess of fatty acid and metal sulphate. The soaps were purified by recrystallisation, dried in an air over at 50-60°C and the final drying of the soaps were carried out under reduced pressure. The absences of hydoxyl group in the soaps were confirmed by studying its Infrared absorption spectrum. The basis of making the solution of these soaps is the maximum solubility in polar and non-polar organic solvents. The best solubility of Beryllium soaps in pure Benzene.
Studies on miceller properties on the soaps of beryllium
M.K. RAWAT, YADVENDRA SHARMA and SHILPI KUMARI
Department of Chemistry, Agra College, Agra (India)
(Received: January 19, 2007; Accepted: March 08, 2007)
ABSTRACT
The conductance of the solution of beryllium soaps has been measured at 30°C + 0.05°C in pure benzene with a view to determined the critical miceller concentration (CMC), molar conductance at infinite dilution. The results show that the specific conductance of the solutions of a soap increases whereas the molar conductance decreases with the increase in the soap concentration but increases with increasing chain length of the soap. The value of CMC decreases with the increase in the chain length of soap. The viscosity measurements confirm that the soap molecules does not aggregate appreciably below the CMC and the results has been interpreted in terms of Einstein, Vand, Moulik, and Jones-Dole equations. The values of molar volume are in agreement.
Conductivity
The conductivity of the solution was measured by using a “TOSHNIWAL DIGITTAL CONDUCTIVITY METER” (Model CL 01, 10A) and a dipping type conductivity cell with platinized electrodes at a constant temperature, 30±0.05°C.
Viscosity
An Oswald’s type viscometer was used for measuring the viscosity of the soap solutions. The viscosities of the soap solutions were calculated by using relationship.
where η1, η2, ρ1, ρ2 and t1, t2 are the viscosity, density and time of flow of solvent and solution, respectively, All measurements were made at a constant temperature 30±0.05°C in a thermostat.
RESULTS AND DISCUSSION Conductivity
The specific conductance, k of the solution of Beryllium soaps (Caprate, Laurate, Myristate) in pure Benzene increases with the increase in soaps concentration, C (Table-1). The increase in specific conductance with the increase in soaps concentration may be due to the ionization by Beryllium soaps into a simple as metal cation M2+ and fatty acids anions RCOO- (Where M is Beryllium and R is C9 H19, C11 H 23 and C13 H27 for caprate. Laurate and Myristate, respectively) in solutions and also due to the formation of micelles at higher soap concentration. The plots of specific conductance vs the soap concentration (Fig.1) are characterized by an intersection of two straight lines at a definite soap concentration, which corresponds to the CMC, indicating the formation of ionic micelles at this soap concentration. The value fo CMC for Beryllium soaps are recorded in (Table-2). The results show that the CMC decreases with increasing chain-length of soap molecules.
solution of Beryllium soaps (Caprate, Laurate, Myristate) in pure Benzene decreases with the increasing soaps concentration, (Table-1). The decrease in molar conductance with the increase in soaps concentration may be due to the combine effects of ionic atmosphere, salvation of ions, decrease of mobility and ionization with the for mation of micelles. The plot of molar conductance, µ against the square root of the soap concentration, is not linear which indicates that the soap behave as simple electrolyte in these solution. The molar conductance, µ cannot be obtained by the usual extrapolation method, as the Debye Huckel equation is not applicable to these soap solution.
Assuming that the soap are completely dissociated into M2+ and RCOO ions. The dissociation of metal soaps my be represented as: (RCOO)2M = M2+ + 2RCOO- ...(1) C (1 – α) = Cα 2(Cα)
where M stand for Beryllium R is C9H19, C11H25 and C13H27 for caprate. Laurate and Myristate, respectively, α and C are the degree of dissociation and concentration of soap respectively. The dissociation constant, K can be written as:
...(2)
=
...(3)T
able-1: Conductivity Measurement
s of Beryllium Soap
s in pure Benzene at 30°C ± 0.05°C
Beryllium Caprate Beryllium Laurate Beryllium Myrist ate S . Conductance Specific M o la r Specific Molar Specific Molar N o .
C × 10
3 Conductance Conductance Conductance Conductance Conductance Conductance (mol/L) K × 1 0 6 µMhos cm
2 mol
-1
K × 10
6
µ mhos cm
2 mol
-1
K × 10
6
µmhos cm
2 mol
-1 mhos cm -1 mhos cm -1 mhos cm -1 1 . 20.0 22.5 1.1250 23.4 1.1700 24.4 1.2200 2 . 18.1 21.6 1.1934 22.0 1.2155 23.3 1.2873 3 . 16.6 20.0 1.2048 21.9 1.2831 22.0 1.3253 4 . 15.3 19.1 1.2484 20.4 1.3333 21.1 1.3791 5 . 14.2 18.6 1.3099 19.2 1.3521 20.7 1.4577 6 . 13.3 17.8 1. 3383 18.6 1.3985 19.8 1.4887 7 . 12.5 17.0 1.3600 18.0 1.4400 19.3 1.5440 8 . 11.7 16.4 1.4017 17.4 1.4872 18.7 1.5983 9 . 11.1 16.0 1.4414 17.0 1.5315 18.3 1.6486 10. 10.5 15.5 1.4762 16.8 1.6000 18.0 1.7143 11. 10.0 15.2 1.5200 16.2 1.6200 17.5 1.7500 12. 9.5 14.8 1.5579 15.8 1.6632 17.2 1.8105 13. 9.1 14.3 1.5714 15.3 1.6813 16.8 1.8462 14. 8.6 14.0 1.6279 14.9 1.7320 16.5 1.9186 15. 8.3 13.7 1.6506 14.5 1.7469 16.0 1.9177 16. 8.0 13.3 1.6625 14.1 1.7625 15.7 1.9625 17. 7.6 12.7 1.6711 13.6 1.7895 15.2 2.0000 18. 7.1 12.3 1.7324 13.3 1.8732 14.7 2.0704 19. 6.8 11.9 1.7500 12.8 1.8824 14.3 2.1029 20. 6.6 11.7 1.7727 12.5 1.1839 13.9 2.1061
Beryllium Soaps at 30±0.05°C Metal Soap CMC (Mol 1-1) µ
0 -log K Beryllium Caprate 9.8 0× 10-3 4.5 2.96 Beryllium Laurate 9.5× 10⁻³ 5.0 3.09 Beryllium Myristate 9.1× 10⁻³ 5.8 3.11
On substituting the values of
α
in equation (3) and rearranging we obtains:...(4)
The plots µ2 C2 vs 1/µ of are plotted and the intercept
and slope are equal to and respectively. The value of the dissociation constant, K and limiting molar conductance, μ0 for dilute solutions below the CMC have been calculated from the slope and intercept of these plot of μ2 C2 vs 1/µ. The value of the limiting molar conductance, µ0 and dissociation constant, K are depicted in (Table-2). The conductivity results confirm that the soaps behave, as a simple electrolyte in these solution and Debye Huckel equation is not applicable to these solutions.
Viscosity
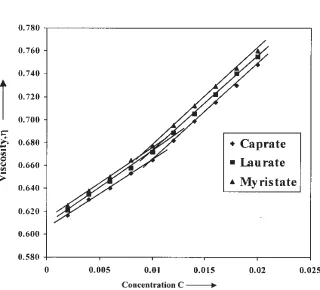
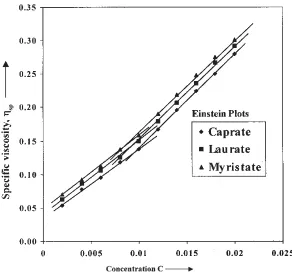
The viscosity, η and specific viscosity, ηsp of the e solution of Beryllium soaps (Caprate. Laurate and Myristate) in pure Benzene increases with increasing soap concentration (Table-3). The increase in the viscosity may be due to the increasing tendency of the soap molecule to form aggregates with the increase in the soap concentration. The plot of η vs soap concentration, C (Fig. -2) and ηsp vs soap concentration (Fig. 3) are characterized by an intersection of two straight lines at a definite soap concentration, which corresponds to the CMC of the soaps are 0.0099 mol/L, 0.0095 mol/L, 0.0091 mol/L for Caprate.
viscosity ηvs. C below the CMC has been extrapolated to zero soap concentration. The extrapolated value (Table- 4). The viscosity results confirm that there is no appreciable aggregation of the soap molecules below the CMC where as there is a sudden increase in the aggregation at this soap concentration.
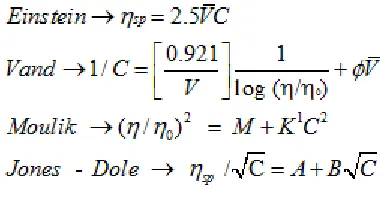
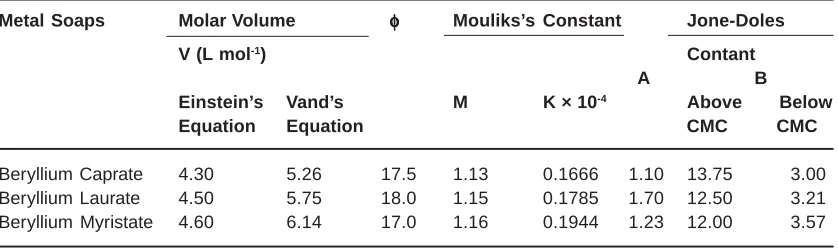
The viscosity results have been interpreted in the light of equations proposed by Einstein22, Vand23, Moulik24 and Jones-Dole25.
where, V, C, φ , η, η0 and ηsp are the molar volume, concentration of he soap (mol 1-1), interaction coefficient, viscosity of the solution, viscosity of the solvent and specific viscosity respectively. M and K are Moulik’s constants and A and B are the Jones-Doles constants.
The plots ηsp vs. C (fig-2) are linear below the CMC with the intercept almost equal to zero, which show shat Einstein’s equation is applicable to these soap solutions. The values of molar volume of soaps, V calculated from the slope of the Einstein’s plot. (Table -5). The plot of 1/C v 1/log (η/η0) are linear below the CMC which shows that Vand’s equations is applicable to these solution of Beryllium soaps in pure Benzene. The values of interaction coefficient, φ and molar volume obtained from the intercept and slope of the plots of 1/C vs. 1/log (η/η0) are recorded in (Table -5). The values are inclose agreement with the values obtained from Einstein’s equation.
Rawat et al., Mat. Sci. Res. Ind., Vol. 4(1), 187-194 (2007) 191
Fig. - 1: Specific concentration vs concentration
Fig. - 3: Specific viscosity vs concentration
slope of the plots of (η/η0)2 Vs C2 are recorded in (Table -5).
The viscosity data have also been explained in the light of Jones-Dole’s equation. The plot of ηsp/
C
vs is character ized by an intersection of two straight lines at a definite soap concentration. The values of the constant A and B calculated from the intercept and slope of plots of
ηsp/ vs
C
are recorded in (Table -5). The small value of A (soap-soap interaction), compared withB (soap-solvent interaction) confirm that there is no appreciable aggregation of the soap molecules in dilute solution below the CMC. This may be attributed to the fact that the aggregation of soap molecules above the CMC boosts up the electro-kinetic forces causing more intake of one solvent resulting in the increased viscosity of the system.
Table -4: Value of ηηηηη0 and ηηηηηosp of Soaps obtained from the plots of ηηηηη vs. C and ηηηηηsp vs C.
S. Metal Caprate Laurate Myristate
No. ηηηηη0 ηηηηηosp ηηηηη0 ηηηηηosp ηηηηη0 ηηηηηosp
1. Beryllium 0.604 0.034 0.609 0.040 0.613 0.046
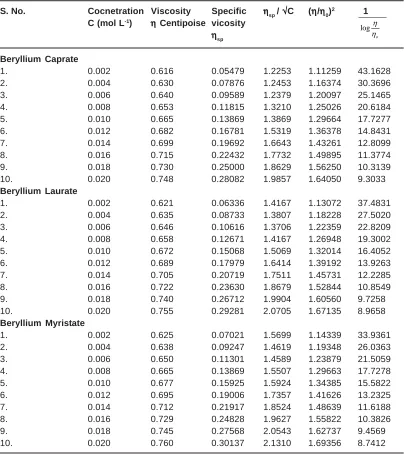
Table -3: Viscosity parameters of Beryllium soaps (Caprate, Laurate and Myristate) in pure Benzene at 30 ± 0.05°C
S. No. Cocnetration Viscosity Specific ηηηηηsp / √√√√√C (ηηηηη/ηηηηη0)2 1 C (mol L-1) η η η η η Centipoise vicosity
ηηηηηsp
Beryllium Caprate
1. 0.002 0.616 0.05479 1.2253 1.11259 43.1628
2. 0.004 0.630 0.07876 1.2453 1.16374 30.3696
3. 0.006 0.640 0.09589 1.2379 1.20097 25.1465
4. 0.008 0.653 0.11815 1.3210 1.25026 20.6184
5. 0.010 0.665 0.13869 1.3869 1.29664 17.7277
6. 0.012 0.682 0.16781 1.5319 1.36378 14.8431
7. 0.014 0.699 0.19692 1.6643 1.43261 12.8099
8. 0.016 0.715 0.22432 1.7732 1.49895 11.3774
9. 0.018 0.730 0.25000 1.8629 1.56250 10.3139
10. 0.020 0.748 0.28082 1.9857 1.64050 9.3033
Beryllium Laurate
1. 0.002 0.621 0.06336 1.4167 1.13072 37.4831
2. 0.004 0.635 0.08733 1.3807 1.18228 27.5020
3. 0.006 0.646 0.10616 1.3706 1.22359 22.8209
4. 0.008 0.658 0.12671 1.4167 1.26948 19.3002
5. 0.010 0.672 0.15068 1.5069 1.32014 16.4052
6. 0.012 0.689 0.17979 1.6414 1.39192 13.9263
7. 0.014 0.705 0.20719 1.7511 1.45731 12.2285
8. 0.016 0.722 0.23630 1.8679 1.52844 10.8549
9. 0.018 0.740 0.26712 1.9904 1.60560 9.7258
10. 0.020 0.755 0.29281 2.0705 1.67135 8.9658
Beryllium Myristate
1. 0.002 0.625 0.07021 1.5699 1.14339 33.9361
2. 0.004 0.638 0.09247 1.4619 1.19348 26.0363
3. 0.006 0.650 0.11301 1.4589 1.23879 21.5059
4. 0.008 0.665 0.13869 1.5507 1.29663 17.7278
5. 0.010 0.677 0.15925 1.5924 1.34385 15.5822
6. 0.012 0.695 0.19006 1.7357 1.41626 13.2325
7. 0.014 0.712 0.21917 1.8524 1.48639 11.6188
8. 0.016 0.729 0.24828 1.9627 1.55822 10.3826
9. 0.018 0.745 0.27568 2.0543 1.62737 9.4569
10. 0.020 0.760 0.30137 2.1310 1.69356 8.7412
log o
η η
1. A. Lamkanra and A.A. Adebiye, Microbios Lett., 15-21 (1981).
2. G.A. Baum and R.K. Hulyalkar., Ger. Offen. 3, 019,911, Dec 11, 1980 U.S. Appl. 45, 552 05 Jun (1979).
3. A. Michel and Tran Van Hoang, Pure. Appl.
Chem., 53(2), 567-76 (1981).
4. M. Chrochemore and M. Gay, Demand 2, 456, 132 (C1. C 08L 27/06) Dec. 05. 1980. Appl. 79/12527 May 10 (1979).
5. M.G. Flom., U.S.A 4, 278, 570, July, 14. 1981 Appl. 179 628 Aug. 20 (1980).
6. A.S.Alam and D.Gregoriaeds. J. Pharm. Sci., 70(8) 961-2, (1981).
7. K.K. Denki Kagaku Kogyo, Kakai Tokkyo Koho 81, 20, 046, Feb. 25, (1981). Appl. 79-95, 703 July 27 (1979).
8. Matsumoto, Noricika. Jpn. Kokai Tokkyo Koho Jp (2000). 38,198, (C1, C11 D13/02) 6 Feb (2002) April 2000/222, 603 24 July (2000). 9. Matsumoto, Noricika. Jpn. Kokai Tokkyo Koho
Jp (2000). 317,199, (C1, C11 D13/00) 31 Oct (2002) April 2001/222, 673 20 April (2001).
10. Kahashima Nobyyoshi, Sakai, Takayaki, Imamura Toshihiro Jpn.. Kokai Tokkyo Koho, Jp. 11, 100, 599 (99 100,595) (C1 C11 D 13/00) 13 April (1999) Appl 97 (263.971 ) 7pp, 29 Sep. (1997).
11. Kahashima Nobyyoshi, Sakai, Takayaki, Imamura Toshihiro Jpn.. Kokai Tokkyo Koho,
Metal Soaps Molar Volume φφφφφ Mouliks’s Constant Jone-Doles
V (L mol-1) Contant
A B
Einstein’s Vand’s M K × 10-4 Above Below
Equation Equation CMC CMC
Beryllium Caprate 4.30 5.26 17.5 1.13 0.1666 1.10 13.75 3.00 Beryllium Laurate 4.50 5.75 18.0 1.15 0.1785 1.70 12.50 3.21 Beryllium Myristate 4.60 6.14 17.0 1.16 0.1944 1.23 12.00 3.57
REFERENCES
Jp. 11, 100, 599 (99 100,595) (C1 C11 D 9/ 26) 20 April (1999) Appl 97/265.931 7pp, 30 Sep. (1997).
12. Soheb E. Zien, M. Sayed Hammad and A.A. Yousef, Grases Aceiteis (Sevilla) 50(6), 426-434 (1999).
13. M.J. Baillie, D.N.Brown, K.C.Moss and D.W.A Sharp., J. Chem. Soc., (A) 3110, (1968). 14. J. Chowdowska, Palicka and M.Nilsson, Acta.
Chem. Scand. 25, 3353 (1970).
15. W.U. Malik and S.I. Ahmad, Kolloid Z.Z. Polysms 234(1), 1045-8 (1989).
16. Chitra Singh and S.K. Upadhyaya, Asian. J.
Chem. 13(3), 977-982 (2001).
17. S.K.Upadhyaya, Indian. J. Chem. Sec. “A” 36(12), 1054-1057 (1997).
18. R.P.Verma and H.C.Goel, Tenside Surft. Deterg. 38(3), 183 (2001).
19. S.K.Upadhyaya, Indian. J. Chem. Sec. “A” 39A(5), 537-540 (2000).
20. M.K. Rawat and Sangeeta, J. Chemtraks, 7(1 & 2), 39-46 (2005).
21. M.K. Rawat, K. Amit Agarwal and Sangeeta., J. Ind. Council.Chem., 23(1), 14-22 (2006). 22. A. Einstein. Ann. Phys. 19(1906), 289,34 581
(1911).
23. V.Vand. J. Phys. Colloid Chem, 52, 277 (1948)
24. S.P. Moulik. J. Phys. Chem. 72, 4682 (1968). 25. G. Jones and M. Dole, J. Am. Chem. Soc.