http://www.sciencepublishinggroup.com/j/ijfmts doi: 10.11648/j.ijfmts.20190501.13
ISSN: 2469-8105 (Print); ISSN: 2469-8113 (Online)
Characterization of Surface Water Components in Northern
Sudan Using Raman Spectroscopy
Sufyan Sharafedin Mohammed
1, Abdelmoneim Mohammed Awadelgied
2, Sohad Saad El Wakeel
1,
Ahmed Abubaker Mohamed
11Department of Physics, Sudan University of Science and Technology, Institute of Laser, Khartoum, Sudan
2
Department of Engineering, Karary University, Khartoum, Sudan
Email address:
To cite this article:
Sufyan Sharafedin Mohammed, Abdelmoneim Mohammed Awadelgied, Sohad Saad El Wakeel, Ahmed Abubaker Mohamed.
Characterization of Surface Water Components in Northern Sudan Using Raman Spectroscopy. International Journal of Fluid Mechanics & Thermal Sciences. Vol. 5, No. 1, 2019, pp. 28-35. doi: 10.11648/j.ijfmts.20190501.13
Received: March 31, 2019; Accepted: May 5, 2019; Published: May 31, 2019
Abstract:
Most population in northern Sudan are supplied by surface water sources directly from the Nile for drinking and irrigation purposes. As noted, most of them suffer from chronic diseases such as cancer and kidney failure. Water is expected to be a major and direct cause of these diseases, so the aim of this study is to identify the components of surface water in northern Sudan using Raman spectroscopy. Surface water Samples were collected from the Nile in different regions. The samples were analyzed at room temperature using Raman spectrometer model Horiba Lab RAM HR D3. The results showed that the samples contain different materials, beside the water, with different amounts; like: aromatic molecules, ester, salts, amides, phenol, alkynes and acids. From the results we have found that the water contains many toxic compounds such as cyanide, nitrate and phenol, which is one of the most important causes of cancer and renal failure. As well as can cause oxidize the iron atoms in hemoglobin from ferrous iron (II) to ferric iron (III), rendering it unable to carry oxygen. This process can lead to generalized lack of oxygen in organ tissue and a dangerous condition called methemoglobinemia.Keywords:
Raman Spectroscopy, Surface Water Characterization, Surface Water in Northern Sudan1. Introduction
Water is essential to life. It is part of the physiological process of nutrition and waste removal from cells of all living things. It is one of the controlling factors for biodiversity and the distribution of Earth’s varied ecosystems, communities of animals, plants, and bacteria and their interrelated physical and chemical environments. In terrestrial ecosystems, organisms have adapted to large variations in water availability.[1]
Water is a renewable resource. However, it is not always available when or where it is needed, and it may not be of suitable quality for intended uses. Although we commonly take for granted that clean and abundant water is as close as the nearest faucet, water resources can be depleted or contaminated with pollutants. Having too much water (floods) or not having enough (droughts) may have serious
consequences for people, wildlife, and their habitats. Providing sufficient quantities of good quality water is a major factor in creating the life style we enjoy in Sudan.
Surface water is the term used to describe water on the land surface. The water may be flowing, as in streams and rivers, or quiescent, as in lakes, reservoirs, and ponds. Surface water is produced by runoff of precipitation and natural groundwater seepage.[2]
A study was conducted in 2016 to identify the components of water wells in the western region of Saudi Arabia by Raman spectroscopy. The results showed that the samples contain different materials, with different amounts; like: acids, salts, amides, phenol, ester and sulfonamide.
Also another study in 2014 by Raman sensor to analysis of chemical substances dissolved in water. The identification of chemical pollutants and the determination of their content as well were reliably obtained.
Raman spectroscopy is a spectroscopic technique based on inelastic scattering of monochromatic light, usually from a laser source. [3]
The dominant in Raman scattering is Rayleigh and the very small amount of Raman scattered light. The induced dipole moment occurs as a result of the molecular polarizability, where the polarizability is the change and deformability of the electron cloud about the molecule by an external radiation.
A very small amount of Raman scattered are Stokes and anti-Stokes. Molecules initially in the ground vibrational state (m) excited to virtual states, then return back to vibrational excited state (n) give rise to Stokes Raman scattering , molecules initially in vibrational excited state (n) excited to virtual states, then return back to ground vibrational state (m) give rise to anti-Stokes Raman scattering . The intensity ratio of the Stokes relative to the anti-Stokes Raman bands is governed by the absolute temperature of the sample, and the energy difference between the ground and excited vibrational states. The Stokes Raman lines are much more intense than anti-Stokes, since at ambient temperature most molecules are found in the ground state. Figure 1 describes Raman Effect. [4]
Figure 1. Thediagram The energy diagram of a molecule showing the origin of Raman scattering.
Raman spectroscopy as a vibrational spectroscopy technique, has gained more interest and powerful in research specially in identification and characterization of materials. Through specific spectral patterns, substances can be identified and molecular changes can be observed with high specificity. In addition, it is easy to use and need no sample preparation [5].
2. Materials and Methods
2.1. Materials
Surface water samples were collected from five regions in northern Sudan (Halfa, Abry, Abuhamad, Atbra and Shandy) These areas cover most of the area of northern Sudan, where the north begin with Shandy and ends with Halfa. Northern Sudan also includes the biggest part of the Nile. figure 2 shows the map of areas which samples were taken from.
Each sample was put in the glass substrate of the spectrometer and Raman spectrum was recorded in the region from 300 to 2800 . The Raman shift in wavenumber,
and the change in intensities of the scattered light in Raman spectra were compared with data in the previous studies and references.
Figure 2. The map of areas which samples were taken from.
2.2. Instrumentation
Laser Raman microscope spectrometer model Horiba Lab RAM HR D3, shown in the Figure 3 was used. The light source of this spectrometer is Laser with wavelength of 532 nm and output power of 6mW.
Figure 3. Laser Raman spectrometer model Horiba Lab RAM HR D3.
3. Results and Discussion
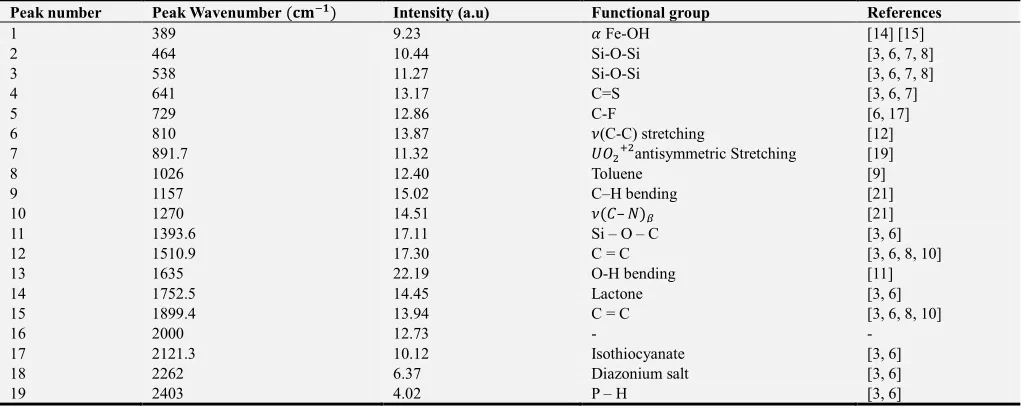
Figure 4. Raman spectrum of surface water sample taken from Halfa in the range from 389 to 2403 .
Table 1. Water sample collected from Halfa Nile.
Peak number Peak Wavenumber Intensity (a.u) Functional group References
1 389 9.23 Fe-OH [14] [15]
2 464 10.44 Si-O-Si [3, 6, 7, 8]
3 538 11.27 Si-O-Si [3, 6, 7, 8]
4 641 13.17 C=S [3, 6, 7]
5 729 12.86 C-F [6, 17]
6 810 13.87 (C-C) stretching [12]
7 891.7 11.32 antisymmetric Stretching [19]
8 1026 12.40 Toluene [9]
9 1157 15.02 C–H bending [21]
10 1270 14.51 – [21]
11 1393.6 17.11 Si – O – C [3, 6]
12 1510.9 17.30 C = C [3, 6, 8, 10]
13 1635 22.19 O-H bending [11]
14 1752.5 14.45 Lactone [3, 6]
15 1899.4 13.94 C = C [3, 6, 8, 10]
16 2000 12.73 - -
17 2121.3 10.12 Isothiocyanate [3, 6]
18 2262 6.37 Diazonium salt [3, 6]
19 2403 4.02 P – H [3, 6]
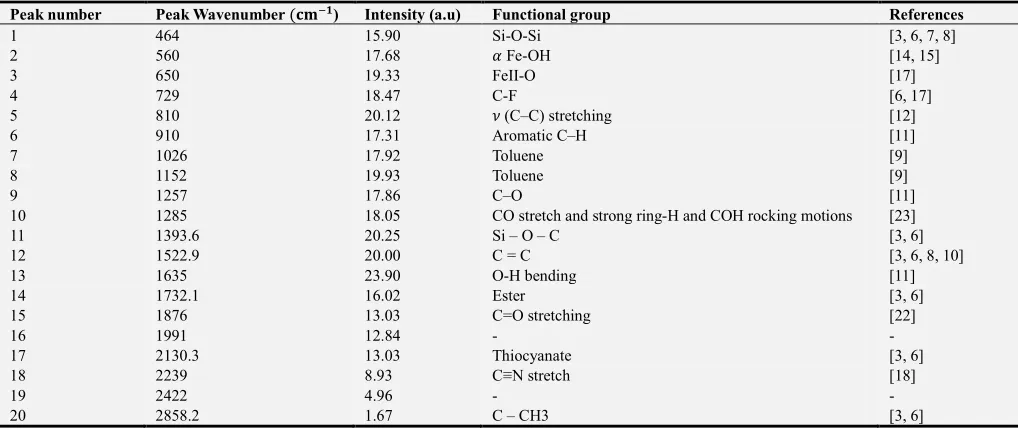
Figure 5 shows the Raman spectrum in the range from 464 to 2858.2 of a surface water sample taken from Nile in the area of Abry. clear peaks describe the vibration of water molecules and some components to other materials as illustrated in Table 2.
Table 2. Water sample collected from Abry Nile.
Peak number Peak Wavenumber ) Intensity (a.u) Functional group References
1 464 15.90 Si-O-Si [3, 6, 7, 8]
2 560 17.68 Fe-OH [14, 15]
3 650 19.33 FeII-O [17]
4 729 18.47 C-F [6, 17]
5 810 20.12 (C–C) stretching [12]
6 910 17.31 Aromatic C–H [11]
7 1026 17.92 Toluene [9]
8 1152 19.93 Toluene [9]
9 1257 17.86 C–O [11]
10 1285 18.05 CO stretch and strong ring-H and COH rocking motions [23]
11 1393.6 20.25 Si – O – C [3, 6]
12 1522.9 20.00 C = C [3, 6, 8, 10]
13 1635 23.90 O-H bending [11]
14 1732.1 16.02 Ester [3, 6]
15 1876 13.03 C=O stretching [22]
16 1991 12.84 - -
17 2130.3 13.03 Thiocyanate [3, 6]
18 2239 8.93 C≡N stretch [18]
19 2422 4.96 - -
20 2858.2 1.67 C – CH3 [3, 6]
The water sample which taken from the Nile in Abuhamad area, clear picture of the water components and some other materials as in figure 6 and Table 3 illustrates the analysis of this spectrum.
Figure 6. Raman spectrum of surface water sample taken from Abuhamad in the range from 464 to 2411.6 .
Table 3. Water sample collected from Abuhamad Nile.
Peak number Peak Wavenumber ( ) Intensity (a.u) Functional group References
1 464 10.87 Si-O-Si [3, 6, 7, 8]
2 560 14.48 Fe-OH [14, 15]
3 822 13.80 ASO symmetric stretching [19]
4 936 10.95 [13]
5 1041.3 16.30 Sulfonic acid [3, 6]
6 1136 19.31 symmetric stretchingofthe perchlorate ion [20]
7 1270 17.10 – [21]
8 1393.6 18.13 Si – O – C [3, 6]
9 1510.9 18.93 C = C [3, 6, 8, 10]
10 1635 23.56 O-H bending [11]
11 1752.5 14.46 Lactone [3, 6]
12 1899.4 14.02 C = C [3, 6, 8, 10]
13 1994 13.00 - -
14 2121.3 11.38 Isothiocyanate [3, 6]
15 2262 6.25 Diazonium salt [3, 6]
Figure 7 shows the Raman spectrum of the sample collected from the Nile in the Atbra area. beside the vibrations of water molecules some other vibrations were appeared in the spectrum. As shown in Table 4.
Figure 7. Raman spectrum of surface water sample taken from Atbra in the range from 421 to 2875 .
Table 4. Water sample collected from Atbra Nile.
Peak number Peak Wavenumber ) Intensity (a.u) Functional group References
1 421 7.88 C–N–C [20]
2 538 9.60 Si-O-Si [3, 6, 7, 8]
3 670 10.62 !Fe-OH [16]
4 764 11.02 C-F [3, 6]
5 822 11.49 ASO symmetric stretching [19]
6 1026 8.71 Toluene [9]
7 1136 11.02 symmetric stretchingofthe perchlorate ion [20]
8 1285 11.20 CO stretch and strong ring-H and COH rocking motions [23]
9 1374 11.89 Ethylbenzene [9]
10 1510.9 12.92 C = C [3, 6, 8, 10]
11 1635 17.86 O-H bending [11]
12 1876 8.57 C=O stretching [22]
13 1970 8.42 - -
14 2106 7.15 - -
15 2239 4.48 C≡Nstretch [18]
16 2411.6 2.99 P – H [3, 6]
17 2875 1.38 - -
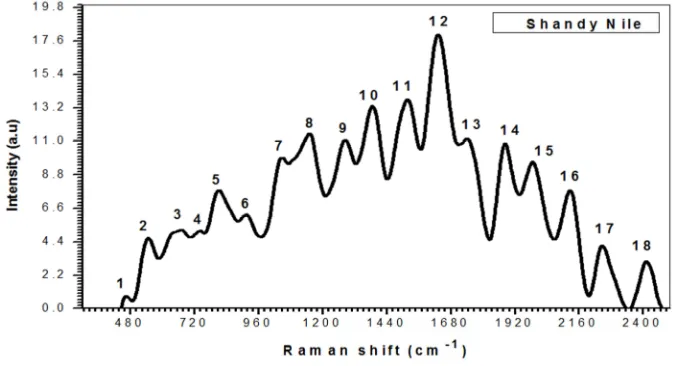
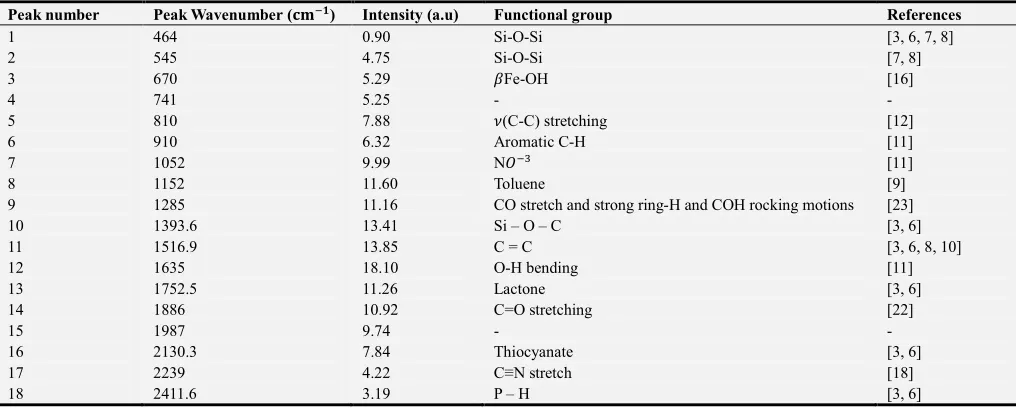
Figure 8. illustrates Raman spectrum of the water collected from the Nile in area of Shandy in the range from 464 to 2411.6cm . Table 5 lists the analysis of this spectrum.
Table 5. Water sample collected from Shandy Nile.
Peak number Peak Wavenumber ( ) Intensity (a.u) Functional group References
1 464 0.90 Si-O-Si [3, 6, 7, 8]
2 545 4.75 Si-O-Si [7, 8]
3 670 5.29 !Fe-OH [16]
4 741 5.25 - -
5 810 7.88 (C-C) stretching [12]
6 910 6.32 Aromatic C-H [11]
7 1052 9.99 N [11]
8 1152 11.60 Toluene [9]
9 1285 11.16 CO stretch and strong ring-H and COH rocking motions [23]
10 1393.6 13.41 Si – O – C [3, 6]
11 1516.9 13.85 C = C [3, 6, 8, 10]
12 1635 18.10 O-H bending [11]
13 1752.5 11.26 Lactone [3, 6]
14 1886 10.92 C=O stretching [22]
15 1987 9.74 - -
16 2130.3 7.84 Thiocyanate [3, 6]
17 2239 4.22 C≡N stretch [18]
18 2411.6 3.19 P – H [3, 6]
After the analysis of the samples we found that, the vibration modes of some materials appeared in all samples while some of them appeared in some samples and disappear in others.
1 O-H observed in the spectra of all samples (Halfa, Abry, Abuhamad, Atbra and Shandy), with intensities (22.19, 23.90, 23.56, 17.86 and 18.10) respectively.
2 Si-O-Si observed in the spectra of all samples (Halfa, Abry, Abuhamad, Atbra and Shandy), with intensities ((11.27, 10.44), 15.90, 10.87, 9.60 and 0.90) respectively.
3 Also C = C appeared in the spectra of all samples (Halfa, Abry, Abuhamad, Atbra and Shandy), with intensities ((17.30, 13.94), 20.00, (18.93, 14.02), 12.92 and 13.85) respectively.
4 Si – O – C appeared in the spectra of samples (Halfa, Abry, Abuhamad and Shandy) with intensities (17.11, 20.25, 18.13 and 13.41) respectively.
a)P – H observed in (Halfa, Abuhamad, Atbra and Shandy), with intensities (4.02, 4.79, 2.99 and 3.19) respectively.
5 Toluene observed in the spectra of samples (Halfa, Abry, Atbra and Shandy) with intensities (12.40, (17.92, 19.93), 8.71 and 11.60) respectively.
6 C≡N stretch appeared in the spectra of samples (Abry, Atbra and Shandy) with intensities (8.93, 4.48 and 4.22) respectively.
7 C-F appeared in the spectra of samples (Halfa, Abry and Atbra) with intensities (12.86, 18.47 and 11.02) respectively.
8 (C-C) stretching observed in the spectra of samples (Halfa, Abry and Shandy) with intensities (13.87, 20.12 and 7.88) respectively.
9 Lactone with intensities (14.45, 14.46 and 11.26) appeared in the spectra of samples (Halfa, Abuhamad and Shandy) respectively.
10CO stretch and strong ring-H and COH rocking motions with intensities (18.05, 11.20 and 11.16) appeared in the
spectra of samples (Abry, Atbra and Shandy) respectively.
11C=O stretching observed in the spectra of samples (Abry, Atbra and Shandy) with intensities (13.03, 8.57 and 10.92) respectively.
12 Fe-OH appeared in the spectra of samples (Halfa, Abry and Abuhamad) with intensities (9.23, 17.68 and 14.48) respectively.
13 – ) observedin the spectra of samples (Halfa and Abuhamad) with intensities (14.51 and 17.10) respectively.
14Isothiocyanate observed in the spectra of samples (Halfa and Abuhamad) with intensities (10.12 and 11.38) respectively.
15Diazonium salt observed in the spectra of samples (Halfa and Abuhamad) with intensities (6.37 and 6.25) respectively.
16with intensities (17.31 and 6.32) Aromatic C-H appeared in the spectra of samples (Abry and Shandy) respectively.
17Thiocyanate observed in the spectra of samples (Abry and Shandy) with intensities (13.03 and 7.84) respectively.
18(ASO ) symmetric stretching appeared in the spectra of samples (Abuhamad and Atbra) with intensities (13.80 and 11.49) respectively.
19 symmetric stretching of perchlorate ion appeared in the spectra of samples (Abuhamad and Atbra) with intensities (19.31 and 11.02) respectively.
20! Fe-OH appeared in the spectra of samples (Atbra and Shandy) with intensities (10.62 and 5.29) respectively. 21C=S observed in the spectra of sample Halfa with
intensity (13.17).
22 antisymmetric Stretching observed in the spectra of sample Halfa with intensity (11.32).
23C–H bending observed in the spectra of sample Halfa with intensity (15.02).
of sample Abry with intensities (19.33, 17.86, 16.02 and 1.67) respectively.
25N appeared in the spectra of sample Shandy with intensity (9.99)
a)C–N–C and Ethylbenzene appeared in the spectra of sample Atbra with intensities (7.88 and 11.89) respectively.
It is noted that the samples contain many toxic substances such as:
a cyanide (C≡N) is highly toxic. The cyanide anion is an inhibitor of the enzyme cytochrome c oxidize in the fourth complex of the electron transport chain (found in the membrane of the mitochondria of eukaryotic cells). It attaches to the iron within this protein. The binding of cyanide to this enzyme prevents transport of electrons from cytochrome c to oxygen. As a result, the electron transport chain is disrupted, meaning that the cell can no longer aerobically produce ATP for energy. Tissues that depend highly on aerobic respiration, such as the central nervous system and the heart, are particularly affected. This is an example of histotoxic hypoxia.
b Nitrate (N ) poisoning can occur through enterohepatic metabolism of nitrate due to nitrite being an intermediate. Nitrites oxidize the iron atoms in hemoglobin from ferrous iron (II) to ferric iron (III), rendering it unable to carry oxygen. This process can lead to generalized lack of oxygen in organ tissue and a dangerous condition called methemoglobinemia. Although nitrite converts to ammonia, if there is more nitrite than can be converted, the animal slowly suffers from a lack of oxygen.
c Arsenate ( ASO ) ) can replace inorganic phosphate in the step of glycolysis that produces 1,3-bisphosphoglycerate from glyceraldehyde 3-phosphate. This yields 1-arseno-3-phosphoglycerate instead, which is unstable and quickly hydrolyzes, forming the next intermediate in the pathway, 3-phosphoglycerate. Therefore, glycolysis proceeds, but the ATP molecule that would be generated from 1,3-bisphosphoglycerate is lost – arsenate is an uncoupler of glycolysis, explaining its toxicity.
4. Conclusions
Raman Spectroscopy is one of the best techniques that can be used to identify the surface water components. And It provides precise information about other materials found in the samples. The Raman spectra intensity of molecules is directly proportional to its concentration. It is very easy to quantitatively calculate the molar concentrations of components in water.
The results and the study show us the low quality of water in northern Sudan because it contains many of the toxic compounds.
We recommend the Government of Sudan to improve water quality in northern Sudan.
Acknowledgements
This research was performed using facilities at Micro and Nano Characterization Facility (MNCF), CeNSE, IISc, funded by Ministry of Electronics and Information Technology, and Department of Science and Technology Govt. of India’.
We wish to thank the Indian Institute of Science for recording the Raman spectra, and the Institute of Laser in Sudan for supporting us.
References
[1] DVandas, S. J., Winter, T. C. and Battaglin, W. A., 2002. Water and the Environment. American Geological Institute.
[2] Melissa Valentine, et al., 2010. Water Sources, Fourth Edition.
[3] Edwards HG., 2005. Modern Raman spectroscopy-a practical approach. Ewen Smith and Geoffrey Dent. John Wiley and Sons Ltd, Chichester, Pp. 210. ISBN 0 471 49668 5 (cloth, hb); 0 471 49794 0 (pbk).
[4] Peter Larkin, 2011. Infrared and Raman Spectroscopy Principles and Spectral Interpretation, Elsevier.
[5] Katharina Eberhardt, et al, 2015. Advantages and limitations of Raman spectroscopy for molecular diagnostics: an update.
[6] Robert, M. S., Francis, X. W. and David, J. K., 2005. Spectrometric identification of organic compounds. John wiley & Sons, Inc, Hoboken, edn, 7, p. 106.
[7] MANOHARAN, R. and SETHI, N., 2003. 8.51 Raman Analyzers.
[8] Socrates, G., 2004. Infrared and Raman characteristic group frequencies: tables and charts. John Wiley & Sons.
[9] Li, G., Chen, M. and Wei, T., 2009, July. Application of Raman spectroscopy to detecting organic contaminant in water. In 2009 IITA International Conference on Control, Automation and Systems Engineering (case 2009) (pp. 493-495). IEEE.
[10] Lin-Vien, D., Colthup, N. B., Fateley, W. G. and Grasselli, J. G., 1991. The handbook of infrared and Raman characteristic frequencies of organic molecules. Elsevier.
[11] Durickovic, I. and Marchetti, M., 2014. Raman spectroscopy as polyvalent alternative for water pollution detection. IET Science, Measurement & Technology, 8 (3), pp. 122-128.
[12] De Veij, M., Vandenabeele, P., De Beer, T., Remon, J. P. and Moens, L., 2009. Reference database of Raman spectra of pharmaceutical excipients. Journal of Raman Spectroscopy: An International Journal for Original Work in all Aspects of Raman Spectroscopy, Including Higher Order Processes, and also Brillouin and Rayleigh Scattering, 40 (3), pp. 297-307.
[13] Mabrouk, K. B., Kauffmann, T. H. and Fontana, M. D., 2013. Abilities of Raman sensor to probe pollutants in water. In Journal of Physics: Conference Series (Vol. 450, No. 1, p. 012014). IOP Publishing.
[15] Oh, S. J., Cook, D. C. and Townsend, H. E., 1998. Characterization of iron oxides commonly formed as corrosion products on steel. Hyperfine interactions, 112 (1-4), pp. 59-66.
[16] Shebanova, O. N. and Lazor, P., 2003. Raman spectroscopic study of magnetite (FeFe2O4): a new assignment for the vibrational spectrum. Journal of Solid State Chemistry, 174 (2), pp. 424-430.
[17] Nafie A. Almusleta, Mubarak M. Ahmedb, Siham M. Hassenc, 2016. Characterization of Magnetite and 2-line Ferrihydrite Using Laser Raman Spectroscopy International Journal of Sciences: Basic and Applied Research (IJSBAR).
[18] Ito, K., Kato, T. and Ona, T., 2002. Non-destructive method for the quantification of the average particle diameter of latex as water-based emulsions by near-infrared Fourier transform Raman spectroscopy. Journal of Raman Spectroscopy, 33 (6), pp. 466-470.
[19] Frost, R. L., Weier, M. L., Čejka, J. and Theo Kloprogge, J., 2006. Raman spectroscopy of walpurgite. Journal of Raman Spectroscopy: An International Journal for Original Work in all Aspects of Raman Spectroscopy, Including Higher Order Processes, and also Brillouin and Rayleigh Scattering, 37 (5), pp. 585-590.
[20] Sobrón, P., Rull, F., Sobron, F., Sanz, A., Medina, J. and Nielsen, C. J., 2007. Modeling the physico-chemistry of acid sulfate waters through Raman spectroscopy of the system FeSO4 H2SO4 H2O. Journal of Raman Spectroscopy: An International Journal for Original Work in all Aspects of Raman Spectroscopy, Including Higher Order Processes, and also Brillouin and Rayleigh Scattering, 38 (9), pp. 1127-1132.
[21] Ćirić-Marjanović, G., Trchová, M. and Stejskal, J., 2008. The chemical oxidative polymerization of aniline in water: Raman spectroscopy. Journal of Raman Spectroscopy: An International Journal for Original Work in all Aspects of Raman Spectroscopy, Including Higher Order Processes, and also Brillouin and Rayleigh Scattering, 39 (10), pp. 1375-1387.
[22] Phongpa-Ngan, P., Aggrey, S. E., Mulligan, J. H. and Wicker, L., 2014. Raman spectroscopy to assess water holding capacity in muscle from fast and slow growing broilers. LWT-Food Science and Technology, 57 (2), pp. 696-700.