illfiSTER COPY
e
Paper No. 972216
An ASAE Meeting Presentation
FIELD SCALE PERFORMANCE OF A VARIABLE RATE SPRINKLER FOR VARIABLE WATER AND NUTRIENT APPLICATION
by
B.A. King R.W. Wall D.C. Kincaid D.T. Westermann
Assistant Professor Associate Professor Agricultural Engineer Soil Scientist Biological and Agricultural Electrical Engineering USDA-ARS USDA-ARS
Engineering Department Department Northwest Irrigation and Northwest Irrigation and University of Idaho University of Idaho Soils Research Laboratory Soils Research Laboratory Aberdeen, Idaho, USA Moscow, Idaho, USA Kimberly, Idaho, USA Kimberly, Idaho, USA
Written for Presentation at the 1997 ASAE Annual International Meeting
Sponsored by ASAE
Minneapolis Convention Center Minneapolis, Minnesota
August 10-14, 1997
Summary:
A 3-span linear-move irrigation system was equipped with 32 prototype variable rate sprinklers. Water application uniformity was measured over a 2.7X range in application rate. The measured application uniformity was 90% or greater for all water application rates. Variable rate nitrogen application was evaluated on a 1.1 ha area. Variable rate nitrogen application was within 4% of target application. The variable rate sprinkler allows variable rate water application with minimal effect on water application uniformity.
Keywords:
Variable flow nozzle, Variable rate application, Chemigation, Sprinkler irrigation
The author(s) is solely responsible for the content of this technical presentation. The technical presentation does not necessarily reflect the official position of ASAE, and its printing and distribution does not constitute an endorsement of views which may be expressed.
Technical presentations are not subject to the formal peer review process by ASAE editorial committees; therefore, they are not to be presented as refereed publications.
Quotation from this work should state that it is from a presentation made by (name of author) at the (listed) ASAE meeting.
EXAMPLE — From Author's Last Name, Initials. "Title of Presentation." Presented at the Date and Title of meeting, Paper No. X. ASAE, 2950 Niles Road, St Joseph, MI 49085-9659 USA.
For information about securing permission to reprint or reproduce a technical presentation, please address inquiries to ASAE.
ABSTRACT
Thirty-two prototype variable rate sprinklers were constructed and installed on a 3-span, 100 m long linear-move irrigation system to test field scale performance. The uniformity of water application from the linear-move system was evaluated over a 2.7X range in application rate. A 1.1 ha area was divided into twelve 30.5 m square plots. Four arbitrary nitrogen chemigation maps were developed to test the ability of the variable rate sprinkler system to deliver target nitrogen applications. The four nitrogen chemigation maps were executed and water and nitrogen application were monitored in each plot. Field scale water application uniformity was within acceptable limits of 90% or greater. Variable rate water and nitrogen application from the linear-move system was within 4% of the target application when the system was functioning properly. Overall, the results from field testing are surprisingly good indicating that our variable flow sprinkler concept is technically feasible. Additional research, development and testing are needed to finalize a design, and ascertain reliability and economic feasibility.
INTRODUCTION
Historically, irrigation system design and management has treated fields as homogenous units for purposes of determining water requirements and irrigation scheduling. In practice, differential water requirements often develop within a field during the irrigation season, resulting from spatial differences in irrigation application efficiency and evapotranspiration rates. The inherent spatial variability in soil water holding capacity, soil depth, water infiltration rate, topography, fertility, pest infestations, and microclimate contribute to spatial variability in irrigation application efficiency and evapotranspiration rates. The development of irrigation systems capable of addressing spatial variability in irrigation requirements has the potential to increase water use efficiency, improve crop yield and quality, and reduce leaching of chemicals below the crop root zone.
flows from a single sprinkler in proportion to the desired application rate using an appropriate duty cycle. On-off cycling has been simulated and field validated on a small scale by Fraisse et al. (1995). Evans et al. (1996) describes the development of a variable rate irrigation system on a commercial center pivot which employs on-off cycling.
King and Kincaid (1996) developed an approach for varying the flow from a reduced pressure sprinkler in a manner similar to pulsing, but without completely turning flow off. The effective cross sectional area of the nozzle is changed by alternately inserting or removing a concentric pin from the nozzle using a linear actuator. When the pin is removed, full flow occurs. When the pin is fully inserted into the center of the nozzle, the cross sectional area is effectively reduced by an amount equal to the cross sectional area of the pin. Flow is thus reduced to a predetermined lower limit when the pin is inserted, and a "time-averaged" variable flow rate between the lower limit and full flow can be achieved by "cycling" the pin in and out of the nozzle using an appropriate duty cycle. For example, if inserting the pin reduces flow to 40% of its full value, a flow rate equal to 85% can be achieved by inserting the pin for 15 seconds and removing it for 45 seconds during a one minute duty cycle. Laboratory testing of a single prototype
variable rate sprinkler showed the approach to have great potential as target sprinkler flow rates were easily obtained with minimal effect on the sprinkler application rate pattern.
The overall objective of this research project was to determine if the laboratory results of King and Kincaid (1996) could be extended to the field scale to apply variable target amounts of water and chemicals. The specific objective was to test the ability of a prototype variable rate sprinkler to deliver spatially varied target amounts of water and chemical from a linear-move irrigation system under field conditions.
MATERIALS AND METHODS
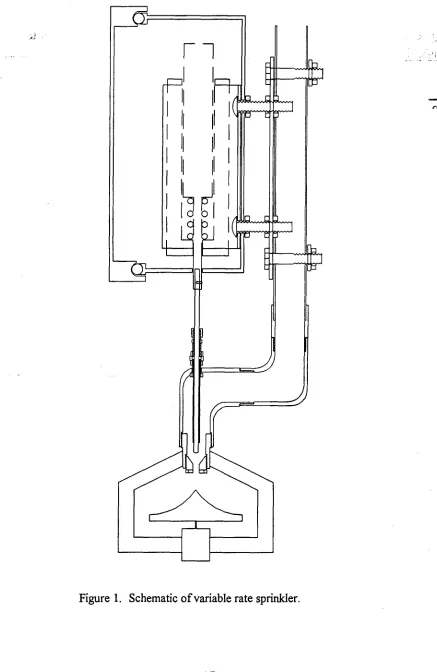
A schematic of the variable rate sprinkler is shown in Figure 1. The prototype sprinkler assembly was constructed starting with a threaded 19 mm PVC 90° elbow. The elbow is modified by drilling a hole in the elbow which is axially aligned with the threaded female end of the elbow. A rod guide made from a brass hose barb is inserted into the female end of the elbow with the threaded end of the barb extending through the hole drilled in the elbow. The inside diameter of the hose barb and its attachments are pre-drilled to allow free axial movement of a predetermined size rod and improve axial alignment of the rod guide assembly. A rotating-plate type medium pressure sprinkler (Nelson R30) is threaded onto the female end of the elbow. The rod is installed through the rod guide and extended through the sprinkler nozzle. The sprinkler is fitted with a nozzle of the same diameter as the rod. The rod guide is axially aligned with the sprinkler nozzle using the rod so as to allow free axial movement of the rod. Then the rod guide is fixed in place with epoxy and allowed to cure. These steps are taken to obtain axial alignment of the rod guide with the sprinkler nozzle.
The sprinkler-elbow assembly is attached to 19 mm PVC piping at the male threaded end of the 90° elbow using a second 90° elbow. A metal back plane is affixed relative to the
assembly. The solenoid is bolted to the back plane through slots in the back plane which allow axial alignment of the solenoid plunger with the rod through the sprinkler-elbow assembly. The push solenoid has an integral spring to return the solenoid plunger to the unenergized retracted state. A fixed pressure regulator is used to provide constant pressure to the sprinkler nozzle. This simple construction allowed the feasibility of the variable rate sprinkler concept to be field tested without committing extensive resources to design and fabrication of pre-production quality devices.
Our goal was to field test the prototype variable rate sprinkler over a minimum 2.5X range in flow rate on a 3-span 100 m linear-move irrigation system located at the University of Idaho Aberdeen Research and Extension Center. Before constructing thirty-two of the prototype sprinklers, we first needed to select a suitable rod and nozzle size combination to provide the desired range in flow rate. We elected to begin with a 4.76 mm (3/16 in) diameter rod as this size is readily available and select the nozzle size needed to provide the desired range in flow rate. We constructed one prototype sprinkler assembly and tested various nozzle sizes in the laboratory to validate the effect of the rod on sprinkler pattern and flow rate. One and two minute duty cycles were used for the tests. Sprinkler flow rate was determined by weighing the mass of water from the sprinkler over a 2 minute period and averaging two mass measurements. Radial leg
application rate pattern tests were conducted using catch cans located at 1/3 m increments from the sprinkler starting a 2/3 m and extending to 10 m. The sprinkler was located at a height of 2 m above the catch cans and the test duration was 30 minutes. All sprinkler tests used 6-groove rotator plates on the sprinkler (R30 w/D6 plates, Nelson Irrigation Co., Walla Walla, WA)' with a
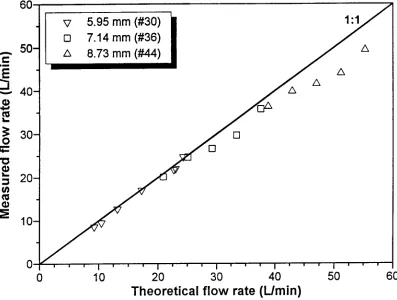
138 kPa (20 psi) pressure regulator. Nozzle sizes of 5.95, 7.14 and 8.73 mm (#30, #36 and #44, respectively) were tested with the 4.76 mm (3/16 in) rod.
Thirty-two of the prototype variable rate sprinkler assemblies were constructed as shown in Figure 1. The selected rod size was 4.76 mm (3/16 in) and nozzle size was 5.95 mm (#30) which theoretically provided a 2.7X range in flow rate from the sprinkler. The prototype sprinklers were installed on the linear-move system with 3 m spacing between sprinklers at approximately 2 m above ground level. Each sprinkler utilized a fixed 138 kPa (20 psi) pressure regulator to supply constant pressure to the sprinkler regardless of system pressure and location along the linear-move lateral.
The center-pivot control network developed by Wall et al. (1996) for variable rate center pivot irrigation was modified to implement a Pulse Width Modulation (PWM) control scheme to operate the prototype sprinklers on the linear-move irrigation system. The control network utilizes the Echelon control and communications network technology (Echelon Corp., Palo Alto, CA) for its core architecture. This communications network provides for power line carrier based bi-directional communications. The Echelon power line communications network utilizes two proprietary hardware components, a PLT-20 power line transceiver and a Neuron 3150/3120 microprocessor from third party sources. Proprietary software on the 3150/3120 microprocessor manages the peer-to-peer network communications. Wall et al. (1996) interfaced the 3150/3120
network microprocessor to a secondary microprocessor to provide flexible Input/Output (I/O) functions needed for implementing variable rate center pivot irrigation. The I/O functions include
14 lines of digital I/O, one 0-20 ma analog output, one 0-4.096 VDC input (12-bit resolution), and one channel of RS232 serial communications. This allows the center pivot control network to be configured as a master-slave network which is better suited to the variable rate irrigation control situation. A separate power line interface board allows the Echelon PLT-20 power line transceiver to utilize the 480 VAC 3-phase power supply of the irrigation system as the
communication medium. An additional separate valve driver board allows the 14 lines of digital I/O to be used to control 24 VDC solenoids.
A block diagram of the variable rate irrigation control network installed on the 3-span linear-move irrigation system is shown in Figure 2. The master controller consists of a single board computer equipped with a 4X40 LCD, 4X4 keypad and two RS232 serial ports. One serial port is used for downloading variable rate application maps and the second is used to interface to the Echelon communications network through the RS232 communications port on the network interface. The position of the linear-move irrigation system in the field is estimated from a given initial position and calculated travel distance based on measured time of motion and calibrated travel speed. The estimated position is periodically checked manually. The 0-20 ma analog output of the network interface board is used to the control the chemical injection flow rate proportional to computed time-averaged system flow rate. As implemented, the control network consisted of five sprinkler control nodes designated as nodes B through F. Nodes B and F each controlled seven sprinklers and nodes C, D and E controlled six sprinklers. Each sprinkler was individually addressable by the master controller and the variable rate control map. Each sprinkler control node operated independently of the other sprinkler control nodes. The network nodes are connected to the irrigation system power supply at the tower motor control box.
Variable rate chemical application is achieved by varying water application while
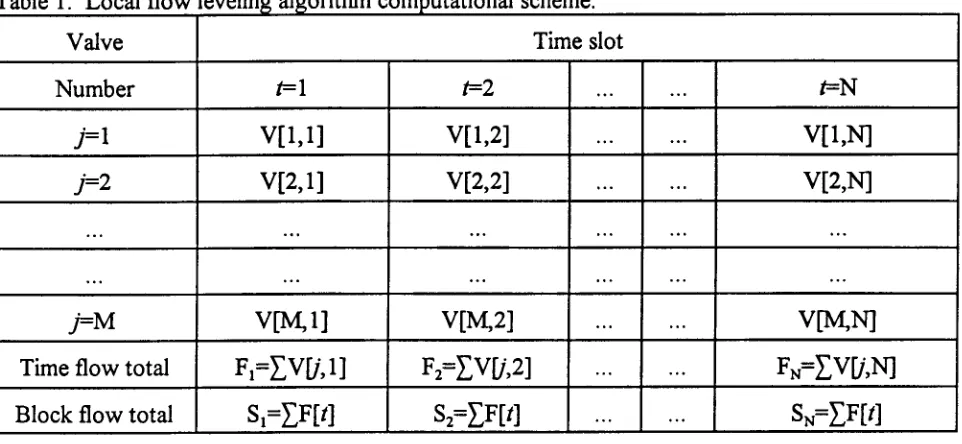
maintaining constant chemical concentration in the applied water. This approach requires variable rate chemical injection proportional to total system flow rate. The chemical injection flow rate is calculated based on the time-averaged flow rate of the system which is computed as the sum of the time-average flow of each sprinkler. Since each sprinkler control node operates independently of all the others, a local flow leveling algorithm was implemented at each node to minimize total flow rate fluctuation of the system and thus minimize chemical concentration fluctuations with steady proportional chemical injection. The local flow leveling algorithm requirements were:
1. Minimize fluctuations in sprinkler flow rate over the PWM period. 2. Limit sprinkler flow states to two over the PWM period.
The purpose of the second requirement was to minimize the number of mechanical actuations of the sprinkler and maximize its operational life time. The computational scheme of the local flow leveling algorithm is shown in Table 1. The algorithm requires the maintenance of a two
The second to the last row of the array contains the sum of the sprinkler states for each time slot, F[i,j]. The numerical value F[i,j] is indicative of the local flow rate during time slot j. The last row of the array is the sum of the F[i,j] over the next k time slots inclusive, S PA The value for k is determined by the PWM value communicated to the node by the network master controller. Calculation of S[i,j] must use circular array referencing to calculate S[i,j] near the end of the PWM period. The minimum value of S[i,j] indicates the time slots where the sprinkler flow can be at the high flow state relative the other sprinklers to minimize local flow rate fluctuations. The flow leveling algorithm starts by setting the state of the sprinkler to be scheduled to zero over all time slots. The sprinkler control array is only updated when the PWM value for a sprinkler changes. The local flow leveling algorithm was implemented allowing for 14 sprinklers and 20 discrete time slots over a 1 min PWM period. Using 20 discrete time slots provided PWM control with 5% resolution over the 1 min PWM period.
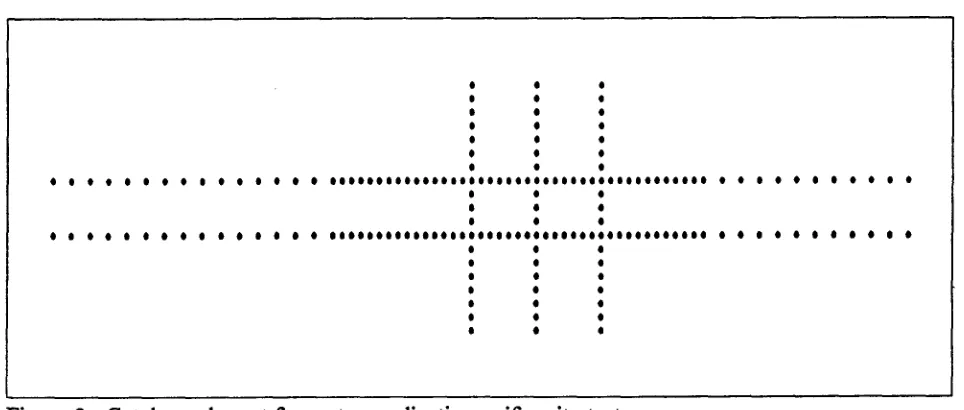
The catch can arrangement used to test water application uniformity of the linear-move irrigation system equipped with the prototype variable rate sprinklers is shown in Figure 3. Two rows of catch cans spaced 4 m between rows were placed parallel to the linear-move irrigation system lateral. The spacing between the catch cans within a row was 2 m along the total system length with additional catch cans along the middle span of the linear-move system to provide 1 m spacing. Three rows of catch cans with 1 m spacing aligned perpendicular to the system lateral were located under the middle span of the linear-move system to measure water application
uniformity in the direction of system travel. The tests were conducted when wind conditions were most favorable. Wind speed at 2 m height was recorded within 400 m of the linear-move system.
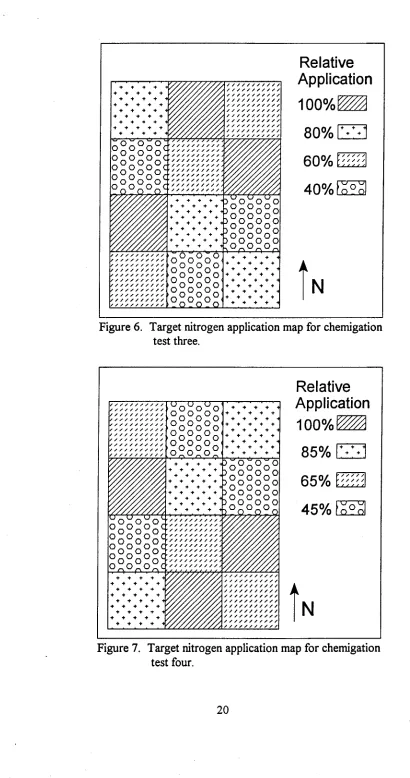
The accuracy of variable rate water and chemical application was also evaluated. A 1.1 ha field area was divided into twelve 30.5 m square plots. Four arbitrary nitrogen application maps were developed and implemented to test the ability of the variable rate sprinklers to deliver target water and nitrogen applications. The four arbitrary nitrogen application maps are shown in Figures 4 through 7. The nitrogen source injected into the irrigation system was urea-ammonium nitrate (URAN) which is 24.4% nitrate, 24.4% ammonia and 51.2% urea nitrogen composition by mass. A set of ten catch cans diagonally arranged in three columns with 1 m spacing between and within each column was used to measure water application at the center of each plot. Separate water samples for NO3-N and NH4-N analysis were collected at four locations near the center of each plot, one in each quadrant. After collection, the water samples were treated with boric acid to stabilize the NH4-N. The URAN was injected into the linear-move system at a steady rate proportional to the time-averaged total flow rate of the system. The time-averaged flow rate of the system was calculated as the sum of the time-averaged flow rate of each sprinkler.
RESULTS AND DISCUSSION
during laboratory testing was monitored at the elbow attached to the lower end of the 19 mm straight pipe section (Figure 1.). Theoretical sprinkler flow rate was calculated based on the pressure at this location assuming negligible pressure loss to the sprinkler nozzle. Actual sprinkler flow rate tends to be slightly less than theoretical flow rate for flow rates less than 28 L/min. This is also likely due to pressure loss around the rod guide. These results show that the water chamber directly above the sprinkler nozzle needs to be enlarged and streamlined to minimize pressure loss between the pressure regulator and the sprinkler nozzle. The results also show that time-averaged variable flow can be easily obtained from a sprinkler nozzle using this approach. Sprinkler flow rate was not significantly affected by pressure loss around the rod guide at flow rates less than 28 L/min. Thus, we selected a nozzle size of 5.95 mm (#30) with 4.76 mm (3/16 in) diameter rod for use in the field tests. This nozzle and rod size combination provided a 2.7X range in sprinkler flow rate.
Radial leg application rate patterns for the 5.95 mm nozzle and 4.76 mm rod size combination are shown in Figure 9. Cycling the rod in and out of the nozzle to obtain various effective sprinkler flow rates affects the application rate pattern proportionately. The change in effective application rate is roughly equivalent to superposition of the application rate pattern with the rod extended into the nozzle (36%) and retracted (100%) in proportion to the duty cycle. The wetted radius of the sprinkler pattern is notably reduced when the rod is continuously extended into the nozzle (36%). However, the wetted radius is nearly equivalent to the 100% flow condition for flow percentages greater than 50%. Thus, a 2X range in flow rate can likely be obtained from the sprinkler without any significant effect on water application uniformity.
The measured water application uniformities of the linear-move system for various target application percentages are listed in Table 2. Water application uniformity for the linear-move system is shown for the whole system length based on 2 m catch can spacing and for the middle span of the system based on 1 m catch can spacing. Water application uniformity is slightly greater for the middle span than for the whole system. We attribute this to elimination of system end effects and placement of the best variable rate sprinkler assemblies in the middle span of the system. Despite our efforts to construct the variable rate sprinkler assemblies with rods
concentric with the sprinkler nozzle we were not entirely successful. Sprinkler assemblies which were not perfect were placed at the ends of the linear-move system. The traverse water
application uniformities shown in Table 1 represent the uniformity parallel to the direction of system travel for each row of catch cans perpendicular to the middle span of the linear-move system.
uniformities are within acceptable limits and the results are extremely encouraging. The fact that we obtained water application uniformities of 90% or greater with the simply constructed variable rate sprinklers is quite remarkable. We feel that with development of manufacturing techniques which guarantee concentric placement of the rod in the sprinkler nozzle, higher application uniformities could be obtained. Thus, if properly implemented the variable rate sprinkler concept should maintain consistent water application uniformity over a 2.5X range in flow rate.
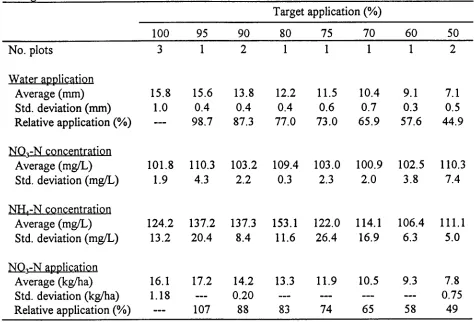
Nitrogen application results for the target application map of Figure 4 are shown in Table 3. This target application map included eight target application percentages, most of which were not repeated. The 5% PWM resolution of the control system limits water application resolution to 3.2% over the controlled application rate range of 36 to 100% of sprinkler flow rate. This resolution is partially the reason for some of the differences between target and actual applications shown in Table 3. By definition, a 90% water application uniformity has a 1.6 mm average deviation for an average application depth of 16 mm. Thus, a 10% deviation from the target application depth can easily occur over a small sample area under a well maintained linear-move irrigation system. Thus, a target application difference of 5% may not necessarily be detected with a single trial. The fact that the measured water applications were close to the target applications with as little as 5% difference in target application is quite remarkable. In general, the measured water application depths were very close to the target applications depths.
The mean NO3-N and NH4-N concentrations in the water applied to each target nitrogen application are also shown in Table 3. The average concentrations should be constant across all target applications if the variable rate chemigation system is functioning properly. Variable rate chemical application, which is the product of water application depth and chemical concentration, is attained by varying the water application depth and proportionally matching chemical injection rate with system flow rate to maintain constant chemical concentration in the applied water. The NO3-N concentration for the 95, 80 and 50% target applications were higher than expected. We believe that this is the result of a chemical injection system malfunction as all three target
applications occurred at the same time. We also had difficulty keeping some of the sprinkler assemblies operating for the duration of the test. The rods became stuck or did not travel the full distance to properly engage and/or retract from the sprinkler nozzle. We routinely visually checked the operation of each variable rate sprinkler assembly throughout the test and attempted to adjust those not functioning properly while the linear-move system was operating. This allowed the test to be conducted but may have resulted in excess nitrogen applied to plots irrigated when the sprinklers were not functioning properly.
The nominal NO3-N and NH4-N concentrations in the nitrogen source are theoretically equal but were not equal in the applied water. The measured NH4-N concentration in the URAN was 5% greater that the measured NO 3-N concentration. However, the NH4-N concentration in the applied water was significantly greater that the NO 3-N concentration and often varied
considerably. We believe this is due to hydrolysis of the urea providing an increase in NH4-N concentration measured in the applied water. Consequently, the mean NH 4-N concentration in the applied water are shown in Table 3 for reference but are not considered representative of variable rate application system performance.
and nitrogen concentration, a 10% deviation of either from the target result in a 10% deviation in applied mass. In general, the actual relative NO 3-N mass applied is very close to the target amounts. The most notable exception is for the 95% target application where over application of NO3-N is due largely to the high NO 3-N concentration in the applied water. Overall, the results are extremely encouraging given the difficulty we had in achieving sustained operation of some of the variable rate sprinklers and a malfunction in the chemical injection system.
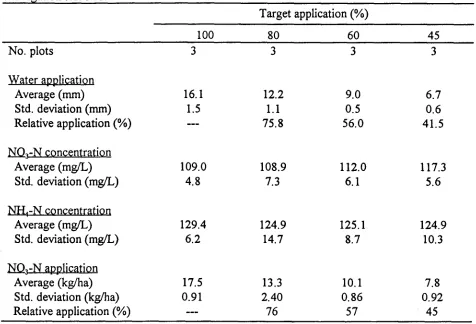
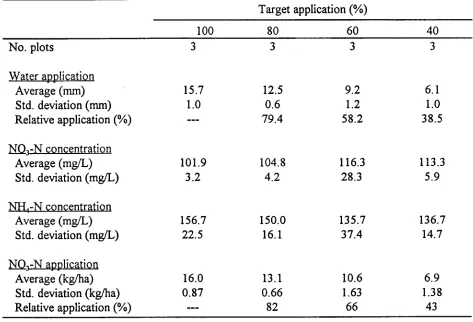
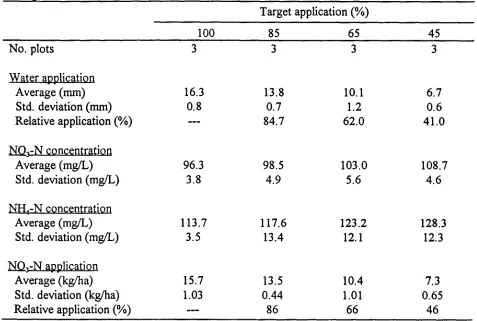
Mean applied water depth, NO 3-N and NH4-N concentrations and applied NO3-N mass for variable rate nitrogen application maps 2, 3 and 4 are shown in Tables 4, 5 and 6, respectively. Nitrogen application maps 2, 3 and 4 were designed to apply four levels of nitrogen each
replicated three times during each test. This was done to obtain a better indication of water and nitrogen application for each target application rate. The results in Tables 3, 4 and 5 show that actual water applications were generally within 4% of the target applications. On occasion the measured NO3-N concentrations were high which we attribute to intermittent malfunctioning of the variable rate sprinklers and a systematic problem with the chemical injection system.
Following completion of the field tests and chemical analysis of the water samples, we discovered an internal linkage problem with the chemical injection pump which created a 6 to 9% hysteresis in chemical injection flow rate. The applied NO 3-N mass was generally within 4% of the target application with the exception of when the NO3-N concentrations were high. Overall, the results show that the variable rate sprinkler concept is capable of applying target water and chemical amounts when functioning properly. With appropriate design modifications and proper manufacturing, we feel that our variable rate sprinkler concept is definitely feasible.
SUMMARY
Our new approach for obtaining variable rate flow from a sprinkler has the following advantages relative to the current approach of using multiple sprinklers.
1. Potentially less expensive through reduced wiring, plumbing and number of pressure regulators and sprinkler heads required.
2. Free draining for automatic freeze protection in cold climates.
3. Total system flow is limited to a predetermined minimum when the flow from all
sprinkler heads is reduced, thereby limiting the potential for system physical damage as a result of user error in operating the control system.
Advantages of our approach relative to on-off pulsing a diaphragm valve include:
1. Limits flow to predetermined minimum flow rate as opposed to zero flow, thereby limiting potential system physical damage.
2. Limits water pressure fluctuations as a result of pulsing, thereby limiting potential system physical damage as a result of pressure surges.
3. Limits total system flow rate variations for easier control of chemical injection rates for variable rate chemigation.
4. Potentially provides improved application uniformity for reduced pressure sprinklers with small wetted diameters and donut shaped application patterns.
5. Potentially increases the life of pressure regulators by greatly reducing pressure fluctuations at the sprinkler during pulsing.
The disadvantages of our new approach include:
1. Does not allow for zero flow without additional hardware.
2. Utilizes a limited number of moving parts which may increase failure rate since they are subject to corrosion or binding.
3. The restricting rod needs to be matched to the sprinkler head nozzle size which change along the length of a center pivot system.
The advantages of our approach to obtaining variable flow from a sprinkler relative to current methods for obtaining variable rate application along a center pivot warrant serious consideration of the concept.
Results from laboratory tests show that the variable rate sprinkler application rate pattern is roughly equivalent to linear interpolation of the sprinkler application patterns with the rod engaged in the nozzle and retracted in proportion to the duty cycle. Field scale water application uniformity from the linear-move irrigation system equipped with the prototype variable rate sprinklers was within acceptable limits of 90% or greater. Variable water and nitrogen application from the linear-move system was within 4% of the target application when the system was
functioning properly. Overall, the results from field testing are surprisingly good indicating that our variable flow sprinkler concept is technically feasible. The economic feasibility is not clearly defined as additional research, development and testing are needed to finalize the design and ascertain reliability.
REFERENCES
Fraisse, C.W., D.F. Heerman, and H.R. Duke. 1995. Simulation of variable water application with linear-move irrigation systems. Transactions of the ASAE 38(5):1371-1376. King, B.A. and D.C. Kincaid. 1996. Variable flow sprinkler for site-specific water and nutrient
management. ASAE Paper No. 96-2074. St. Joseph, Mich.:ASAE.
King, B.A., J.C. Stark, I.R. McCann, and D.T. Westermann. 1996. Spatially varied nitrogen application through a center pivot irrigation system. In Proc. 3rd International
Conference on Precision Agriculture, eds. P.C. Robert, R.H. Rust, and W.E. Larsen, 85-94. ASA, Madison, WI.
Sadler, E.J., C.R. Camp, D.E. Evans, and L.J. Ursey. 1996. A site-specific center pivot irrigation system for highly-variable coastal plain soils. In Proc. 3rd International Conference on Precision Agriculture, eds. P.C. Robert, R.H. Rust, and W.E. Larsen, 827-834. ASA, Madison, WI.
Wall, R.W., B.A. King and I.R. McCann. 1996. Center pivot irrigation system control and data communications network for real-time variable water application In Proc. 3rd
International Conference on Precision Agriculture, eds. P.C. Robert, R.H. Rust, and W.E. Larsen, 757-766. ASA, Madison, WI.
Table 1. Local flow leveling algorithm computational scheme.
Valve Time slot
Number t=1 t=2 ... ... 1=N
j=1 V[1,1] V[1,2] ... ... V[1,N]
j=2 V[2,1] V[2,2] ... ... V[2,N]
... ... ... ... ... ...
... ... ... ... ... ...
I'M V[M,1] V[M,2] ... ... V[M,N]
Time flow total FI=EV[41] F2=EVU,21 ••• ••• FN=EVU,N]
Block flow total S I=EF[t] S2=EF[t] ••• ••• SN=EF[t]
Table 2. Measured water application uniformity for various application percentages.
Relative
application (%)
Application uniformity (%) Average
Lateral
Traverse
wind
speed Whole
system
Middle
span 1 2 3 (m/s)
100 94.5 96.2 97.1 97.9 97.6 0.5
84 95.1 94.8 97.0 97.5 97.2 0.5
68 93.6 95.4 97.0 96.6 97.2 1.1
92.5 94.1 94.6 97.4 96.9 0.7
52 89.9 90.9 96.8 97.4 97.9 1.1
90.4 93.8 95.9 96.7 95.9 1.2
Table 3. Water application and NO3-N and NH4-N concentration in the applied water for chemigation test one.
Target application (%)
100 95 90 80 75 70 60 50
No. plots 3 1 2 1 1 1 1 2
Water application
15.8 15.6 13.8 12.2 11.5 10.4 9.1 7.1
Average (mm)
Std. deviation (mm) 1.0 0.4 0.4 0.4 0.6 0.7 0.3 0.5
Relative application (%) --- 98.7 87.3 77.0 73.0 65.9 57.6 44.9
NO3-N concentration
101.8 110.3 103.2 109.4 103.0 100.9 102.5 110.3 Average (mg/L)
Std. deviation (mg/L) 1.9 4.3 2.2 0.3 2.3 2.0 3.8 7.4
NI-14-N concentration
124.2 137.2 137.3 153.1 122.0 114.1 106.4 111.1 Average (mg/L)
Std. deviation (mg/L) 13.2 20.4 8.4 11.6 26.4 16.9 6.3 5.0
NO3-N application
16.1 17.2 14.2 13.3 11.9 10.5 9.3 7.8
Average (kg/ha)
Std. deviation (kg/ha) 1.18 0.20 0.75
Relative application (%) --- 107 88 83 74 65 58 49
Table 4. Water application and NO3-N and NH4-N concentration in the applied water for chemigation test two.
Target application (%)
100 80 60 45
No. plots 3 3 3 3
Water application
16.1 12.2 9.0 6.7
Average (mm)
Std. deviation (mm) 1.5 1.1 0.5 0.6
Relative application (%) 75.8 56.0 41.5
NO3-N concentration
109.0 108.9 112.0 117.3
Average (mg/L)
Std. deviation (mg/L) 4.8 7.3 6.1 5.6
NI-14-N concentration
129.4 124.9 125.1 124.9
Average (mg/L)
Std. deviation (mg/L) 6.2 14.7 8.7 10.3
NO3-N application
17.5 13.3 10.1 7.8
Average (kg/ha)
Std. deviation (kg/ha) 0.91 2.40 0.86 0.92
Table 5. Water application and NO3-N and NH4-N concentration in the applied water for chemigation test three.
Target application (%)
100 80 60 40
No. plots 3 3 3 3
Water application
15.7 12.5 9.2 6.1
Average (mm)
Std. deviation (mm) 1.0 0.6 1.2 1.0
Relative application (%) 79.4 58.2 38.5
NO3-N concentration
101.9 104.8 116.3 113.3
Average (mg/L)
Std. deviation (mg/L) 3.2 4.2 28.3 5.9
NI-14 -N concentration
156.7 150.0 135.7 136.7
Average (mg/L)
Std. deviation (mg/L) 22.5 16.1 37.4 14.7
NO3-N application
16.0 13.1 10.6 6.9
Average (kg/ha)
Std. deviation (kg/ha) 0.87 0.66 1.63 1.38
Relative application (%) 82 66 43
Table 6. Water application and NO3-N and NH4-N concentration in the applied water for chemigation test four.
Target application (%)
100 85 65 45
No. plots 3 3 3 3
Water application
16.3 13.8 10.1 6.7
Average (mm)
Std. deviation (mm) 0.8 0.7 1.2 0.6
Relative application (%) 84.7 62.0 41.0
NO3-N concentration
96.3 98.5 103.0 108.7
Average (mg/L)
Std. deviation (mg/L) 3.8 4.9 5.6 4.6
NH4-N concentration
113.7 117.6 123.2 128.3
Average (mg/L)
Std. deviation (mg/L) 3.5 13.4 12.1 12.3
NQ3-N application
Average (kg/ha) 15.7 13.5 10.4 7.3
Std. deviation (kg/ha) 1.03 0.44 1.01 0.65
Figure 1. Schematic of variable rate sprinkler.
4 A
4► 4In
3 Phase 480 VAC
Power
Line
Coupler
I
Power
Power
PowerPower
PowerLine
Line
LineLine
LineCoupler
Coupler
Coupler
Coupler
CouplerD C
Chemical
Injection
3120 pP
Interface
Board
l'
Single
Board
Computer)
411E-• • • • • • • • •• e •
• • •
6 * I
• • .
OOOOOOOOOOOOOOOOOOOO it • •
* • •
s 41 I
OOOOOOOOOOOOOOOOOOOO
e • a
• • •
• • •
• • •
• • •
# • I
I * •
3120 pP
Interface
Board
3120 pP
Interface
Board
3120 pP
Interface
Board
3120 pP
Interface
Board
3120 pP Interface BoardValve
Driver
Driver
Valve
Driver
Valve
Valve
Driver
DriverValveFigure 2. Block diagram of the variable rate irrigation and chemigation control network.
++ + 4
DPLin <
%KM
eP0.4.1•4
.0_0_0_
X000007o o l0
ILTLTal
Relative
Application
100%
80%
60%
45%
N
// / / / / / / / /7,7,,",
,,,",7,7,7,
..,
. .3 .... , , . , , ., , ., , , , , , .., . I , ., ., , , , .. , , ., , .. , , , , , , , , , , , , ., ,, ., ... ,,, ,,00.0.0r
,0,0,0 ,0,0,0 ,0,0,0 000, , ,
A
0
00 00
0
4+4+4+4+4
+ + + +r
0 0 0+ + + + 4 D 00000 + + + +
+ + + + ++ + 1. + 0 0 00 0 0
4
4
4
4.
44
.4.
+
7
All
A
0 0 00
00
00
0,,,,,,,,,,
,,,,,,,,,,
,,,,,,,,,,
/ / / //
4 4 4 4
4 4 4 4 4
4 4 4 4+ + + + +
/ / / / / / / / / / ++4 44 + + 0000 0 0 + 4 + + / / / / / / / / / / /
+ + 4 4 4 / / / / / / / / / / / 0 0 0 + 4 4 4 / / / / / / / I / / / 0 0 0 / / / / / / / / / / / 0 0 0 + + + + + / / / / / / / / / / / 0 0 0 + + + + / / / / / / / / / / / 0 0 0 + + + 4 + /
0 0 0 + + 4 + / / / / / / / / / / / 0 0 4 4 44 4 4 / / / / I / / / / / / 0 0 0 4 4 4 4 / / / / / / / / / / /
I+ +4 4•
• / • • / / • • • • • • LI 0 0 0 0 0
0 _ 0 ,U0 0 0 0 `-' 00 0
00 Oo
0 00 ° 0 0 00 0 0
r
A
* * *
0
* * 10 .0....
0 Ot 0 0
r) CI C10 0 0 Cl ICI 0 0 0 Di
100 100420000 *
++++
* + -4 + -4 + 4. +
4-0,0,0 o 0 0 0 0 •0 0 0 ov000000o-00000 ,/fr + + + + +
+ f + f
00000000 0 0 0°0°0°0°0 0
+++++
<PO00°0°0°A,
+ + + ++
+
+++
+ + 0000000 000000000000..1011:100
CI 0 00 0 N. N. N. N. N. N. N-1:7 0 CI 0 101 CI N. N N. *00000* NI\ N% N.%CI 41 41 0 0 0 .N. N. N. N N. 42 E:I CI CI CI
000000 \. -,.. ... --,. -.. -.... N.
err e •
..ir..v..v .n•••••••••••n
4.0.4,_nn••nn
1014414.••••••••
+ 4 + + + + +
++ +++ 4.
AD...••••••• Attibatnn•:•••!
!ID. ••444,4144.•••414.•40401114
44001440404e 0.404,dr0i ji
41044-114.-•••-• . 4.04440h
+ + + + + + + ++ +++++
+ + + 4.
+ + + + + +++
Relative
Application
100%
95%
90%
80%
75%
70%
60%
50%
tN
Figure 4. Target nitrogen application map for chemigation test one.
Figure 5. Target nitrogen application map for chemigation test two.
Relative
Application
100%
80%
60%
40%
+ 1. 4. + + +
+ + + +
Or / / / / / / / / / / / ///////////
4 . + + f . f ++ A til/ / / / / / / /
4 / / / / 0 0 0
000,
^ , / / / / / / / / / /„,„,„„00 0 00 0 ,
,
/ / / . l/ / / / / / / / /, /, . , ,/ /, /, , „/ . I. , 000000• ;;;/////// 0 0 00 0 0•0 0 0 //////////////////// Z.
o
r
+ + + ++ + + + ++ + +++++++
D 0 0 00 0 0 • , 0 0 , 0 v v v ++ + +
+ + +
f . + +
4 + 1 1 0 0 00 0 00 0 0 000A
÷ • + + + 0 0 0
4 1 1 + 0 0 0
/ / / / / / / / / / /
..../../.... 0 0 00 0 0000+++++ + 4 ++ / / / / / / / / / /000
0.0/.0.0/../0/0000 0 0 +++++
+ + + +
++++ 0.0//0//0//
.../.../..//... 0000 00+4+++1+ 14 / / / / / / / / / /
//////////000000 4.. 4 ++++++
+ 1 + • / / / / / • / / / / / o o
Relative
Application
100%
85%
+ + 465%
45%
/ / / / / / / / / / //// //// / / e•//////// ////////// • ///////•// ////////// ////////// ////////// //////////0 0 0 0 0 0
000
^ ^ V v V
V
VVVV V
,^
V00V00V,00
0 0 0
•I • + * + + + + 4 +
+ + + + + + + + + ++ ++ ++ ++ + + + + + + + + + + + + + +
r
+++++++++
+ 4. 4 +
0 0 0
g 0 00 0 00 0 1. + + 4 + 4 + + + . 0 0 0
A
++ + 1 + + + + ++++4+++++
1 0° 0 0° 0 g 01.000000
n n n
n - n - n -
1
.. , .. , , , , ,////////// 'Or
r •-• '—' '-' //////////0 0 0 a /////////• —0
0 0 ////////// 0 0 00 0 0 ///////////////////,
O°0°0
°////////// //////////
0 0 0 //////////
4
++++++++
..4f
+ . 4.
f4 f 4. f
+
• 4 4. 4.
+
4 4 4 4. 4 4.,
or
40•••
••
A•••„•,
/
,
, , , , , , , , , ,
, , ,,,, , ,,,,
, , , „,, , , „,,
, /////// , , ,
,',. , ,,
, , , „
////„
/// 'c>"' C)C) Figure 6. Target nitrogen application map for chemigationtest three.
. .
50 60
5.95 mm (#30) 7.14 mm (#36) 8.73 mm (#44)
20 30 40
Theoretical flow rate (Umin)
--- 40-a)
ct
▪ s 0
• 20-v)
ca
0
2
60
50—
30—
10—
0 0
Figure 8. Comparison of measured versus theoretical sprinkler flow rate.
100% 1 —e-- 95% —e— 84% --44— 68% —.e.— 52% —5-- 41%
—.7— 36%