www.ann-geophys.net/24/2519/2006/ © European Geosciences Union 2006
Annales
Geophysicae
Simulations of the neutral structure within the dusk side aurora
H. F. Parish and L. R. Lyons
Department of Atmospheric and Oceanic Sciences, University of California Los Angeles, 405, Hilgard Avenue, Los Angeles, CA 90095-1565, USA
Received: 28 April 2006 – Accepted: 1 September 2006 – Published: 20 October 2006
Abstract. Observations of neutral winds from rocket release
experiments within the premidnight and postmidnight sub-storm recovery phase aurora, show very large E-region neu-tral winds of several hundred m/s, where winds measured on the dusk side are even larger than those on the dawn side. These large winds are also associated with strong shears, and there is evidence that some of the regions below these shears may be unstable. The mechanisms which generate this strong vertical structure are not well understood. It is also not known whether the acceleration conditions in the pre and post midnight sectors of the aurora may produce significantly different neutral responses on the dawn and dusk sides. Sim-ulations have been performed using a three-dimensional high resolution limited area thermosphere model to try to under-stand the neutral structure within the dawn and dusk side au-rora. When simulations are performed using auroral forcing alone, for equivalent conditions within the dawn and dusk sectors, differences are found in the simulated response on each side. When measured values of auroral forcing pa-rameters, and background winds and tides consistent with recent observations, are used as model inputs, some of the main features of the zonal and meridional wind observations are reproduced in the simulations, but the magnitude of the peak zonal wind around 140 km tends to be too small and the maximum meridional wind around 130 km is overestimated. The winds above 120 km altitude are found to be sensitive to changes in electric fields and ion densities, as was the case for the dawn side, but the effects of background winds and tides on the magnitudes of the winds above 120 km are found to be relatively small on the dusk side. The structure below 120 km appears to be related mainly to background winds and tides rather than auroral forcing, as was found in ear-lier studies on the dawn side, although the peak magnitudes of simulated wind variations in the 100 to 120 km altitude Correspondence to: H. F. Parish
range are smaller than those observed. The source of the strong shears measured around 110 km altitude on the dusk side is uncertain, but may be related to different kinds of os-cillations, such as gravity waves, non migrating semidiurnal tides, or secondary oscillations produced by non linear inter-actions between waves.
Keywords. Atmospheric composition and structure
(Air-glow and aurora) – Meteorology and atmospheric dynamics (Thermospheric dynamics; Waves and tides)
1 Introduction
1975). Observations (Larsen et al., 1997) and simulations (Parish et al., 2003), suggest that the shears below the wind maxima in the postmidnight sector may sometimes unstable, with Richardson number less than 0.25, which could cause enhanced eddy diffusion, generate waves, or cause large lo-calized composition changes (Christensen et al., 1997).
The winds on the premidnight side are found to be as large or even larger than those on the postmidnight side. The largest winds observed on the dawn side during the ARIA campaigns were around 220 m/s, occurring during the ARIA II campaign, for an interval of average Kp between 4 and 5 (Larsen et al., 1997). The peak wind velocites for the different dawn side campaigns are found to show some de-pendence on geomagnetic activity level. However, the pre-midnight measurements of Mikkelsen et al. (1981), obtained during an interval with Kp between 3.5 and 5.5, show max-imum wind velocities around 350 to 400 m/s, which are al-most twice as large as the maximum winds seen on the post-midnight side. The maximum velocities on the dusk side occur at around 130 to 140 km altitude, which is higher in altitude than the largest peaks observed on the dawn side, which occur around 110 to 120 km altitude, although smaller maxima of around 100 to 150 m/s, and associated shears, are seen on the dusk side around 110 km altitude. On the dawn side, the winds around 130 to 140 km altitude are generally very small, with the exception of the ARIA II measurements, where winds of around 200 m/s are seen between 130 and 140 km altitude, above the main wind maximum. The avail-able measurements therefore suggest that the wind structure on the dusk side may have significantly different characteris-tics from those on the dawn side.
It is unknown whether larger winds are consistently pro-duced in the premidnight rather than the postmidnight sec-tor. The conditions for accelerating winds on the dusk side may be different from those on the dawn side. On the dawn side Coriolis coupling of the zonal wind, and curvature ac-celeration, tend to act in the same direction, enhancing equa-torwards flow across the aurora, but on the dusk side Cori-olis tends to direct the flow towards the polar cap, oppos-ing the effects of curvature, and reducoppos-ing cross auroral flow. Also, changes in the interplanetary magnetic field (IMF) di-rection may affect the orientation of the high latitude convec-tion relative to the background wind field differently in the dusk and dawn sectors (Parish et al., 2006; Weimer, 2001, 1996, 1995), and since the flow in the auroral oval is sensi-tive to the magnitude of the cross arc winds (see e.g. Parish et al., 2003, 2006; Walterscheid and Lyons, 1989; Fuller-Rowell, 1985), changes in IMF may reduce or enhance flow on the dusk side, compared with the dawn side. There are currently very few observations of E-region neutral winds within the premidnight aurora, especially with the high ver-tical resolution given by rocket release experiments, which are able to show the presence of structures with small verti-cal sverti-cale sizes. Small sverti-cale phenomena have been found to be very important, e.g. the effects of large scale averages of
parameters can be quite different from the combined effects of smaller individual peaks in the same parameters (Fuller-Rowell, 1984), so it is important to try to understand the dusk side observations that are available.
Previous two-dimensional (2-D) high resolution models have been used to simulate small scale phenomema and neu-tral winds in the auroral zone (Fuller-Rowell, 1984; St. Mau-rice and Schunk, 1981; Richmond and Matsushita, 1975). Some 2-D simulations suggested that very large and even su-personic winds could be generated in the auroral zone un-der certain circumstances (Walterscheid et al., 1985; Fuller-Rowell, 1985; Lyons and Walterscheid, 1985; Walterscheid and Lyons, 1989). However, 2-D latitude versus height mod-els may not represent zonally varying phenomena well. More recent 2-D simulations of the dawn sector diffuse aurora used measured auroral parameters from the ARIA I campaign as model inputs, and compared the resulting simulated winds with observed winds from the same campaign (Brinkman et al., 1995). Whilst there was some agreement with the obser-vations, the strong wind structure and wind magnitudes were not well reproduced. Simulations of the winds produced dur-ing the ARIA I campaign usdur-ing a spectral general circulation model (Larsen et al., 1995), generated the characteristics of the observations above 140 km, but the strength of the verti-cal structure in the E-region was not well reproduced. Sim-ulations of winds generated within the dusk side aurora dur-ing the campaign of 28 February 1978, usdur-ing the same spec-tral model (Mikkelsen and Larsen, 1993) reproduced some of the main features of the observations, although the simulated wind vectors were rotated relative to the observations, and E-region maxima were too high in altitude. They suggested that the neutral response may be sensitive to the detailed longer term time history of Lorentz forcing and Joule heating.
wind structure were generated, although the great strengths of the shears between 110 and 120 km altitude were not well reproduced.
In this study, dawn versus dusk differences in the neu-tral response are examined, and measurements from the dusk side campaign are analysed to give values for electric fields and ion densities over the period of the observations. The sensitivity of the neutral response to changes in the electric field and ion density, as well as changes in tidal forcing pa-rameters in the background winds, has been determined, and the relative importance of different forcing mechanisms has been examined.
2 The model
The simulations described here were performed using a three-dimensional, high resolution, limited area, composi-tion dependent, non hydrostatic model, described in Parish et al. (2003). The neutral response to auroral forcing is de-pendent on the ion drag terms in the momentum equations and the Joule heating terms in the energy equation, and the auroral forcing is adjusted by modifying the structure and magnitude of the simulated electric field and ion density. The simulated electric field is directed equatorward in the dawn sector, and poleward in the dusk sector, is assumed to have a Gaussian horizontal structure, and is assumed to be con-stant as a function of height. The background ion density is based on the Chiu (1975) empirical model (where the Chiu model is used rather than newer models for simplicity, as the background ion densities are generally small relative to the density enhancements in the E-region).
In the initial runs described here, which do not use spe-cific observational inputs for the auroral forcing parameters, an enhancement to the background ion density is introduced, which is based on the electron density profile given by Wal-terscheid and Lyons (1989), using the hard energy spectrum of Lyons and Fennell (1986), with a maximum value around 8×10¹¹m−3at 110 km altitude. The horizontal structure of the ion density enhancement is assumed to have a Gaussian distribution. The magnetic field is directed downward with a constant value of 5×10⁻⁵T. The model domain is centered at 65 degrees magnetic latitude, and the cross auroral direction is taken to lie along a magnetic meridian. The extent of the computational domain and aurora can be varied, and in these simulations the domain is specified as a region with vertical extent between 86 km and 451 km altitude, and horizontal di-mensions 7140 km east-west and 3150 km north-south. The aurora itself has dimensions 3400 km east-west and 300 km north-south, centered at 65 degrees north. Auroral forcing is introduced gradually over a time interval of 5 min and main-tained for simulation times of 1 to 3 h. Global background winds are given by the 3-D CTIP (Coupled Thermosphere Ionosphere Plasmasphere) model (Bailey et al., 1997; Fuller-Rowell et al., 1987). The CTIP model includes different
propagating diurnal and semidiurnal tides, assumed to prop-agate up from the troposphere and stratosphere. Large scale winds from the CTIP model are rotated into magnetic coor-dinates and interpolated onto all the grid points of the high resolution model, to give the background winds and tides in the region of the aurora.
3 Simulations with auroral forcing only
Model runs were performed for equivalent conditions in the premidnight and postmidnight sectors of the aurora to de-termine any differences in the neutral response. The same ion density enhancement was applied on the dawn and dusk sides, with maximum 8×10¹¹m−3at 105 km altitude, where the background ionosphere was provided by the Chiu model. The electric field maximum was 50 mV/m, equatorward on the dawn side, poleward on the dusk side. The simulations were run for 2 simulated hours. In these examples auroral forcing only was applied, with no background winds.
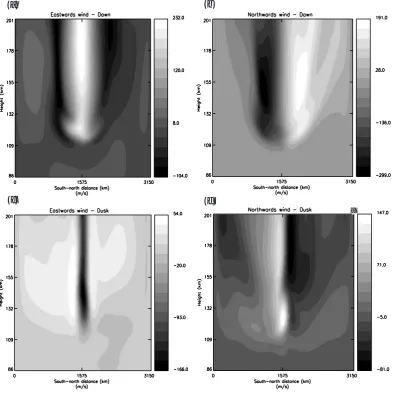
Figure 1 shows contours of the eastwards and northwards winds versus south-north distance and height, produced by dawn and dusk side simulations, plotted at the center of the longitudinal domain. There are large westwards winds on the dusk side and large eastwards winds on the dawn side, consistent with the opposite direction of the electric field on each side, which affects the direction of the ion convection and the ion drag driven neutral winds. Zonal wind magni-tudes show a single peak around 170 m/s at 140 km altitude on the dusk side, and a peak around the same magnitude at 120 km on the dawn side, with slightly larger winds at higher altitudes on the dawn side. The meridional winds show large northwards and southwards magnitudes, of 150 to 200 m/s, in opposite directions on the dawn and dusk sides. The wind pattern converges into a smaller latitudinal cross section in the dusk sector, due to reduced cross auroral flow on the dusk side compared with the dawn side, as discussed above.
_
(a) (b)
[image:4.595.102.498.64.458.2](c) (d)
Fig. 1. Contours of simulated neutral winds versus south-north distance and height, plotted at the center of the longitudinal domain, for
equivalent conditions on the dawn and dusk sides.
4 Comparison with observations
Measurements of ion densities and electric fields from the dusk campaign of 28 February 1978 were used to provide auroral forcing parameters for the model simulations, so that the results of the model simulations could be compared with the observations of the meridional and zonal winds made dur-ing the same campaign, in order to determine the processes which generate the observed neutral wind response.
4.1 Dusk side masurements
Simultaneous rocket, ground based and satellite measure-ments, were made within the premidnight recovery phase au-rora, at Poker Flat, Alaska (65.1 N, 212.5 E geographic), dur-ing February and March 1978 (Mikkelsen et al., 1981). The measurements made on 28 February 1978, show winds of
350 to 400 m/s around 130 km altitude and strong shears (see Fig. 1 of Mikkelsen et al., 1981). Wind profiles with simi-lar structures and simi-large magnitudes were also seen two days later on 2 March 1978 (Mikkelsen et al., 1981). The winds on both days are even larger than those observed within the postmidnight aurora during the ARIA campaigns (Larsen et al., 1995, 1997), and may represent conditions which occur regularly with the region of the dusk side aurora. It is not known whether even larger winds may be consistently pro-duced in the premidnight rather than the postmidnight sides of the aurora, but the results of simulations shown in Fig. 2 suggest that auroral forcing alone, of the same magnitude on the dawn and dusk sides, does not generate larger winds on the dusk side.
Eastwards Northwards
Eastwards Northwards
(a) (b)
-_
-_
Fig. 2. Profiles of the simulated eastwards and northwards winds versus height, plotted at the center of the latitudinal and longitudinal
domains, for equivalent conditions on the dawn and dusk sides (a) dawn side (b) dusk side.
launched into the recovery phase aurora at 04:20 UT. The rocket releases were oriented close to magnetic north, with an apogee 300 km, and impact 350 km downrange. Upleg (southern trails) and downleg (northern trail) trimethyl alu-minate (TMA) releases were carried by the rocket, as well as barium cannisters. TMA trails allowed neutral winds to be measured between 80–180 km, barium releases measured neutral winds at 200 km and 280 km, and barium drifts al-lowed electric fields to be estimated. The Chatanika inco-herent scatter radar (3 km south of Poker Flat) was operating prior to, during and after the rocket flights, and scanned north along a magnetic meridian, giving plasma densities from 80 to 450 km. Electric fields were estimated from ion drift measurements at 115 and 165 km altitudes. Defense Mete-orological Satellite Program (DMSP) satellite photographs indicated the presence of a weak continuous visual aurora throughout the observing period. The geomagnetic activity was between around Kp 3.5 and 5.5 throughout the observing period. Measurements during this period (Mikkelsen et al., 1981) suggest that there may have been mainly discrete au-rora over the period of the observations, but from the point of view of the simulations, only precipitating energy flux mat-ters, not whether it comes from discrete or diffuse aurora (we do not include the small spatial-scale ion density enhance-ments that comprise the discrete aurora and we also do not include the small spatial scale electric field structures associ-ated with the discrete aurora).
4.2 Simulations without background winds
The Chatanika observations for 28 February 1978, were used to determine ion density and electric field structures over
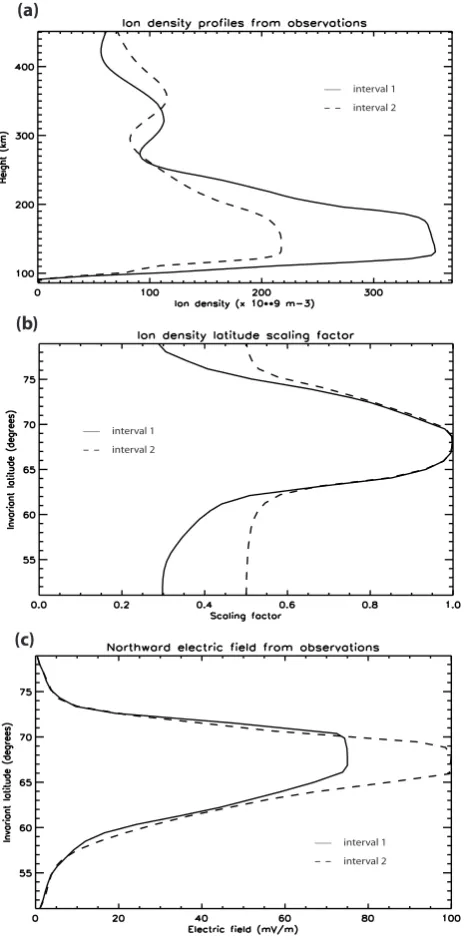
the observing period. To describe the changing auroral in-puts over time, ion density and electric field structures were defined for two different time intervals leading up to and including the rocket launch at 04:20 UT, i.e. from 02:40 to 03:30 UT, and from 03:30 to 04:20 UT. The ion sity profiles, the latitudinal scaling factors for the ion den-sities, and the electric field latitudinal structures, are shown in Figs. 3a, b and c, respectively, for each interval, where the maximum electric field measured on the dusk side was around three times as large as that for the dawn side during the ARIA I campaign (see Mikkelsen et al., 1981; Brinkman et al., 1995). Simulations were performed using the speci-fied ion density and electric field structures to provide auro-ral forcing inputs for the period of the observations, without any background winds. The results of the simulations for locations corresponding to the southern and northern trails are compared with the observations in Figs. 4a and b, and Figs. 5a and b, respectively.
[image:5.595.101.496.66.279.2](a)
(b)
(c)
___ interval 1 interval 2 ___ interval 1
interval 2
___ interval 1 interval 2
-Fig. 3. Ion density and electic field structures used in the
simula-tions, for the first and second intervals, inferred from the 28 Febru-ary observations (a) ion density profile (b) latitude scaling factor for the ion density (c) northwards electric field.
larger in magnitude and lower in altitude than the observed maximum, for both the northern and southern trails. Very lit-tle wind structure is seen in the simulated meridional wind below around 120 km, where a significant southwards wind shear is observed around 110 km altitude.
4.3 Effects of background winds and tides
In Parish et al. (2003, 2006), we found that background winds and propagating tides have important effects on neu-tral winds within the dawn side of the aurora, and tend to improve the simulated wind structure in comparison with ob-servations. We have introduced background winds and tides from the CTIP (Coupled Thermosphere Ionosphere Plasma-sphere) model, appropriate for 28 February 1978. In this case, low geomagnetic activity was specified for the back-ground wind field, to reduce any potential auroral forcing influence from within the background winds. It was found in Parish et al. (2003, 2006), that higher order semidiurnal tidal modes such as the (2,5) and (2,6) modes, which have rel-atively short vertical wavelengths, consistent with the short vertical scale lengths in the observations, produced the best agreement with the observed structures. These higher or-der semidiurnal tidal modes were included in the background winds, and in the examples shown here, the (2,6) propagat-ing tidal mode was included, with geopotential height am-plitude 300 m and phase 05:00 LT, where propagating tides are forced at the lower boundary of the CTIP model at 80 km altitude. The results are shown in Figs. 4c and d, and 5c and d for the southern and northern trails, respectively.
When background winds are introduced, some vertical structure is seen below 120 km in the meridional and zonal winds in both the northern and southern trails. The zonal wind is still smaller than that observed, and the westwards peak around 140 km altitude is reduced slightly in magni-tude, by around 50 m/s. There is a large maximum in the meridional wind around 125 km altitude, in the northwards direction, which is increased in magnitude by around 50 m/s, and magnitudes are also slightly increased above 160 km al-titude, where they become slightly closer to those observed. With background winds and tides present, an eastwards peak appears around 105 km altitude, although this is smaller and lower in altitude than the observed peak around 115 km. There is evidence of small maxima and minima in the merid-ional wind below 120 km, in the same direction as the ob-served peaks, but these are much smaller than those mea-sured. The addition of background winds with the observed tidal amplitude and phases for the (2,6) tidal mode, there-fore produces more vertical structure below 120 km, which is consistent with that observed, but smaller in magnitude. The vertical structure above 120 km does not appear to be significantly improved by the addition of background winds.
5 Sensitivity studies
[image:6.595.52.285.63.535.2]H. F. Parish and L. R. Lyons: Simulations of the neutral structure within the dusk side aurora 2525
(a) (b)
(c) (d)
__
---Simulation Observations
__
---Simulation Observations
__
---Simulation Observations
__
---Simulation Observations
____ ____ ____
____ ____
____ ____ ____
I I I I
I I I I
I I
I I
[image:7.595.99.496.65.498.2]I I I I
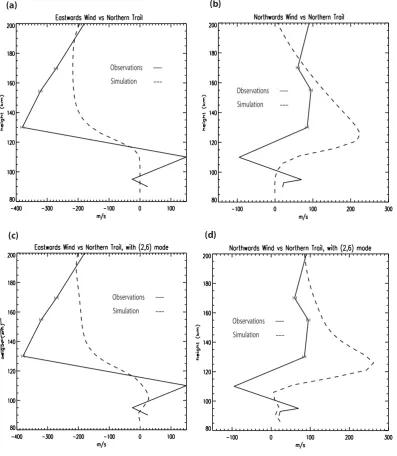
Fig. 4. Wind profiles simulated using ion densities and electric fields based on the 28 February dusk side campaign measurements. Results
are compared with the southern trail winds observed during the same campaign. (a) and (b) response with no background winds (c) and (d) response with background winds including the (2,6) mode, amplitude 300 m, phase 5.0 h.
effects of changes in the background winds, and changes in the electric field and ion density magnitudes and structures. The same (2,6) tidal mode has been included in the back-ground winds in these examples, with varying amplitude and phase. The electric field and ion density structures are based on the values measured during the 28 February campaign, with background ion densities provided by the Chiu empiri-cal model.
5.1 Variations in tidal amplitude and phase
Since propagating tides are known to be variable (e.g. Pancheva et al., 2000; Beard et al., 1999; Canziani, 1994;
Phillips and Briggs, 1991) and tidal parameters at a given time and location are not well known unless measured di-rectly, the amplitudes and phases of the propagating tides in the background winds were varied.
5.1.1 Amplitude variation
(a) (b)
(c) (d)
__
---Simulation Observations
__
---Simulation Observations
__
---Simulation Observations
__
---Simulation Observations
_ I
_ _
_
_
_
_
_ _ _
_
_
_
I I
I I
I I
I I
I I
I I
I I
I I
I I
I I
I I
[image:8.595.101.499.63.520.2]I I
Fig. 5. As Fig. 4, but for northern trail observations.
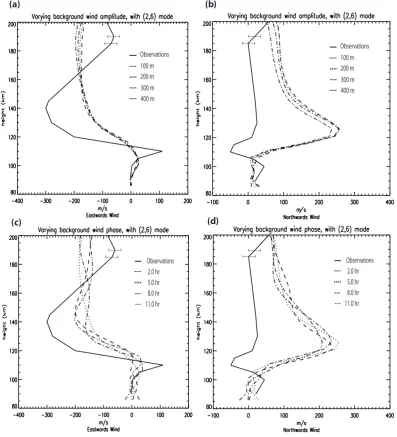
between 100 m and 400 m geopotential height, where the range of tidal amplitudes is consistent with recent measure-ments (e.g. Hecht et al., 1998; Karpov, 1996; Dao et al., 1995), and with values found to produced reasonable agree-ment with observations on the dawn side (Parish et al., 2003, 2006). The simulated winds are compared with the mea-surements. Changing the amplitude of the (2,6) model has a relatively small effect on the zonal wind magnitude, with increases of up to around 30 to 40 m/s, in the westwards di-rection above 160 km, and slight decreases around 140 km, as the amplitude of the tidal variation is increased. The north-wards wind tends to decrease at all heights, as the tidal am-plitude is increased, up to around 40 m/s. The altitudes of all
(a) (b)
(c) (d)
---....
- -.
11.0 hr 2.0 hr 5.0 hr 8.0 hr
_
Observations- -..
---....
- -.
11.0 hr 2.0 hr 5.0 hr 8.0 hr
_
Observations- -..
300 m 100 m 200 m
---....
_
- -.
Observations
- -.. 400 m
300 m 100 m 200 m
---....
_
- -.
Observations
- -.. 400 m
____ ____ ____
____
________ ____
____
I I I I
I I
I I I
I
I I I
I I
I
Fig. 6. (a) and (b) response of the neutral winds to changes in the amplitude of the (2,6) tidal mode in the background winds, (c) and (d) response of the neutral winds to changes in the phase of the (2,6) tidal mode in the background winds. Results are compared with the
southern trail 28 February dusk side observations.
5.1.2 Phase variation
Figures 6c and d, and 7c and d, show the effects of chang-ing the phase of the the (2,6) tidal mode within the back-ground winds, whilst keeping the tidal amplitude constant, at 300 m, using auroral forcing parameters based on obser-vations, as the phase is varied from 02:00 to 11:00 LT, in steps of 3.0 h. The simulated peaks in the northwards and westwards winds show differences in altitude of 10 to 15 km, as well as changes in magnitude of up to 50 to 60 m/s, as the phase is modified, and a clear westwards maximum close to 140 km appears around the same height as that observed,
[image:9.595.99.497.64.502.2](a) (b)
(c) (d)
300 m 100 m 200 m
---....
_
- -.
Observations
- -.. 400 m
300 m 100 m 200 m
---....
_
- -.
Observations
- -.. 400 m
---....
- -.
11.0 hr 2.0 hr 5.0 hr 8.0 hr
_
Observations- -..
---....
- -.
11.0 hr 2.0 hr 5.0 hr 8.0 hr
_
Observations- -..
I
_
_ _
_
I I I I
I I
_ _ _
_
_
_ _
_ _
I I I I
I I
I I I I I I
I I
I I
[image:10.595.104.495.61.526.2]I I
Fig. 7. As Fig. 6, but for the northern trail 28 February dusk side observations.
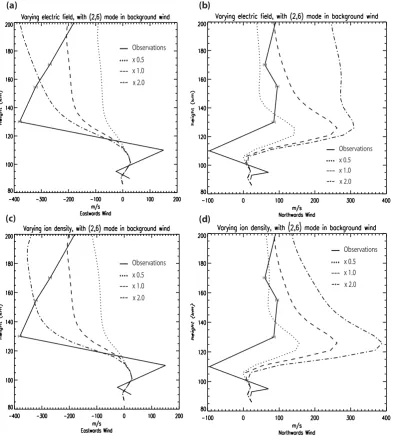
5.2 Effects of changes in electric field and ion density The effects of changing the electric field and ion density magnitudes and structures with background winds present, were also investigated, In these examples the background wind included the (2,6) tidal mode, with amplitude 300 m and phase 5.0 h.
5.2.1 Electric field variations
The effects of changing the magnitude of the electric field whilst keeping the original ion density the same in the pres-ence of background winds and tides, are shown in Figs. 8a
(a)
(c) (d)
(b)
x 2.0 x 0.5 x 1.0
---....
_
- -.
Observations
x 2.0 x 0.5 x 1.0
---....
_
- -.
Observations
x 2.0 x 0.5 x 1.0
---....
_
- -.
Observations
x 2.0 x 0.5 x 1.0
---....
_
- -.
Observations
____ ____
____ ____
I I I I
I I I
I ____
____ ____ ____
I I I I I
I I
I
Fig. 8. (a) and (b) response of the neutral winds to varying electric field magnitude, with the (2,6) tidal mode in the background winds, (c)
and (d) response of the neutral winds to varying ion density enhancement, with the (2,6) tidal mode in the background winds. The southern trail 28 February observations are included for comparison.
around 130 to 140 km, comparable to that found in the ob-servations. For the meridional wind, the northwards maxi-mum around 125 to 130 km altitude is significantly increased by 50 to 100 m/s as the electric field magnitude is increased. The small eastwards maximum around 105 km altitude is not noticeably affected by changes in the electric field, and the structure around 105 km in the meridional wind is changed by only 10 to 20 m/s as the electric field is modified, and the strong shears observed around 110 km are not simulated for an increased electric field.
5.2.2 Ion density variations
[image:11.595.99.498.65.519.2]x 2.0 x 0.5 x 1.0
---....
_
- -.
Observations
x 2.0 x 0.5 x 1.0
---....
_
- -.
Observations
x 2.0 x 0.5 x 1.0
---....
_
- -.
Observations
x 2.0 x 0.5 x 1.0
---....
_
- -.
Observations
(a) (b)
(c) (d)
_
I
_ _
_
_ _ _
I I I I
I I
I I I I I I
I I
I I
I I I I
I I
I I_
_
_ _
_
[image:12.595.103.497.63.510.2]_
Fig. 9. As Fig. 8, but for the northern trail 28 February observations.
close to those observed near the magnitude peak around 140 km, although there is no clear maximum in the westward wind around 130 to 140 km altitude. The northward peak around 125 km is increased 10 to 20% more for the ion den-sity increases compared with the electric field increases, and the maximum around 125 km is still too large. Changes in the ion density have little effect on the zonal wind below 100 km altitude, and have only small effects around 20 to 30 m/s on the meridional wind below 110 km, and do not produce the observed strong maximum around 110 km.
6 Conclusions
wind maxima occur at higher altitudes on the dusk side, the shears underneath the maxima are weaker on the dusk side, the maximum meridional wind is larger on the dusk side, and the wind structure appears to be more confined in lat-itude on the dusk side, where differences are related to the different balance of forces on the dawn and dusk sides, dis-cussed above, the narrower region of heating and accelera-tion on the dusk side, and the 3-D circulaaccelera-tion. However, the zonal winds around 130 to 140 km altitude do not appear to be larger on the dusk side than the dawn side, for comparable auroral forcing magnitudes.
When simulations are performed using ion density and electric field structures inferred from the 28 February dusk side measurements, without background winds, the simu-lated zonal wind shows some of the features of the mea-sured winds, but the magnitude of the westwards maximum is smaller than that measured, and the simulated northwards wind peak around 125 km is larger than observed. Very little structure is seen below 120 km altitude. When background winds including the higher order semidiurnal (2,6) propagat-ing tidal mode are used in the simulations, with tidal forc-ing magnitudes consistent with recent observations, and with auroral forcing based on the 28 February dusk side mea-surements, more structure is seen below 120 km, and small maxima and minima appear below 120 km in the same di-rections as those observed. The simulated structure above 120 km is also modified. However, the westwards wind mag-nitude around 130 to 140 km altitude is still significantly too small, and the northwards wind peak around 125 km is still too large, and the overall structure is not greatly improved in comparison with observations by the addition of background winds and tides. The assumption of low geomagnetic activ-ity in the background wind field outside the auroral zone, to reduce any possible auroral influence from the background winds, could have effects on the simulated wind profiles, and the sensitivity to changes in activity levels in the background winds will be determined in future simulations. Sensitivity studies show that varying the amplitude of the tidal variations in the background winds affects the magnitudes of the peaks, and varying the tidal phase alters the magnitudes and heights of the peaks at all altitudes, but does not significantly im-prove the general height structure of the winds above 120 km in comparison with observations. The simulated response with background winds included, is found to be sensitive to the magnitudes of the electric field and ion density enhance-ment. Enhancing the electric field or the ion density can in-crease the magnitude of the large zonal wind peak around 140 km to values comparable with those observed, although in order to reproduce the observed strong zonal winds, val-ues of electric field or ion density larger than those observed are needed. Increasing the electric field or ion density also tends to enhance the northwards peak around 125 km, to val-ues which are considerably larger than those observed. How-ever, the neutral response may also be sensitive to the longer time history of the auroral forcing (Mikkelsen and Larsen,
1993), and the effects of the longer term history may also be taken into account in future simulations, where observations are available.
The structure below 120 km appears to be related to back-ground winds and tides rather than auroral forcing, as was found to be the case on the dawn side (Parish et al., 2006). However, shears as large as those observed are not repro-duced around 110 km, for any values of tidal forcing param-eters in the background wind field. This suggests that there may be other processes involved in producing the neutral variations that are not currently simulated. As suggested for simulations on the dawn side, these might involve unmod-eled sub grid scale structures in the background winds, or might be related to the presence of other kinds of waves e.g. gravity waves, non-migrating semidiurnal tides (Portnyagin et al., 1998; Forbes et al., 1995), or waves generated by non-linear interactions between existing waves (e.g. Pancheva et al., 2004; Isler and Fritts, 1996; Forbes et al., 1991), which are not currently included in simulations.
Acknowledgements. This work was supported by grant
ATM-0242292 from the National Science Foundation.
Topical Editor U.-P. Hoppe thanks I. McCrea and D. Winning-ham for their help in evaluating this paper.
References
Anderson, P. C., Christensen, A. B., Sharber, J. R., et al.: The ARIA I Rocket Campaign, J. Geophys. Res., 100, 17 265–17 284, 1995. Bailey, G. J., Balan, N., and Su, Y. Z.: The Sheffield University plasmasphere ionosphere model – a review, J. Atmos. Solar-Terr. Phys., 59, 1541–1552, 1997.
Beard, A. G., Mitchell, N. J., Williams, P. J. S., and Kunitake, M.: Non-linear interactions between tides and planetary waves result-ing in periodic tidal variability, J. Atmos. Solar-Terr. Phys., 61, 363–376, 1999.
Brinkman, D. G., Walterscheid, R. L., Lyons, L. R., et al.: E-region Neutral Winds in the Postmidnight Diffuse Aurora During the Atmospheric Response in Aurora I Rocket Campaign, J. Geo-phys. Res., 100, 17 309–17 320, 1995.
Canziani, P. O.: On Tidal Variability and the Existence of Planetary Wave-Like Oscillations in the Upper Thermosphere. 1. Obser-vations of Tidal Variability, J. Atmos. Terr. Phys., 56, 901–912, 1994.
Chiu, Y. T.: An improved Phenomenological Model of Ionospheric Density, J. Atmos. Terr. Phys., 37, 1563–1570, 1975.
Christensen, A. B., Hecht, J. H., and Walterscheid, R. L.: Deple-tion of Oxygen in Aurora: Evidence for a Local Mechanism, J. Geophys. Res., 102, 22 273–22 278, 1997.
Dao, P. D., Farley, R., Tao, X., and Gardner, C. S.: Lidar Obser-vations of the Temperature Profile Between 25 and 103 km – Evidence of Strong Tidal Perturbation, Geophys. Res. Lett., 22, 2825–2828, 1995.
Forbes, J. M., Jun, G., and Miyahara, S.: On the interactions be-tween Gravity-Waves and the Diurnal Propagating Tide, Plan. Space Sci., 39, 1249–1257, 1991.
with zonal wavenumber one Geophys. Res. Lett., 22, 3247–3250, 1995.
Fuller-Rowell, T. J.: A Two-Dimensional, High Resolution, Nested-Grid Model of the Thermosphere 1. Neutral Response to an Elec-tric Field “Spike”, J. Geophys. Res., 89, 2971–2990, 1984. Fuller-Rowell, T. J.: A Two-Dimensional, High Resolution,
Nested-Grid Model of the Thermosphere 2. Response of the Thermo-sphere to Narrow and Broad Electrodynamic Features, J. Geo-phys. Res., 90, 6567–6586, 1985.
Fuller-Rowell, T. J., Rees, D., Quegan, S., Moffett, R. J., and Bailey, G. J.: Interactions with Neutral Thermospheric Composition and the Polar Ionosphere Using a Coupled Ionosphere-Thermosphere Model, J. Geophys. Res., 92, 7744–7748, 1987.
Hecht, J. H., Walterscheid, R. L., Roble, R. G., et al.: A com-parison of atmospheric tides inferred from observations at the mesopause during ALOHA-93 with the model predictions of the TIME-GCM, J. Geophys. Res., 103, 6307–6321, 1998. Isler, J. R. and Fritts, D.: Gravity wave variability and interaction
with lower-frequency motions in the mesosphere and lower ther-mosphere over Hawaii, J. Atmos. Sci., 53, 37–48, 1996. Karpov, I. V.: Mode Structure of Tides in the Lower Thermosphere
by Wind Measurements on UARS, Geomag. Aeron., 36, 202– 206, 1996.
Larsen, M. F., Mikkelsen, I. S., Meriwether, J. W., et al.: Simul-taneous Observations of Neutral Winds and Electric Fields at Spaced Locations in the Dawn Auroral Oval, J. Geophys. Res., 94, 17 235–17 243, 1989.
Larsen, M. F., Marshall, T. R., Mikkelsen, I. S., et al.: Atmospheric Response in Aurora Experiment: Observations of E and F Region Neutral Winds in a Region of Postmidnight Diffuse Aurora, J. Geophys. Res., 100, 17 299–17 308, 1995.
Larsen, M. F., Christensen, A. B., and Odom, C. D.: Observations of Unstable Atmospheric Shear Layers in the Lower E-region in the Postmidnight Auroral Oval, Geophys. Res. Lett., 24, 1915– 1918, 1997.
Lyons, L. R. and Walterscheid, R. L.: Generation of Auroral Omega Bands by Shear Instability of the Neutral Winds, J. Geophys. Res., 90, 12 321–12 329, 1985.
Lyons, L. R. and Fennell, J. F.: Characteristics of Auroral Electron Precipitation on the Morningside, J. Geophys. Res., 91, 11 225– 11 234, 1986.
Mikkelsen, I. S., Jorgensen, T. S., Kelley, M. C., et al.: Neutral Winds and Electric Fields in the Dusk Auroral Oval, 1. Measure-ments, J. Geophys. Res., 86, 1513–1524, 1981.
Mikkelsen, I. S. and Larsen, M. F.: Comparisons of Spectral Ther-mospheric General Circulation Model Simulations and E and F region Chemical Release Wind Observations, J. Geophys. Res., 98, 3693–3709, 1993.
Pancheva, D., Mukhtarov, P., Mitchell, N. J., Beard, A. G., and Muller, H. G.: A comparative study of winds and tidal variability in the mesosphere/lower-thermosphere region over Bulgaria and the UK, Ann. Geophys., 18, 1304–1315, 2000,
http://www.ann-geophys.net/18/1304/2000/.
Pancheva, D., Mitchell, N. J., Manson, A. H., et al.: Variability of the quasi-2-day wave observed in the MLT region during the PSMOS campaign of June–August 1999, J. Atmos. and Solar-Terr. Phys., 66, 539–565, 2004.
Parish, H. F., Gladstone, G. R., and Chakrabarti, S.: Interpretation of Satellite Airglow Observations During the March 22, 1979, Magnetic Storm, Using the Coupled Ionosphere-Thermosphere Model Developed at University College London, J. Geophys. Res., 99, 6155–6166, 1994.
Parish, H. F, Robinson, T. R., Stocker, A. J., and Jones, T. B.: Evi-dence of Gravity Wave Structures in CUTLASS Radar Measure-ments, Adv. Space Res., 20, 1257–1260, 1997.
Parish, H. F., Walterscheid, R. L., Jones, P. W., and Lyons, L. R.: Simulations of the Thermospheric Response to the Diffuse Au-rora Using a Three-Dimensional High Resolution Model, J. Geo-phys. Res., 108(A4), 1140, doi:10.1029/2002JA009610, 2003. Parish, H. F. and Lyons, L. R.: Sensitivity studies of the E region
neutral response to the postmidnight diffuse aurora, Ann. Geo-phys., 24, 1551–1565, 2006,
http://www.ann-geophys.net/24/1551/2006/.
Phillips, A. and Briggs, B. H.: The day-to-day Variability of Upper Atomsphere Tidal Winds and Dynamo Currents, J. Atmos. Terr. Phys., 53, 39–47, 1991.
Portnyagin, Y. I., Forbes, J. M., Makarov, N. A., Merzlyakov, E. G., and Palo, S.: The summertime 12-h wind oscillation with zonal wavenumber s = 1 in the lower thermosphere over the South Pole, Ann. Geophys., 16, 828–837, 1998,
http://www.ann-geophys.net/16/828/1998/.
Richmond, A. D. and Matsushita, S.: Thermospheric Response to a Magnetic Substorm, J. Geophys. Res., 80, 2839–2850, 1975. St.-Maurice, J.-P. and Schunk, R. W.: Ion-Neutral Momentum
Cou-pling Near Discrete High-Latitude Ionospheric Features, J. Geo-phys. Res., 80, 11 299–11 321, 1981.
Walterscheid, R. L. and Lyons, L. R.: The Neutral E-region Zonal WInds During Intense Postmidnight Diffuse Aurora: Response to Observed Particle Fluxes, J. Geophys. Res., 94, 3703–3712, 1989.
Walterscheid, R. L., Lyons, L. R., and Taylor, K. E.: The Perturbed Neutral Circulation in the Vicinity of a Symmetric Stable, J. Geo-phys. Res., 90, 12 235–12 248, 1985.
Weimer, D. R.: Models of High-Latitude Electric Potentials De-rived with a Least Error Fit of Spherical Harmonic Coefficients, J. Geophys. Res., 100, 19 595–19 608, 1995.
Weimer, D. R.: A Flexible, IMF Dependent Model of High-Latitude Electric Potentials Having Space Weather Applications, Geo-phys. Res. Lett., 23, 2549–2552, 1996.