R E S E A R C H
Open Access
Test-retest reliability of fMRI experiments
during robot-assisted active and passive
stepping
Lukas Jaeger
1,2,3*, Laura Marchal-Crespo
1,2, Peter Wolf
1,2, Robert Riener
1,2, Spyros Kollias
3and Lars Michels
3,4Abstract
Background:Brain activity has been shown to undergo cortical and sub-cortical functional reorganisation over the course of gait rehabilitation in patients suffering from a spinal cord injury or a stroke. These changes however, have not been completely elucidated by neuroimaging to date, mainly due to the scarcity of long-term, follow-up investigations. The magnetic resonance imaging (MRI) compatible stepper MARCOS was specifically developed to enable the investigation of the supraspinal adaptations in paretic patients undergoing gait-rehabilitation in a controlled and repeatable manner. In view of future clinical research, the present study aims at examining the test-retest reliability of functional MRI (fMRI) experiments using MARCOS.
Methods:The effect of repeated active and passive stepping movements on brain activity was investigated in 16 healthy participants from fMRI data collected in two separate imaging sessions six weeks apart. Root mean square errors (RMSE) were calculated for the metrics of motor performance. Regional overlap of brain activation between sessions, as well as an intra-class correlation coefficient (ICC) was computed from the single-subject and group activation maps for five regions of interest (ROI).
Results:Data from eight participants had to be excluded due to excessive head motion. Reliability of motor performance was higher during passive than active movements, as seen in 4.5- to 13-fold lower RMSE for passive movements. In contrast, ICC ranged from 0.48 to 0.72 during passive movements and from 0.77 to 0.85 during active movements. Regional overlap of activations was also higher during active than during passive movements.
Conclusion:These findings imply that an increased variability of motor performance during active movements of healthy participants may be associated with a stable neuronal activation pattern across repeated measurements. In contrast, a stable motor performance during passive movements may be accompanied by a confined reliability of brain activation across repeated measurements.
Keywords:fMRI, Test-retest, Reliability, Active, Passive, Stepping, Gait, Brain activation
Background
Exercises for functional gait rehabilitation, such as walk-ing on a treadmill or with the aid of a robotic gait orth-osis, have a major positive impact on restoration of walking in patients suffering from spinal cord injury or stroke. Previous studies investigating the effect of such functional gait-rehabilitation exercises on brain activity
indicate a promotional effect for supraspinal plasticity in the motor centres expected to be involved in locomotion [1, 2]. However, the quality of this neural plasticity and its underlying physiological mechanisms have not been characterised in detail mainly due to the lack of standar-dised experimental conditions for follow-up studies. Longitudinal interventional studies combining extensive gait rehabilitation with a standardised controlled and measurable motor paradigm of the lower limbs during imaging of the brain might further disentangle the effect of gait training on brain activation. Newton et al. presented a motor paradigm of the lower limbs to * Correspondence:[email protected]
Spyros Kollias and Lars Michels shared senior authorship.
1Department of Health Sciences and Technology, Sensory-Motor Systems
(SMS) Lab, ETH Zurich, ML G 59, Sonneggstrasse 3, 8092 Zurich, Switzerland
2Medical Faculty, University of Zurich, Zurich, Switzerland
Full list of author information is available at the end of the article
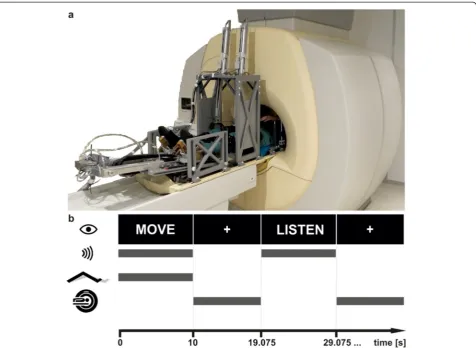
investigate brain activity during simultaneous control of static moments around the hip, knee and ankle joint in one leg [3]. However, over ground walking involves the control of a dynamic and bilateral anti-phasic simultan-eous movement of both legs under the transient influ-ence of ground reaction forces. The magnetic resonance (MR) compatible stepper MARCOS has been developed to deliver and monitor repeated gait-like stepping move-ments in a standardised manner across task-related functional magnetic resonance imaging (fMRI) experi-ments [4]. The robot facilitates active (i.e. produced by the participant), as well as passive movements (i.e. im-posed by the device). The investigation of passive move-ments can be meaningful in patients with no, or very limited, voluntary muscle activity in the legs as it is inde-pendent of performance ability, yet may be informative about the capacity for sensory adaptations to training [5]. Furthermore, the robot can impose loads against the soles of the feet along the cranio-caudal body axis mim-icking ground reaction forces during stepping, thereby activating load-sensitive receptors in the lower limbs.
When investigating brain activation during lower limb motor control repeatedly over the period of rehabilita-tive intervention, knowledge on the test-retest reliability of the data is indispensable as activated brain areas have been shown to undergo test-retest effects between re-peated imaging sessions [6]. In the context of inter-ventional studies, information on the stability of a measurement serves as the basis for differentiating true effects caused by a therapy from those caused by variations in the experimental conditions.
In functional brain imaging, measures of reliability can be either calculated from single subject activation maps, or from activation maps derived from random effects group analyses, depending on whether conclusions shall be formulated for an individual participant or for a rep-resentative group of participants that was drawn from a particular population. In the context of interventional studies both are desirable, the former to judge on the ef-fect of the intervention in a particular patient, the latter to generalise the findings of a study to a population.
A number of statistical tests have been proposed for judging the effects of repeated examination of brain acti-vation. In motor control fMRI experiments in both healthy participants and patients, planned comparisons of activation maps, percent of signal intensity change, intra-class correlation coefficient (ICC), voxel count, overlap of activations between repeated sessions, coeffi-cient of variation (CV) and the comparison of the loca-tion of the centre of gravity of activated clusters have been applied [3, 6–12]. Since all of these measures examine the retest-reliability of a given experiment from different perspectives, they have usually been combined to draw inferences.
An ICC, which is calculated from pairs of activation maps, appears to be the most appropriate measure of re-liability for fMRI-data, since it is calculated from the variance components of the imaging data and does not depend on the magnitude of activations [13]. It has be-come the most widely used metric of reliability in fMRI studies.
Imaging studies using ICC as a measure of reliability of fMRI motor control experiments report in general good repeatability (values are deemed excellent above 0.75, goodbetween 0.59 and 0.75,fair between 0.40 and 0.58 and poorfor values below 0.40 [14]). Newton et al. reported the results of their study of unilateral single-joint lower limb motor control in which ICC was calcu-lated from pairs of activation maps for two particular regions of interest (ROI). The voluntary production of torques led to individual ICC ranging from poor to ex-cellent across subjects both in the primary sensorimotor (S1M1) and premotor (Brodmann Area (BA) 6) cortex [3]. In a recent reliability study investigating active and passive flexion and extension of the elbow using an MR-compatible manipulandum, fair to excellent ICC for ac-tive and passive movements was estimated for all of the investigated ROIs [11]. However, the test-retest reliability of a given paradigm and hence its ICC depends on nu-merous parameters throughout data acquisition and ana-lysis, such as imaging hardware, resolution or spatial smoothing of the data (for a review see [15]). The com-parability of different studies of reliability is therefore limited, and test-retest reliability needs to be established for each particular paradigm.
In view of future robot-aided fMRI assessments in lon-gitudinal interventional studies, the aim of the present study was to assess the test-retest reliability of experi-ments using the robot MARCOS. The stability of motor performance and brain activation during the execution of two stepping conditions were investigated. Passive stepping without foot load and active stepping against a foot load of 40 % body weight were assumed to repre-sent the most reliable and the least reliable motor task respectively. The passive condition was expected to yield more reliable results than the active condition, since the passive condition is robot-driven by a strict position control algorithm, while in the active condition motor behaviour is controlled by the participant, and therefore more variable.
Methods
Stepping robot
arrangement of the cylinders allows for one-degree of freedom flexion and individual extension movements of each leg, and the resulting gait-like stepping movement in the sagittal plane resembles “marching-on-the-spot”. In addition, external loads of up to 400 N along the cranio-caudal body axis can be rendered to the soles of the feet of the participants during movements by the foot cylinders in order to simulate ground reaction forces. The desired load at the foot is inversely propor-tional to the vertical position of the knee, such that highest force levels occur at full extension of the leg. Each of the four actuators is equipped with position and force sensors enabling accurate measurement of move-ment kinematics and kinetics. Data is sampled and stored at 80 Hz for off-line analysis of motor and robot performance. The robot is governed by two PCs: the sensor evaluation CPU runs on Linux and communi-cates via Ethernet with the control CPU running Matlab xPC real-time target. The control CPU executes control
of the pneumatic valves as well as the control of the gait-pattern. Several redundant mechanisms were imple-mented in the robot to guarantee safety of the partici-pants: 1) mechanical end stops prevent non-physiological postures of the lower limbs, 2) cylinder positions are mea-sured, divergent positions cause the robot to shut down, 3) both CPUs are monitored by the control software and any error in the CPUs causes the robot to shut down, 4) watchdog circuits monitor the CPUs and the communica-tion, 5) the operator can shut down the robot through emergency stops, and 6) upon an emergency stop, all cy-linder chambers are set to atmospheric pressure and the cylinders can be moved freely.
A custom made hip and shoulder fixation as well as a custom made head bowl are combined with the inflat-able Crania pillow (www.pearltec.ch) to prevent exces-sive task-related motion of the upper body and the head. MARCOS was built from materials of low magnetic susceptibility (i.e. aluminium, brass, polyvinyl chloride).
MR-compatibility of the system was established by Hollnagel et al. [4].
Experimental procedure
Sixteen healthy participants were investigated during two separate sessions (t1 and t2) six weeks apart. The
chosen retest interval represents a common duration of rehabilitative gait interventions [17, 18], is in line with previous studies investigating the plasticity of brain ac-tivity in response to motor rehabilitation [1, 19] and cor-responds to previous studies assessing reliability of fMRI signals [6, 11]. Participants were eligible for inclusion in the study if they did not meet any of the following exclu-sion criteria: 1) diagnosed neurological, musculoskeletal or cardiac dysfunction at present or in the past, 2) cardiac pacemaker, neuro-stimulator or hearing aid and 3) drug-abuse. The study was approved by the Ethics Committee of the Canton of Zurich (approval Nr. 856) and was con-ducted in accordance with the guidelines for research in-volving human subjects as outlined by the Declaration of Helsinki. All participants were informed about the aims and procedures of the study and gave their written con-sent for participation.
All participants performed passive stepping without foot load (passive) and active stepping with a load of 40 % of individual body weight acting against the foot soles (active40) in both imaging sessions. The leg move-ments of the participants (i.e. range of motion, stepping cadence and interaction forces with the robot) were measured online by the robot during both sessions. Movement conditions were tested in random order in separate runs of functional image acquisition in a blocked design. Each functional run consisted of 15 blocks of movement, interleaved with 15 blocks of a control condition. Each block lasted 10 s and was followed by 9.075 s of image acquisition. Movement ca-dence during both conditions was set to 0.5 Hz by the presentation of a metronome through the earphones [20, 21], yielding five steps per leg in each trial. Although the cadence was imposed by the robot during passive move-ments, the metronome was also presented in this condi-tion, as well as during the control condicondi-tion, to match auditory stimulation. The control condition served two purposes: firstly as a reference condition against which brain activity during movement trials was compared and, secondly, to control for auditory activations elicited by listening to the metronome per se. Visual cues were projected onto a screen near the feet of the participants at the start and for the duration of each block. Participants could see the screen by means of a mirror mounted to
the head coil of the scanner. The word “MOVE” was
presented for movement trials, while“LISTEN”was pre-sented during control trials (Fig. 1b). As passive move-ments were imposed on the participants they were
instructed to relax the muscles of their lower limbs and to not voluntarily contribute to flexion and extension of their lower limbs. During active movements, partici-pants were instructed to voluntarily produce flexion and extension of their lower limbs in the rhythm set by the metronome. Under these conditions, the cylinders at-tached to the knees limited the range of motion and the cylinders attached to the feet rendered the desired foot loads as participants cycled through the steps. Further-more, participants were instructed to fixate on a white cross on the screen during image acquisition between the“MOVE” and“LISTEN” blocks and to not rehearse or imagine movement execution when listening to the metronome alone. Participants were familiarised with each movement condition before the start of the experi-ment and informed about the upcoming type of move-ment before the start of each functional run.
Image acquisition
Image acquisition from all participants was carried out on the same 1.5 T Philips Achieva scanner (Philips Med-ical Systems, Best, the Netherlands) at the University Hospital of Zurich using an 8-channel SENSETM head coil. The sparse sampling imaging protocol consisted of clusters of image acquisition interleaved with silent gaps of 10 s length [22]. Each imaging cluster comprised of three consecutive volumes (TR = 3.025 s). The duration between the onsets of two imaging clusters was hence 19.075 s. 93 volumes in 31 clusters of 3 volumes were acquired, using a whole brain T2*-weighted, single-shot, echo planar imaging (EPI) sequence (TE = 50 ms, flip angle = 90 °, SENSE factor = 1.6). 35 interleaved, angu-lated, transversal slices covering the whole brain were acquired in each volume (field of view = 220 mm × 220 mm, acquisition voxel size: 2.75 × 2.8 × 3.8 mm, resliced to 1.72 × 1.72 × 3.8 mm).
Data analysis
Motor performance
Three metrics of motor performance were calculated for both stepping conditions at t1 and t2: Knee amplitude
For each participant and condition, values were then averaged across all blocks. Data was further averaged over both legs, as foot load, knee amplitude and step-ping frequencyvalues of the left and the right leg were not significantly different (planned comparisons, all p-values > 0.1) in any of the conditions.
The left/right-averaged data of each performance metric of both sessions was then subject to an individual 2-way repeated measures ANOVA with the factors time
and condition. This allowed testing for significant differ-ences between time points and conditions. To test the hypothesis of no significant differences between t1and t2
in all of the performance metrics within each condition, additional planned comparisons were applied in case of a significant main effect of time. The significance level for all statistical tests of motor performance was set to α= 0.05.
To further assess reliability of repeated test sessions, the root mean squared error (RMSE) of differences be-tween t1 and t2 was calculated using the following
formula:
RMSE¼
ffiffiffiffiffiffiffiffiffiffiffiffiffiffiffiffiffiffiffiffiffiffiffiffiffiffiffiffiffi Xn
i¼1
x2;i−x1;i
2 n v u u u t ;
where n denotes the total number of measurements of the metric at each session (i.e., 15) andx1,i&x2,iare thei
-th pair of values of the measurements at t1and t2.The RMSE is an indicator of the absolute reliability. The ab-solute difference in measurements of the same metric repeated in two different sessions is expected to lie within 2.77*RMSE in 95 % of the measurements (normal distribution of the measurements is assumed, this was verified by means of visual inspection of Q-Q-plots) [23]. In other words, a true effect due to an intervention is likely if the difference between repeated measure-ments is higher than the RMSE multiplied by 2.77. Small RMSE values indicate low variability between measure-ments at t1 and t2. This indicator shall provide a prac-tical of reliability for users of the robot.In order to compare the foot load variability to data in the literature, the CV was calculated across repeated measurement ses-sions using the following formula for each individual:
CV ¼
ffiffiffiffiffiffiffiffiffiffiffiffiffiffiffiffiffiffiffiffiffiffiffiffiffiffiffiffiffiffiffiffiffiffi Xk
i¼1
SD2i ðni−1Þ
Xk
i¼1
ni−k
v u u u u u u u t = Xk
i¼1
meani k 0 B B B B B @ 1 C C C C C A 100;
where meani denotes the mean of measurement i, SDi
denotes the standard deviation of measurement i, ni
denotes the number of trials at measurementi, andk de-notes the total number of measurements.
Analysis of imaging data
All fMRI datasets were analysed using SPM8 (Wellcome Department of Cognitive Neurology, London, UK, www.fil.ion.ucl.ac.uk/spm) running on Matlab 2012b (Mathworks, Inc., Natick, MA, USA, www.mathworks. com). The first three volumes prior to the first task-block were removed from each run. In spatial prepro-cessing the remaining 90 volumes were firstly realigned to their mean image and unwarped to remove residual head motion related variance and image distortions along air-tissue boundaries [24]. Secondly, all data from t2was coregistered to the mean image of the respective
condition at t1. Thirdly, all images were normalised into
standard MNI space using to the EPI-template provided by the Montreal Neurological Institute, re-sliced to a voxel size of 2 × 2 × 2 mm3, and finally all data was spatially smoothed (FWHM = 8 mm). The estimated re-alignment parameter data from the rere-alignment step were filtered using the discrete cosine transform matrix filter (cut off at 128 s) incorporated in SPM8, to remove linear baseline drifts. Only data from participants whose estimated head motion parameters were below a strin-gent threshold of ½ voxel size after filtering in every spatial dimension in both conditions and at both experi-mental sessions were included in the subsequent statis-tical analysis. In the 1st-level analysis the data from t1
and t2were modelled as two separate task regressors in
the same general linear model (GLM) for each move-ment condition individually [25]. Two additional regres-sors were added to the model for each session to account for the T1-decay along consecutive volumes [26]. A high pass filter (cut off at 128 s) was used to re-move slow signal drifts. To account for the sparse-sampling fMRI scheme, data taken during each trial was modelled using a boxcar function (1st-order, window length 3 x TR (i.e., 9.075 s)) [27]. Contrast images for each task regressor were calculated to reveal task-related activation at t1 and t2. To estimate the task-related
ef-fects at the group level, all contrast images of a specific task from the 1st-level analysis were subject to individual one-sample t-tests. Planned comparisons were com-puted, in order to test for significant differences between t1and t2. The resulting activation maps were limited to
motor cortex (M1), primary somatosensory cortex (S1), secondary somatosensory cortex (S2) and the cerebellum Table 1. The ROI covering M1 was built by combining BA 4a and 4b [31]. BAs 1, 2, 3a and 3b served to create the ROI in S1 [32–34]. The ROI covering S2 was built by combining areas Operculum (OP) 1, OP2, OP3 and OP4 in the parietal operculum [35, 36]. The ROI located in the cerebellum was created by combining the lobules I to X (lobes and vermis) included in the Anatomy toolbox [37]. A ROI covering SMA was built from the automated ana-tomical labeling atlas [38] using the WFU_pickatlas tool-box [39]. These specific ROIs were selected as these areas have repeatedly been reported to be involved in lower limb motor control in previous studies [21, 22, 40–42].
Indices of reliability
To assess the reliability of activations in these specific ROIs the following indices were calculated for the indi-vidual data at the 1st-level as well as for the 2nd-level group data from pairs of activation maps:
In order to gain insight into the spatial congruence of activations, the relative overlap of activations between t1
and t2was determined by calculating the Sørensen-Dice
index [43–45]:
Roverlap¼
2Voverlap V1þV2
whereVoverlaprepresents the number of voxels commonly
activated at t1and t2, andV1/V2represent the number of voxels that were activated at t1or t2respectively. This ra-tio of commonly activated voxels and the sum of activated voxels at the two sessions was calculated from activation maps that were limited top≤0.001, uncorrected for mul-tiple comparisons. This index can range from 0 (no over-lap) to 1 (perfect overover-lap) and is independent of the height of the t-values, once voxels have passed the threshold. However, a specific voxel with comparable activation at t1 and t2might pass the threshold in one session, but only just fail to pass the threshold in the second session. In this case the denominator of the above ratio is increased, lead-ing to an underestimation of the overlap between sessions.
To complement the results fromRoverlap, the ICC was calculated, a measure of reliability that is derived from activation maps without any statistical voxel threshold. A two-way mixed model for consistency between mea-surements, i.e. ICC(3,1) was applied in the current study [11, 46]. In the case of two repeated measurements, the ICC coefficient was calculated using:
ICCð3;1Þ ¼ BMS−EMS BMSþEMS
where BMS denotes the Between voxel Mean Square variance, while EMS denotes the Error Mean Square
variance. Using unthresholded data for the calculation of the ICC is legitimate, since the ICC is based purely on the variance of the data and does not depend on the level of activation itself. As such, voxels with low acti-vation might exhibit high ICC coefficients, meaning they have consistent activation despite failing to pass significance in a t-test in the fMRI-analysis (i.e. in the case of voxels whose response to the stimulus poorly fits the modelled hemodynamic response function). However, at the same time the ICC might also include some voxels that were not involved in the task. The co-efficient may range from 0 (low reliability) to 1 (perfect reliability). In the present study, ICCs were classified as excellent above 0.75, good between 0.59 and 0.75, fair between 0.40 and 0.58 and poor for values below 0.40, as proposed by [14].
The results calculated from the single subject data, Roverlap and ICCsingle were then condensed by averaging
across all participants during each movement condition, yielding mean values for Roverlap and ICCsingle. Fisher’s
z-transform was applied to ICCsingle values before
averaging.
To further test for statistically significant differences of Roverlap or ICCsingle across ROIs and conditions, the
results of each reliability index derived from the 1st-level fMRI analyses were entered into a separate 2-way repeated measures ANOVA with the factors condition
and ROI. To test the hypothesis of no significant differences within ROIs across conditions, additional planned comparisons were conducted in case of a sig-nificant main effect of condition (α= 0.05, with a
Bonferroni correction for multiple comparisons).
Normal distribution of the data was verified by visual inspection of Q-Q-plots.
Results
All participants performed both stepping conditions at t1
and t2 during functional image acquisition. The retest
interval between t1 and t2 ranged between 42 and
48 days. In both stepping conditions all data from 8 of the 16 participants was excluded from the analysis due to head motion exceeding ½ voxel size during image ac-quisition either at t1or t2, or both. Most of the head
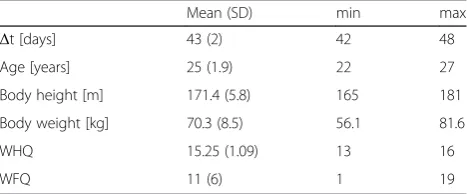
mo-tion occurred in the z-direcmo-tion (inferior/superior), i.e. along the cranio-caudal body axis, probably reflecting the impact of the stepping movements of the legs. Char-acteristics of the study sample can be found in Table 2. The participants of the present study are a subset of those reported in [22].
Motor performance
condition(F1,7= 4.057,p= 0.084). The factor condition
showed a significant main effect (F1,7= 9.751. p=
0.017).
For the performance metric foot force, the 2-way re-peated measures ANOVA did reveal a significant inter-action effect between the factors time and condition
(F1,7= 6.083,p= 0.043). Furthermore, a significant main
effect was found for both factorstime (F1,7= 9.974, p=
0.016) andcondition(F1,7= 419.307,p< 0.001). Planned
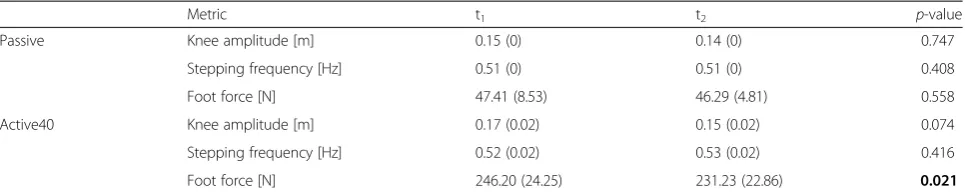
comparisons for the factor time revealed a significant difference in thefoot forcebetween t1and t2in condition active40 (T7= 2.968,p= 0.021), but not in the condition passive(T7= 0.615,p= 0.558) (Table 3).
Finally, the 2-way repeated measures ANOVA for the performance metric stepping frequency did not reveal a significant interaction between the factorstimeand condi-tion (F1,7= 0.554, p= 0.481). Furthermore, no significant
main effect of timewas detected (F1,7= 0.957,p= 0.361).
However, the factor conditionshowed a significant main effect (F1,7= 12.805,p= 0.009).
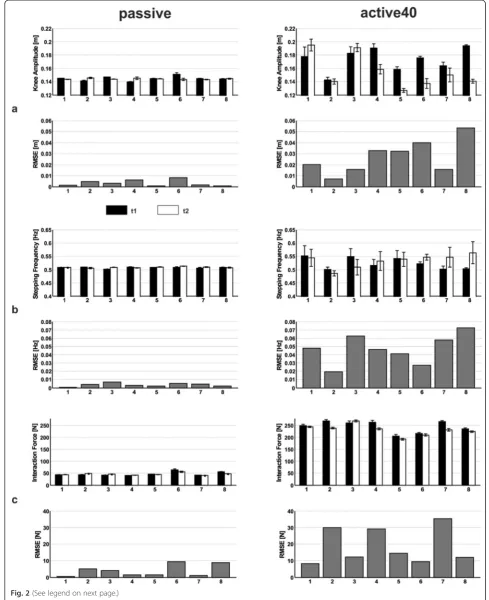
Duringpassivestepping, the mean (standard deviation) RMSE of differences between t1 and t2 for knee ampli-tude was 0.0033 (0.0027) m, 0.0036 (0.002) Hz for step-ping frequency and 3.9922 (3.5492) N for the foot force. Duringactive40stepping, the mean RMSE of differences between t1and t2forknee amplitudewas 0.027 (0.0152)
m, 0.047 (0.0177) Hz forstepping frequencyand 18.8534 (10.7748) N forfoot force (Fig. 2). When comparing the RMSE values between the two movement conditions,
values were about 8-fold higher for knee amplitude, about 13-fold higher for stepping frequency and 4.5-fold higher for foot force in the condition active40 than in
passive. The higher RMSE for foot force in active40 is supported by a higher mean CV of 2.21 (0.45) % for ac-tive40vs. 1.83 (1.94) % inpassive.
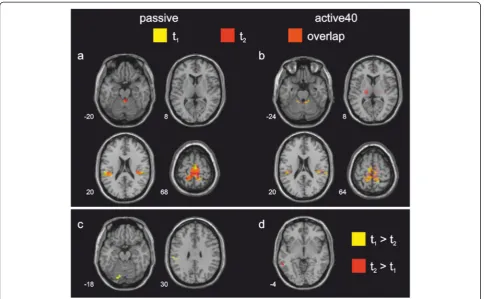
Functional brain activation during stepping at t1and t2
Duringpassivestepping, overlapping activation across t1
and t2 was found in bilateral S1/M1, superior parietal
lobe, S2, SMA proper and the cerebellar vermis. At both measurement sessions the middle cingulate gyrus was furthermore activated, albeit these clusters did not spatially overlap. During active40 stepping, overlapping cortical activation across t1and t2was found in bilateral
S1/M1, superior parietal lobe, S2 and SMA proper. Overlapping subcortical activation in the anterior and posterior cerebellar vermis was furthermore found in this condition. At t2bilateral activation of the thalamus
was additionally found during active40 (Table 4, Fig. 3a and b).
Repeatability of fMRI measurements
Planned comparisons between the activation maps at t1
and t2for passiveand active40stepping revealed only a
minor, yet significant, difference between measurements in both movement conditions. When compared to t2, passive stepping at t1 led to significantly higher
activa-tion in the left supramarginal gyrus and in the cerebellar vermis (Fig. 3c). No area showed significantly higher ac-tivation at t2than at t1in thepassivecondition. During active40 stepping at t2, significantly higher activation
was only found in the left middle temporal sulcus than at t1(Fig. 3d), while no area showed significantly higher
activation at t1than at t2duringactive40.
These small group-level differences between measure-ments at t1and t2 in both stepping conditions are not
fully supported by the ROI-analysis. For passive step-ping, only a small amount of overlapping activation be-tween 2nd-level group data at t1and t2was found in the
cerebellum and S2, while M1, S1 and SMA lacked any overlapping activation (i.e., Roverlap= 0). For active40
stepping, overlapping activation was found in all of the investigated ROIs (Table 5).
Furthermore, the ROI analysis revealed higher ICCs for activations duringactive40than duringpassive step-ping in the cerebellum, S1, S2 and SMA, but not M1. ICCgroupcalculated from the 2nd-level group data during passive stepping revealed fair repeatability for S1 and SMA and good repeatability for S2, the cerebellum and M1. Duringactive40 stepping excellent repeatability was found for all of the ROIs (Table 4).
When calculating average repeatability from the indi-vidual 1st-level fMRI data during the passive condition, Table 2Anthropometric data of the final study sample
Mean (SD) min max
Δt [days] 43 (2) 42 48
Age [years] 25 (1.9) 22 27
Body height [m] 171.4 (5.8) 165 181
Body weight [kg] 70.3 (8.5) 56.1 81.6
WHQ 15.25 (1.09) 13 16
WFQ 11 (6) 1 19
Δtdays between session 1 and session 2,WHQwaterloo handedness questionnaire; values may range from−16 to 16,WFQwaterloo footedness questionnaire; values may range from−20 to 20, positive values represent dominance of the right side of the body in both tests,SDstandard deviation Table 1Definitions of regions of interest as used in the fMRI-analysis
Region of interest Area
M1 BA 4a and 4b
S1 BA 1, 2, 3a & 3b
S2 OP1, OP2, OP3, OP4
SMA SMA from AAL atlas
Cerebellum Lobules I to X (Hemispheres and Vermis)
fair ICCsingle was found for the cerebellum, good ICC sin-gle for S1 and excellent ICCsingle for M1, S2 and SMA.
During active40 stepping good reliability of activations was found in the cerebellum, S1 and S2, while excellent averaged ICCsingle was found in M1 and SMA (Fig. 4).
Individual ICCsingleduring passivestepping ranged from
poor to good in the cerebellum and from fair to excel-lent in S2 and SMA, while in M1 and S1, ICCsingle
ranged from good to excellent. Duringactive40stepping ICCsingle ranged from fair to excellent in the cerebellum
and S1 and from good to excellent M1, S2 and SMA (Table 5).
The 2-way repeated measures ANOVA for ICCsingle
scores revealed a significant interaction effect of condi-tion by ROI (F4,28= 16.173, p< 0.001). Furthermore,
there was a significant main effect ofROI(F4,28= 16.923, p< 0.001), but no significant main effect of condition
(F1,7= 3.538,p= 0.101).
The 2-way repeated measures ANOVA for the single subject Roverlap scores revealed a significant interaction
effect ofconditionandROI(F4,28= 3.537,p= 0.019).
Fur-thermore, there was a significant main effect of ROI
(F4,28= 13.206, p< 0.001), but no significant main effect
ofcondition(F1,7= 0.413,p= 0.541).
Discussion
The present study explored the test-retest reliability of motor performance and brain activation of a novel robot-aided experimental fMRI paradigm at the individ-ual and group-level. The consistency of task-induced blood oxygenated level dependent (BOLD)-signal was compared between repeated measurements of active and passive gait-like stepping in the MR-compatible stepper MARCOS. To the authors’ knowledge, this is the first fMRI reliability study of brain activation during bilateral multi-joint lower limb movements.
Motor performance
Passive stepping did not reveal any statistically signifi-cant differences in motor performance between the mea-surements at t1 and t2. The absence of statistically
significant differences indicates very stable performance
by the robot across repeated measurement sessions dur-ing passive movements. High repeatability during this condition is further supported by a low RMSE between t1and t2for each of the three metrics. Since the robot
was strictly governed by position control in this condition, it was expected that the performance metrics would exhibit very low variability.
The healthy participants in this study reported in gen-eral no difficulties in maintaining limb passivity during the movements that were imposed by the robot. This observation is supported by low values of foot forceand negative interaction forces between the robot and the participants at the knees (not shown), meaning that their legs were indeed suspended by the fixations during pas-sive steps. High interaction forces would indicate a lack of muscle relaxation. In experiments with neurologically impaired patients this could, for example, point towards the presence of spasticity in the involved muscles, i.e. an increased resistance to imposed movement. The low RMSE for foot force further indicates that the partici-pants were able to maintain limb passivity at similar levels during both experiments.
The metric foot force was significantly smaller at t2
than at t1during active40stepping. However, the CV of
the foot force during active40 in the present study is smaller than the CV of the vertical ground reaction force during ground level walking (7 % in [47], single subject measured 9 times over 3 days), or during walking on the treadmill (5–8 % in [48], 10 subjects over 40 steps). Therefore this difference may be attributed to the vari-ability inherent in the human motor system and inter-pret this finding as not physiologically relevant. This rationale is furthermore supported by the fact that no influence of movement performance on activity in spe-cific regions of the brain was found in previous work [22]. The smallerfoot forcesat t2were driven by the
con-current reduction in knee amplitude, since in active40
stepping the robot is governed by a controller generating foot forces in proportion to the position of the knees. Individual RMSE between t1 and t2 of all motor
per-formance metrics were 4.5 to 13-fold above those during
passivestepping, indicating higher variability of movements Table 3Motor performance duringpassiveandactive40stepping at session 1 (t1) and 2 (t2)
Metric t1 t2 p-value
Passive Knee amplitude [m] 0.15 (0) 0.14 (0) 0.747
Stepping frequency [Hz] 0.51 (0) 0.51 (0) 0.408
Foot force [N] 47.41 (8.53) 46.29 (4.81) 0.558
Active40 Knee amplitude [m] 0.17 (0.02) 0.15 (0.02) 0.074
Stepping frequency [Hz] 0.52 (0.02) 0.53 (0.02) 0.416
Foot force [N] 246.20 (24.25) 231.23 (22.86) 0.021
between measurements at t1 and t2 in active40. High
RMSE-values also indicate a limited sensitivity of the ex-perimental set-up in this condition. In the context of an interventional study, it would hence be less likely to detect an actual rehabilitation related change in the motor per-formance during active movements (e.g. a reduction in movement variability).
The stepping frequency of 0.5 Hz investigated in the present study was approximately three times lower than that of over-ground gait at a comfortable speed in healthy participants (approximately 1.75 Hz [47]). In view of future clinical work with neurological patients, a reduced stepping frequency was chosen for two reasons:
Firstly, lower stepping frequencies induce less task-related head motion (results from pilot experiments not shown), a factor that positively contributes to data quality. Secondly, lower stepping frequencies are well tolerated by neurological patients who are prone to developing spasti-city, in particular during passive movements (results from pilot experiments not shown).
Activated areas during stepping
Both stepping conditions led to significant BOLD signal increases at t1and t2,as compared to the control
condi-tion, in areas which have been previously reported to be involved in supine gait-like stepping [22], in pedaling (See figure on previous page.)
Fig. 2Motor performance and its reliability during passive and active40 stepping. Motor performance at session 1 (t1) and 2 (t2) and root mean squared error (RMSE) of differences between t1 and t2 of the individual participants during passive (left column) and active40 (right column) stepping.aknee amplitude,bstepping frequency and (c) foot force. Rows 1, 3, 5: mean ± one standard deviation at t1and t2. Rows 2, 4, 6: RMSE
of differences between t1and t2
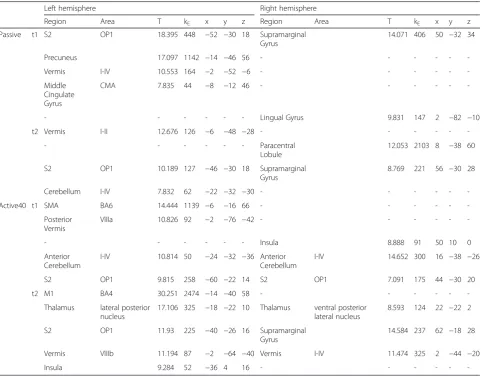
Table 4Cortical and sub-cortical regions of significant BOLD signal increase duringpassiveandactive40stepping
Left hemisphere Right hemisphere
Region Area T kE x y z Region Area T kE x y z
Passive t1 S2 OP1 18.395 448 −52 −30 18 Supramarginal
Gyrus
14.071 406 50 −32 34
Precuneus 17.097 1142 −14 −46 56 - - -
-Vermis I-IV 10.553 164 −2 −52 −6 - - -
-Middle Cingulate Gyrus
CMA 7.835 44 −8 −12 46 - - -
-- - - Lingual Gyrus 9.831 147 2 −82 −10
t2 Vermis I-II 12.676 126 −6 −48 −28 - - -
-- - - Paracentral
Lobule
12.053 2103 8 −38 60
S2 OP1 10.189 127 −46 −30 18 Supramarginal
Gyrus
8.769 221 56 −30 28
Cerebellum I-IV 7.832 62 −22 −32 −30 - - -
-Active40 t1 SMA BA6 14.444 1139 −6 −16 66 - - -
-Posterior Vermis
VIIIa 10.826 92 −2 −76 −42 - - -
-- - - Insula 8.888 91 50 10 0
Anterior Cerebellum
I-IV 10.814 50 −24 −32 −36 Anterior
Cerebellum
I-IV 14.652 300 16 −38 −26
S2 OP1 9.815 258 −60 −22 14 S2 OP1 7.091 175 44 −30 20
t2 M1 BA4 30.251 2474 −14 −40 58 - - -
-Thalamus lateral posterior nucleus
17.106 325 −18 −22 10 Thalamus ventral posterior
lateral nucleus
8.593 124 22 −22 2
S2 OP1 11.93 225 −40 −26 16 Supramarginal
Gyrus
14.584 237 62 −18 28
Vermis VIIIb 11.194 87 −2 −64 −40 Vermis I-IV 11.474 325 2 −44 −20
Insula 9.284 52 −36 4 16 - - -
-Coordinates indicate the location of the peak activation in each cluster. All coordinates are in MNI-space, voxel threshold wasp≤0.001, cluster-corrected,k= 42 voxels
[21, 40, 41], as well as during isolated movements of the lower limbs [42, 49].
Reliability of fMRI measurements at the group level
After the analysis of the estimated head motion parame-ters from the realignment step, eight participants had to be excluded from both stepping conditions. This high dropout rate exemplifies that the test-retest reliability of the presented paradigm is a priori and is limited by the task-induced head motion in many participants. This oc-curred despite extensive body fixation applied to the par-ticipants at the torso and the head.
In those participants included in the analysis, the com-parison of activations elicited by passive stepping at t1
and t2 revealed only minor, yet significant, differences,
accompanied by minor and statistically non-significant changes in motor performance. They specifically con-sisted of higher activity observed in the left supramargi-nal gyrus and the cerebellar vermis at t1. Participants
were able to maintain limb passivity at equal levels dur-ing both sessions. However, many of the participants reported that passiveness of the limbs required consider-able concentration and attention to the task. Due to the novelty and relatively unnatural character of the task at
t1, imposed passivity might have caused a higher
cogni-tive load than at t2, and this might be reflected by
session-specific variations in the related cortical pro-cesses causing differences in test-retest outcome mea-surements. The supramarginal gyrus has been shown to be involved in motor attention [50], hence its differen-tial activation between sessions may indicate an effect of habituation from t1 to t2, despite the provision of
rehearsal trials before image acquisition of each move-ment condition. Differences between activations in-duced by repetition of the same motor task have also been reported by Loubinoux et al. These authors ar-gued that reduced levels of stress, arousal and attention may contribute to the differences between repeated measurements, as the component of novelty is attenu-ated in a second session [6]. Reductions in activation have also been associated with motor learning [51]. However, the design of the current study did not in-clude a motor learning component. Regarding the acti-vation differences between sessions it must also be noted that some signal clusters are located in the vicin-ity of the cerebellar tentorium, a region of the brain that is susceptible to motion artifacts due to the tissue boundaries in this area [52, 53].
Fig. 3Activation maps during passive and active40 stepping.Top row: Regions of significant BOLD signal increase during passive (a) and active40 (b) stepping at session 1 (t1) and 2 (t2), and their overlap.Bottom row: Areas of significantly higher BOLD signal increase at either t1or t2for
passive (c) and active40 (d). Time between t1and t2ranged between 42 and 48 days. The sections were taken at the z-coordinate indicated at
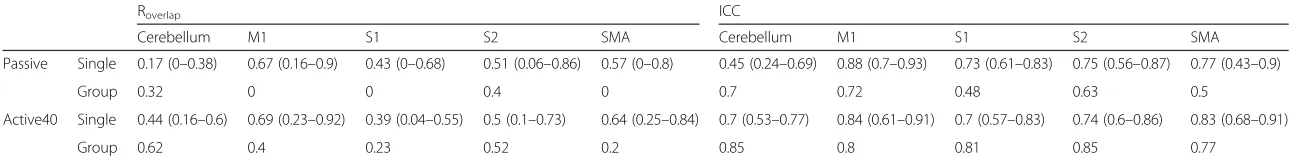
Table 5Single subject and group values of Roverlapand ICC in each region of interest
Roverlap ICC
Cerebellum M1 S1 S2 SMA Cerebellum M1 S1 S2 SMA
Passive Single 0.17 (0–0.38) 0.67 (0.16–0.9) 0.43 (0–0.68) 0.51 (0.06–0.86) 0.57 (0–0.8) 0.45 (0.24–0.69) 0.88 (0.7–0.93) 0.73 (0.61–0.83) 0.75 (0.56–0.87) 0.77 (0.43–0.9)
Group 0.32 0 0 0.4 0 0.7 0.72 0.48 0.63 0.5
Active40 Single 0.44 (0.16–0.6) 0.69 (0.23–0.92) 0.39 (0.04–0.55) 0.5 (0.1–0.73) 0.64 (0.25–0.84) 0.7 (0.53–0.77) 0.84 (0.61–0.91) 0.7 (0.57–0.83) 0.74 (0.6–0.86) 0.83 (0.68–0.91)
Group 0.62 0.4 0.23 0.52 0.2 0.85 0.8 0.81 0.85 0.77
single: values are mean (minimum to maximum) calculated from the results of 1st-level single subject analyses at t1and t2, group: values were calculated from results of the 2nd-level group analysis at t1and t2. M1 = primary motor cortex, S1 = primary somatosensory cortex, S2 = secondary somatosensory cortex, SMA = supplementary motor area
Journal
of
NeuroEngine
ering
and
Rehabilitatio
n
(2015) 12:102
Page
12
of
The findings of Roverlap, the index assessing the overlap
of activations between sessions at t1and t2, only partially
support the findings from the voxel-wise whole group brain analysis. When calculating this metric from the group data, congruent activation duringpassivestepping was found in the cerebellum and S2, but not in any of the other ROIs. Overlapping activation in the paracen-tral lobule (including the medial aspects of M1 and S1) and SMA were found when thresholding the group t-maps during passive stepping more liberally at p≤
0.005 1(uncorrected). Cáceres et al. emphasised that high variability in the data together with the low number of participants, as it often is the case in neuroimaging experiments, hinders the power to de-tect effects [13]. Therefore, with the inclusion of a higher number of participants in passive stepping, an overlap of activation in these areas between t1 and t2
at the group level might be demonstrated at the current threshold.
Intriguingly, group Roverlap was consistently, yet not
significantly, lower during passive than during active40
movements in all of the investigated ROIs. Yet, this is in line with the fact that fewer significant differences be-tween t1and t2were found at the whole brain level
dur-ingactive40thanpassivestepping.
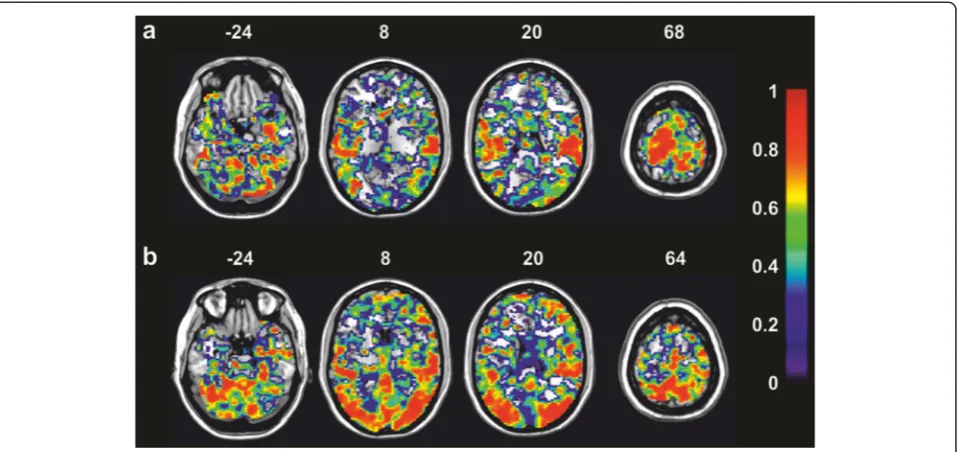
The low congruence of activations during repeated
passivestepping is in line with the values of ICCgroupin
these ROIs (i.e. fair to good). This indicates that the acti-vations elicited by passive stepping in healthy partici-pants are not overly reliable in S1 and SMA, but more robust in the cerebellum, M1 and S2, if a measurement is repeated after several weeks. In the latter three ROIs the activation of voxels was hence on similar levels at t1
and t2 (good ICCgroup), but did not reach significance
(p≤0.001, uncorrected) at the group level at either one or both measurement sessions, and hence Roverlap was
low in these areas. This reflects the fact that voxels can have stable signals across sessions leading to good ICC but at the same time do not necessarily fit the HRF model very well as reflected by low t-values (Fig.5) [13].
Despite the differences and higher variability of motor behaviour between sessions i.e. higher RMSE values of kinematic metrics during active40 stepping, widespread differences on the side of the supraspinal activations were absent, except for one small cluster of 55 voxels in the left posterior middle temporal lobe. The statistical comparison of activation maps at the whole brain level implicates that the generation and control of active movement induces more robust and consistent neural activation across sessions than the monitoring of passive movements. This is supported by the indices of test-retest reliability of fMRI measurements that were com-puted from the 2nd-level group data. Higher levels of overlap (Roverlap) between activations at t1 and t2 were
found duringactive40than duringpassivestepping in all of the investigated ROIs. This finding is accompanied by excellent values of ICCgroup in all of the ROIs. The
ob-servation that activations were generally more robust during active than during passive movements is under-pinned by a previous study of robot-assisted unilateral elbow movements [11]. The values of Roverlap and ICC
reported by Estévez et al. were slightly, yet consistently, higher across investigated ROIs for active than for pas-sive movements regardless of whether the values were calculated from 1st-level or 2nd-level data. In contrast, Loubinoux et al. did not find differences in the reliability of activations between active and passive movements [6].
Reliability of fMRI measurements at the single subject level
In contrast to a complete lack of overlapping activations duringpassivemovements in three of the five ROIs (M1,
S1 and SMA) at the group level, Roverlap was different
from zero in all of the ROIs at the single subject level. However, mean values were lower than those reported by [11]. The ranges of ICCsingle in the present study are
slightly above those of the unilateral single-joint lower limb motor control experiment using ICC as an indica-tor of reliability by Newton et al. [3]. The comparison of ICCs from Newton et al. with those of the present study indicates that test-retest reliability can be increased to some extent by the use of a robot to standardise the motor task between participants. Mean values of ICCsingle
are in the realm of those reported by Estévez et al. who also applied a robotic device to control and measure movements [11].
Considerable variability in both reliability indices cal-culated from pairs of individual t-maps (Roverlap and
ICCsingle, Table 5) was found in this study. This finding
is compatible with a study of Wei et al., who reported that between subject variance is higher than within sub-ject variance in fMRI experiments [54], a finding that was also reported by [10]. This group found that vari-ation in imaging data can be largely explained by differ-ences in the signal-to-noise ratio (SNR) between individual measurements and that good ICC is achieved if the SNR of a particular measurement alone is high [10]. In the present study ICCsinglewas on a similar level
in most participants across ROIs (except for participant 8 who had consistently lower values in all ROIs, Fig.4).
Surprisingly, the SNR of this participant was not lower than that of the other participants (not shown).
Potential implications for patient studies
Several groups have evaluated the test-retest reliability of fMRI experiments in stroke patients. Kimberley et al. found that stroke patients had somewhat higher ICC of fMRI results than healthy controls in a drawing task [8], while Eaton et al. reported approximately equal reliabil-ity between aphasic stroke patients and healthy controls in a language task [55]. However, the study of Kimberley et al. investigated repeatability using the unaffected hand. It can therefore only be speculated about test-retest reliability of experiments involving the paretic side of the body. Kimberley et al. discussed the possibility that increased between-subject variability artificially heightened their measures of reliability. Variability be-tween study subjects may be increased in stroke patients due to heterogeneity in the study sample with regards to time since stroke, extent of recovery or lesion size and location.
The finding that reliability in stroke patients is com-parable to that of healthy controls is somewhat surpris-ing, since factors such as increased head motion [56] and age of patients [57, 58] may decrease the SNR and in turn the reliability. As the mean age of stroke patients is usually higher than that of the healthy participants in the present study, test-retest reliability of the presented
paradigm could hence be lower when applied to a stroke cohort. Huettel et al. suggested to ameliorate the limita-tion of decreased SNR in the elderly by increasing the number of trials [57]. However, increasing the number of trials, and thereby the length of the fMRI experiment, will in turn very likely increase head motion, and this may again, to some extent, cancel out the gain in SNR. There is, therefore, a large potential in the combination of MARCOS with prospective motion correction during BOLD signal acquisition. These systems capture the movement of the head during an experimental run and adjust the pulse sequence in real-time such that the field-of-view remains in alignment with the brain tissue (for a review see [59]).
Conclusions
The results of the present study in healthy participants indicate that activations during passive movements are less robust over repeated measurement sessions than those during active movements despite lower variability of motor performance during passive movements. The high variability of ICCsingle between individual
partici-pants during both movement conditions renders the presented approach less suitable for making inferences at the single-subject level. The fact that half of the par-ticipants had to be excluded from image analysis due to excessive task-induced head motion implies a limited feasibility for studies with patients. The group results from the remaining participants, however, revealed fair to excellent test-retest reliability. This implies feasibility of the method for studies investigating basic neuro-physiological principles and to draw conclusions that can be generalised to the populations from which the study participants were selected.
Competing Interests
The authors declare that they have no competing interests.
Authors’contributions
LJ conceived the study design and conducted data collection as well as analysis of behavioral and imaging data. He was also responsible for writing the first draft of the manuscript. LMC provided technical assistance for the stepping robot, participated in data analysis and critically revised the manuscript. PW contributed substantially to the design of the study and data analysis. He also revised the manuscript. RR and SK contributed substantially to the conceptualization of the study and to the revision of the manuscript. LM was involved in the study design, data analysis and critically contributed to the development of the manuscript. All authors read and approved the final version of the manuscript.
Acknowledgments
The authors would like to thank all study participants for volunteering in our experiments. The authors would also like to thank Mike Brügger for help in the development of the scanning protocol, the Institute for Biomedical Engineering at ETH Zurich for the allocation of scanner time, Anja Kollmar & Hallie Batschelet for assistance during data acquisition, as well as Franz Liem and Natalia Estévez for methodological help in data analysis. We thank Dr. Linda Seward for proofreading.
Lukas Jaeger was funded by the Swiss National Science Foundation Grant Nr. 320030_129937. Laura Marchal-Crespo holds a Marie Curie International income fellowship PIIF-GA-2010-272289.
Author details 1
Department of Health Sciences and Technology, Sensory-Motor Systems (SMS) Lab, ETH Zurich, ML G 59, Sonneggstrasse 3, 8092 Zurich, Switzerland.
2
Medical Faculty, University of Zurich, Zurich, Switzerland.3Clinic of Neuroradiology, University Hospital of Zurich, Zurich, Switzerland.4Center of
MR-Research, University Children’s Hospital, Zurich, Switzerland.
Received: 15 January 2015 Accepted: 6 November 2015
References
1. Winchester P, McColl R, Querry R, Foreman N, Mosby J, Tansey K, et al. Changes in supraspinal activation patterns following robotic locomotor therapy in motor-incomplete spinal cord injury. Neurorehabil Neural Repair. 2005;19(4):313–24. doi:10.1177/1545968305281515.
2. Luft AR, Macko RF, Forrester LW, Villagra F, Ivey F, Sorkin JD et al. Treadmill exercise activates subcortical neural networks and improves walking after stroke a randomized controlled trial. Stroke. 2008;39(12):3341–50. doi: 10.1161/Strokeaha.108.527531.
3. Newton JM, Dong Y, Hidler J, Plummer-D'Amato P, Marehbian J, Albistegui-DuBois RM, et al. Reliable assessment of lower limb motor representations with fMRI: Use of a novel MR compatible device for real-time monitoring of ankle, knee and hip torques. Neuroimage. 2008;43(1):136–46. doi:10.1016/j.neuroimage.2008.07.001. 4. Hollnagel C, Brügger M, Vallery H, Wolf P, Dietz V, Kollias S, et al. Brain
activity during stepping: A novel MRI-compatible device. J Neurosci Methods. 2011;201(1):124–30. doi:10.1016/j.jneumeth.2011.07.022. 5. Dobkin BH, Firestine A, West M, Saremi K, Woods R. Ankle dorsiflexion as an
fMRI paradigm to assay motor control for walking during rehabilitation. Neuroimage. 2004;23(1):370–81. doi:10.1016/j.neuroimage.2004.06.008. 6. Loubinoux I, Carel C, Alary F, Boulanouar K, Viallard G, Manelfe C, et al.
Within-session and between-session reproducibility of cerebral sensorimotor activation: a test-retest effect evidenced with functional magnetic resonance imaging. J Cereb Blood Flow Metab. 2001;21(5):592–607. 7. Alkadhi H, Crelier GR, Boendermaker SH, Golay X, Hepp-Reymond M-C,
Kollias SS. Reproducibility of primary motor cortex somatotopy under controlled conditions. Am J Neuroradiol. 2002;23(9):1524–32.
8. Kimberley T, Khandekar G, Borich M. fMRI reliability in subjects with stroke. Exp Brain Res. 2008;186(1):183–90. doi:10.1007/s00221-007-1221-8. 9. Kimberley T, Birkholz DD, Hancock RA, VonBank SM, Werth TN. Reliability of
fMRI during a continuous motor task: assessment of analysis techniques. J Neuroimaging. 2008;18(1):18–27. doi:10.1111/j.1552-6569.2007.00163.x. 10. Raemaekers M, Vink M, Zandbelt B, van Wezel RJA, Kahn RS, Ramsey NF.
Test–retest reliability of fMRI activation during prosaccades and antisaccades. Neuroimage. 2007;36(3):532–42. http://dx.doi.org/10.1016/ j.neuroimage.2007.03.061.
11. Estévez N, Yu N, Brügger M, Villiger M, Hepp-Reymond M-C, Riener R, et al. A reliability study on brain activation during active and passive arm movements supported by an mri-compatible robot. Brain Topogr. 2014;27(6):731–46. doi:10.1007/s10548-014-0355-9.
12. Havel P, Braun B, Rau S, Tonn JC, Fesl G, Brückmann H, et al. Reproducibility of activation in four motor paradigms. J Neurol. 2006;253(4):471–6. doi:10.1007/s00415-005-0028-4.
13. Caceres A, Hall DL, Zelaya FO, Williams SCR, Mehta MA. Measuring fMRI reliability with the intra-class correlation coefficient. Neuroimage. 2009;45(3):758–68. http://dx.doi.org/10.1016/j.neuroimage.2008.12.035. 14. Cicchetti DV, Sparrow SA. Developing criteria for establishing interrater
reliability of specific items: applications to assessment of adaptive behavior. Am J Ment Defic. 1981;86(2):127–37.
15. Bennett CM, Miller MB. How reliable are the results from functional magnetic resonance imaging? Ann N Y Acad Sci. 2010;1191(1):133–55. doi:10.1111/j.1749-6632.2010.05446.x.
16. Hollnagel C, Vallery H, Schädler R, López I-L, Jaeger L, Wolf P, et al. Non-linear adaptive controllers for an over-actuated pneumatic MR-compatible stepper. Med Biol Eng Comput. 2013;51(7):1–11. doi:10.1007/s11517-013-1050-9. 17. Werner C, Von Frankenberg S, Treig T, Konrad M, Hesse S. Treadmill training
restoration of gait in subacute stroke patients: a randomized crossover study. Stroke. 2002;33(12):2895–901.
18. Mayr A, Kofler M, Quirbach E, Matzak H, Fröhlich K, Saltuari L. Prospective, blinded, randomized crossover study of gait rehabilitation in stroke patients using the Lokomat Gait Orthosis. Neurorehabil Neural Repair.
2007;21(4):307–14. doi:10.1177/1545968307300697.
19. Miyai I, Yagura H, Hatakenaka M, Oda I, Konishi I, Kubota K. Longitudinal optical imaging study for locomotor recovery after stroke. Stroke. 2003;34(12):2866–70. doi:10.1161/01.STR.0000100166.81077.8A.
20. Ciccarelli O, Toosy A, Marsden J, Wheeler-Kingshott C, Sahyoun C, Matthews P, et al. Identifying brain regions for integrative sensorimotor processing with ankle movements. Exp Brain Res. 2005;166(1):31–42. doi:10.1007/ s00221-005-2335-5.
21. Mehta JP, Verber MD, Wieser JA, Schmit BD, Schindler-Ivens SM. A novel technique for examining human brain activity associated with pedaling using fMRI. J Neurosci Methods. 2009;179(2):230–9. doi:10.1016/ j.jneumeth.2009.01.029.
22. Jaeger L, Marchal-Crespo L, Wolf P, Riener R, Michels L, Kollias S. Brain activation associated with active and passive lower limb stepping. Front Hum Neurosci. 2014;8:828.
23. Bland JM, Altman DG. Measurement error. BMJ. 1996;313(7059):744. 24. Andersson JL, Hutton C, Ashburner J, Turner R, Friston K. Modeling
geometric deformations in EPI time series. Neuroimage. 2001;13(5):903–19. doi:10.1006/nimg.2001.0746.
25. Friston KJ, Holmes AP, Worsley KJ, Poline JP, Frith CD, Frackowiak RSJ. Statistical parametric maps in functional imaging: A general linear approach. Hum Brain Mapp. 1994;2(4):189–210. doi:10.1002/hbm.460020402. 26. Zaehle T, Schmidt CF, Meyer M, Baumann S, Baltes C, Boesiger P et al.
Comparison of“silent”clustered and sparse temporal fMRI acquisitions in tonal and speech perception tasks. Neuroimage. 2007;37(4):1195–204. http://www.sciencedirect.com/science/article/pii/S105381190700479X. 27. Liem F, Lutz K, Luechinger R, Jäncke L, Meyer M. Reducing the interval
between volume acquisitions improves“Sparse”scanning protocols in event-related auditory fMRI. Brain Topogr. 2012;25(2):182–93. doi:10.1007/ s10548-011-0206-x.
28. Slotnick SD, Moo LR, Segal JB, Hart Jr J. Distinct prefrontal cortex activity associated with item memory and source memory for visual shapes. Cogn Brain Res. 2003;17(1):75–82. http://dx.doi.org/10.1016/S0926-6410(03)00082-X. 29. Forman SD, Cohen JD, Fitzgerald M, Eddy WF, Mintun MA, Noll DC.
Improved assessment of significant activation in functional magnetic resonance imaging (fMRI): use of a cluster-size threshold. Magn Reson Med. 1995;33(5):636–47. doi:10.1002/mrm.1910330508.
30. Eickhoff SB, Stephan KE, Mohlberg H, Grefkes C, Fink GR, Amunts K et al. A new SPM toolbox for combining probabilistic cytoarchitectonic maps and functional imaging data. Neuroimage. 2005;25(4):1325–35. http:// www.sciencedirect.com/science/article/pii/S105381190400792X.
31. Geyer S, Ledberg A, Schleicher A, Kinomura S, Schormann T, Burgel U, et al. Two different areas within the primary motor cortex of man. Nature. 1996;382(6594):805–7. doi:10.1038/382805a0.
32. Geyer S, Schleicher A, Zilles K. Areas 3a, 3b, and 1 of human primary somatosensory cortex: 1. Microstructural organization and interindividual variability. Neuroimage. 1999;10(1):63–83.
33. Geyer S, Schormann T, Mohlberg H, Zilles K. Areas 3a, 3b, and 1 of human primary somatosensory cortex: 2. Spatial normalization to standard anatomical space. Neuroimage. 2000;11(6):684–96.
34. Grefkes C, Geyer S, Schormann T, Roland P, Zilles K. Human somatosensory area 2: observer-independent cytoarchitectonic mapping, interindividual variability, and population map. Neuroimage. 2001;14(3):617–31. 35. Eickhoff SB, Schleicher A, Zilles K, Amunts K. The human parietal operculum. I.
Cytoarchitectonic mapping of subdivisions. Cereb Cortex. 2006;16(2):254–67. doi:10.1093/cercor/bhi105.
36. Eickhoff SB, Amunts K, Mohlberg H, Zilles K. The human parietal operculum. II. Stereotaxic maps and correlation with functional imaging results. Cereb Cortex. 2006;16(2):268–79. doi:10.1093/cercor/bhi106.
37. Diedrichsen J, Balsters JH, Flavell J, Cussans E, Ramnani N. A probabilistic MR atlas of the human cerebellum. Neuroimage. 2009;46(1):39–46.
38. Tzourio-Mazoyer N, Landeau B, Papathanassiou D, Crivello F, Etard O, Delcroix N, et al. Automated anatomical labeling of activations in SPM using a macroscopic anatomical parcellation of the MNI MRI single-subject brain. Neuroimage. 2002;15(1):273–89. doi:10.1006/nimg.2001.0978.
39. Maldjian JA, Laurienti PJ, Kraft RA, Burdette JH. An automated method for neuroanatomic and cytoarchitectonic atlas-based interrogation of fMRI data sets. Neuroimage. 2003;19(3):1233–9.
40. Mehta JP, Verber MD, Wieser JA, Schmit BD, Schindler-Ivens SM. The effect of movement rate and complexity on functional magnetic resonance signal change during pedaling. Motor Control. 2012;16(2):158–75.
41. Christensen LO, Johannsen P, Sinkjaer T, Petersen N, Pyndt HS, Nielsen JB. Cerebral activation during bicycle movements in man. Exp Brain Res. 2000;135(1):66–72.
42. Kapreli E, Athanasopoulos S, Papathanasiou M, Van Hecke P, Strimpakos N, Gouliamos A, et al. Lateralization of brain activity during lower limb joints movement. An fMRI study. Neuroimage. 2006;32(4):1709–21. doi:10.1016/ j.neuroimage.2006.05.043.
43. Rombouts SA, Barkhof F, Hoogenraad FG, Sprenger M, Valk J, Scheltens P. Test-retest analysis with functional MR of the activated area in the human visual cortex. Am J Neuroradiol. 1997;18(7):1317–22.
44. Dice LR. Measures of the amount of ecologic association between species. Ecology. 1945;26(3):297–302.
45. Sørensen T. A method of establishing groups of equal amplitude in plant sociology based on similarity of species and its application to analyses of the vegetation on Danish commons. Biol Skr. 1948;5:1–34.
46. Shrout PE, Fleiss JL. Intraclass correlations: uses in assessing rater reliability. Psychol Bull. 1979;86(2):420–8.
47. Winter DA. Kinematic and kinetic patterns in human gait: Variability and compensating effects. Hum Mov Sci. 1984;3(1–2):51–76. http://dx.doi.org/ 10.1016/0167-9457(84)90005-8.
48. Masani K, Kouzaki M, Fukunaga T. Variability of ground reaction forces during treadmill walking. J Appl Physiol. 2002;92(5):1885–90. 49. Martinez M, Villagra F, Loayza F, Vidorreta M, Arrondo G, Luis E, et al.
MRI-compatible device for examining brain activation related to stepping. IEEE Trans Med Imaging. 2014;33(5):1044–53. doi:10.1109/tmi.2014.2301493. 50. Rushworth MFS, Krams M, Passingham RE. The attentional role of the left
parietal cortex: the distinct lateralization and localization of motor attention in the human brain. J Cogn Neurosci. 2001;13(5):698–710. doi:10.1162/ 089892901750363244.
51. Floyer-Lea A, Matthews PM. Changing brain networks for visuomotor control with increased movement automaticity. J Neurophysiol. 2004;92(4):2405–12. doi:10.1152/jn.01092.2003.
52. Field AS, Yen Y-F, Burdette JH, Elster AD. False cerebral activation on BOLD functional MR images: study of low-amplitude motion weakly correlated to stimulus. Am J Neuroradiol. 2000;21(8):1388–96.
53. Jezzard P, Balaban RS. Correction for geometric distortion in echo planar images from B0 field variations. Magn Reson Med. 1995;34(1):65–73. 54. Wei X, Yoo S-S, Dickey CC, Zou KH, Guttmann CRG, Panych LP. Functional
MRI of auditory verbal working memory: long-term reproducibility analysis. Neuroimage. 2004;21(3):1000–8. http://dx.doi.org/10.1016/
j.neuroimage.2003.10.039.
55. Eaton KP, Szaflarski JP, Altaye M, Ball AL, Kissela BM, Banks C et al. Reliability of fMRI for studies of language in post-stroke aphasia subjects. Neuroimage. 2008;41(2):311–22. http://dx.doi.org/10.1016/j.neuroimage.2008.02.033. 56. Seto E, Sela G, McIlroy WE, Black SE, Staines WR, Bronskill MJ, et al.
Quantifying head motion associated with motor tasks used in fMRI. Neuroimage. 2001;14(2):284–97. doi:10.1006/nimg.2001.0829. 57. Huettel SA, Singerman JD, McCarthy G. The Effects of Aging upon the
Hemodynamic Response Measured by Functional MRI. Neuroimage. 2001;13(1):161–75. http://dx.doi.org/10.1006/nimg.2000.0675.
58. D'Esposito M, Zarahn E, Aguirre GK, Rypma B. The effect of normal aging on the coupling of neural activity to the bold hemodynamic response. Neuroimage. 1999;10(1):6–14. doi:10.1006/nimg.1999.0444.