R E S E A R C H
Open Access
Gut microbiota in experimental murine
model of Graves
’
orbitopathy established in
different environments may modulate
clinical presentation of disease
Giulia Masetti
1,2, Sajad Moshkelgosha
3,4,5, Hedda-Luise Köhling
6,7, Danila Covelli
6,8, Jasvinder Paul Banga
3,4,
Utta Berchner-Pfannschmidt
3, Mareike Horstmann
3, Salvador Diaz-Cano
9, Gina-Eva Goertz
3, Sue Plummer
6,
Anja Eckstein
3, Marian Ludgate
1, Filippo Biscarini
1,2,10, Julian Roberto Marchesi
11,12*and the INDIGO consortium
13Abstract
Background:Variation in induced models of autoimmunity has been attributed to the housing environment and its effect on the gut microbiota. In Graves’disease (GD), autoantibodies to the thyrotropin receptor (TSHR) cause autoimmune hyperthyroidism. Many GD patients develop Graves’orbitopathy or ophthalmopathy (GO)
characterized by orbital tissue remodeling including adipogenesis. Murine models of GD/GO would help delineate pathogenetic mechanisms, and although several have been reported, most lack reproducibility. A model
comprising immunization of female BALBc mice with a TSHR expression plasmid using in vivo electroporation was reproduced in two independent laboratories. Similar orbital disease was induced in both centers, but differences were apparent (e.g., hyperthyroidism in Center 1 but not Center 2). We hypothesized a role for the gut microbiota influencing the outcome and reproducibility of induced GO.
Results:We combined metataxonomics (16S rRNA gene sequencing) and traditional microbial culture of the intestinal contents from the GO murine model, to analyze the gut microbiota in the two centers. We observed significant differences in alpha and beta diversity and in the taxonomic profiles, e.g., operational taxonomic units (OTUs) from the genusLactobacilluswere more abundant in Center 2, andBacteroidesandBifidobacteriumcounts were more abundant in Center 1 where we also observed a negative correlation between the OTUs of the genus Intestinimonasand TSHR autoantibodies. Traditional microbiology largely confirmed the metataxonomics data and indicated significantly higher yeast counts in Center 1 TSHR-immunized mice. We also compared the gut
microbiota between immunization groups within Center 2, comprising the TSHR- orβgal control-immunized mice and naïve untreated mice. We observed a shift of the TSHR-immunized mice bacterial communities described by the beta diversity weighted Unifrac. Furthermore, we observed a significant positive correlation between the presence ofFirmicutesand orbital-adipogenesis specifically in TSHR-immunized mice.
(Continued on next page)
* Correspondence:[email protected]
Filippo Biscarini and Julian Marchesi these authors are joint senior author. Giulia Masetti and Sajad Moshkelgosha these authors contributed equally to the study.
11
School of Biosciences, Cardiff University, Sir Martin Evans Building, Museum Avenue, Cardiff CF10 3AX, UK
12Center for Digestive and Gut Health, Imperial College London, W2 1NY,
London, UK
Full list of author information is available at the end of the article
(Continued from previous page)
Conclusions:The significant differences observed in microbiota composition from BALBc mice undergoing the same immunization protocol in comparable specific-pathogen-free (SPF) units in different centers support a role for the gut microbiota in modulating the induced response. The gut microbiota might also contribute to the
heterogeneity of induced response since we report potential disease-associated microbial taxonomies and correlation with ocular disease.
Keywords:Graves’orbitopathy, Graves’disease, Induced animal model, Gut microbiota, TSHR, Metataxonomics, Orbital adipogenesis,Firmicutes
Background
The poor reproducibility of murine models of human diseases has become a puzzling phenomenon in recent decades. Apart from the genetic background of the strains used, the type of animal housing, diet, and even the vendor can influence disease phenotype [1,2].
In Graves’ disease (GD) and Graves’ orbitopathy or ophthalmopathy (GO), in vivo models could help to unravel the pathogenetic mechanisms leading to auto-immunity and identify new therapeutic targets [3]. The lack of spontaneous models of GD and GO necessitates induction of disease under laboratory conditions (reviewed in [4]).
Graves’disease is an organ-specific antibody-mediated autoimmune disease, governed by both genetic predisposition and environmental factors, in which thyroid-stimulating antibodies (TSAb) mimic the func-tion of thyroid-stimulating hormone (TSH) to activate the thyrotropin receptor (TSHR). Moreover, the presence of thyroid-stimulating blocking antibodies (TSBAb), which inhibit the TSHR signaling cascade, and neutral antibodies to TSHR have been described in GD [5]. GD symptoms include hyperthyroidism, weight loss, heat intolerance, and tremors; it affects about 2% of the population in the UK, with a female predomin-ance. About 20% of GD patients develop an eye disease, GO, characterized by pro-inflammatory cells and tissue remodeling (extraocular muscle inflammation, adipo-genesis, overproduction of extra-cellular matrix) in the orbit [6].
Several GD mouse models have been developed using different immunization protocols with no signs of concomitant eye disease as previously reviewed [4, 7, 8]. Ludgate and colleagues established a TSHR-induced GO model by genetic immunization, i.e., injecting a TSHR ex-pression plasmid [9]. Mice developed thyroiditis plus some aspects of GO and disease could be transferred to naive recipients using the TSHR-primed T cells from the genetically immunized mice. However, the model could not be reproduced in a different animal unit (neither was specific-pathogen-free (SPF)), and the TSHR-induced disease was quite distinct from that previously described, which the authors postulated might be due to
microorganisms [10]. It has also been reported that TSHR-immunized mice from a conventional environment had higher and more persistent TSAb levels than mice in SPF units [11].
Recently, Berchner-Pfannschmidt and colleagues re-ported the induction of GO-like disease in two independ-ent SPF units [12]. The immunization protocol utilized genetic delivery of TSHR A-subunit plasmid by close field electroporation, which leads to features of GD accompan-ied by symptoms of eye disease, such as adipogenesis and inflammatory infiltrates in the orbit [7, 13]. Controls re-ceived a plasmid encoding theβ-galactosidase (βgal) gene delivered by the same procedure. Most aspects of the model were reproduced successfully; however, there was heterogeneity in induced disease and differences in thyroid function in the animals undergoing experimental GO in the two locations [12].
Over the years, the gut microbiota has been associated with several diseases [14–17] and its confounding role in establishing or reproducing disease phenotype in murine models has also been proposed [18].
The murine model of multiple sclerosis, experimental autoimmune encephalomyelitis (EAE), seems to be highly influenced by the gut microbiota. Oral antibiotic immunization and consequent depletion of the gut bacteria, before disease induction, resulted in protection from disease development, along with reduction in pro-inflammatory mediators such as IL-17 and an in-creased Th2-immune response [19]. On the contrary, the intestinal monocolonization of germ-free mice (sterile) with segmented filamentous bacteria (SFB) restored the disease phenotype, along with an increased number of Th17 cells in the CNS, suggesting a direct interplay of the gut microbiota and the immune response in EAE develop-ment [20].
We aimed to characterize, for the first time, the gut microbiota of the GD/GO models via a combination of metataxonomics (16S rRNA gene sequencing) and trad-itional microbial culture approaches. We compared the gut contents of TSHR-immunized mice from the two centers to understand whether variation in gut compos-ition could explain differences in the disease induced. Within one center, we then characterized the gut micro-biota between different immunizations (TSHR andβgal) and compared them with untreated mice, to determine whether the gut microbiota can influence the outcome and correlate with disease features.
Methods
GO preclinical mouse model samples
Mouse samples used in the present work were obtained from a recent study [12], conducted in parallel in two inde-pendent animal housing units, under comparable SPF con-ditions. Animal procedures in center 1 were reviewed and approved by the Ethical Committee of King’s College London and conducted with Personal and Project licenses under United Kingdom Home Office regulations. Animal procedures in center 2 were reviewed and approved by North Rhine Westphalian State Agency for Nature, Envir-onment and Consumer Protection (LANUV), Germany. Samples from the animal unit of King’s College London (UK) will be referred to as“Center 1”and included a total of 5 TSHR-immunized mice (TSHR). Samples from the University of Duisburg-Essen (Germany) will be referred to as “Center 2”, including 10 TSHR-immunized (TSHR), 8
βgal plasmid controls (βgal), and 6 untreated mice (in-cluded as a background control), as shown in Table1.
The GO immunization protocol has been previously described [13]. Briefly, 6–8-week-old BALB/cOlaHsd female mice were immunized via intramuscular injec-tion into each biceps femoris muscle [22] and elec-troporation of either the eukaryotic expression
plasmid pTriEx1.1Neo-hTSHR (hTSHR289) (TSHR group) or the control plasmid pTriEx1.1Neo-β-gal (plasmid-control, βgal group). All animals, whether TSHR or βgal controls, received a total of four plas-mid injections at 3-week intervals of the experiment (0, 3, 6, and 9 weeks).
Each mouse was anesthetized using isoflurane with a properly calibrated vaporizer throughout the immunization procedure (injection and electropor-ation). After the immunization, mice were carefully transferred to a recovery cage until fully recovered.
Mice in Center 1 were maintained conventionally in open cages in one room and co-housed at a maximum of three animals per cage. In Center 2, the mice were co-housed according to their immunizations, two to four animals per individually ventilated cage in one room. All mice were provided by different outlets of the same sup-plier (Harlan Ltd. or Harlan laboratories BV). In both cen-ters, mice received autoclaved water and had been fed ad libitum similar commercial chow from different suppliers (Rat and Mouse no.1 Maintenance from Special Diet Ser-vices, LBS Biotech UK for Center 1 and Rat/Mouse Main-tenance V1534-300 from Ssniff Spezialadiaten GmbH, Germany, for Center 2). Also the cage bedding was from different suppliers.
All immunized and control mice in both locations were sacrificed 9 weeks after the last immunization (18 weeks) to permit the development of the chronic phase of the disease in the TSHR group (Additional file 1: Figure S1).
After sacrifice, murine intestines were snap-frozen and stored in sterile containers at−80 °C. For subsequent ana-lysis, whole intestines were thawed and directly afterwards placed on a sterile padding. The organs were dissected into two or three parts and the content of all parts was scratched out from oral to aboral end with a sterile inoculation loop resulting in one sample per mouse, which was collected in a sterile container and frozen at−80 °C until needed. Within Center 2 only, fecal pellets ofβgal- and TSHR-immunized mice were also collected before each injection (week 0, 3, 6, and 9). Total DNA was extracted from fecal pellets as de-scribed below.
Methods for (i) the evaluation of clinical symptoms, (ii) the determination of the thyroid hormone thyroxine blood levels (fT4) and TRAB (both stimulating TSAb and block-ing TSBAb) antibodies, and (iii) the measurement of the expansion of fat cells (adipogenesis) and muscular atrophy in the orbit have been already described [12]. A full de-scription of the mice involved and samples collected in the present study is represented in Table1.
Traditional microbial cultures of mouse gut contents
A total of 29 scraped intestinal samples (Table1) derived from Center 1 and Center 2 were analyzed. One gram of
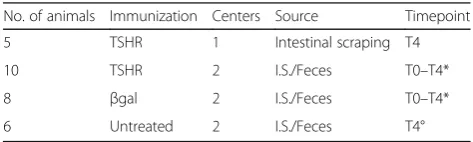
Table 1Description of the mouse groups involved in this study
No. of animals Immunization Centers Source Timepoint
5 TSHR 1 Intestinal scraping T4
10 TSHR 2 I.S./Feces T0–T4*
8 βgal 2 I.S./Feces T0–T4*
6 Untreated 2 I.S./Feces T4°
A total of 23 female BALB/cOlaHsd, 6–8-week-old mice were challenged either with the pTriEx1.1Neo-hTSHR to induce disease (TSHR group) or with pTriEx1.1Neo-β-gal as a plasmid control group (βgal group). Independent SPF animal units were based in London (Center 1) and Essen (Center 2). An untreated group of six mice has been included as a background control. Samples collection comprised of intestine scraping (I.S.) from Center 1 and both fecal pellets and I.S. within Center 2
feces per mouse was diluted in 9 mL pre-reduced max-imum recovery diluent (CM0733, Oxoid, Basingstoke, United Kingdom) with 20%v/vglycerol and the solution was mixed by vortexing for 5 s. Afterwards, 10-fold ser-ial dilutions were prepared, and 100 μl of each dilution was plated onto different culture media under aerobic or anaerobic conditions (Anaerobic Workstation, AW400SG, Elektrotek, Keighley, West Yorkshire, UK). Specific media, culture conditions, and dilution used to isolate different bacteria are listed in Additional file2.
Bacteria were identified by Gram staining, colony morphology, the presence of spores, and catalase re-action and partially by the API system (BioMerieux, Marcy-l’Étoile, France). Viable bacterial cell counts were enumerated and all counts were recorded as the numbers of log 10 colony forming units per gram of sample. Counts data were Box-Cox transformed be-fore statistical analysis [23]. Mouse groups were com-pared through the analysis of variance (one-way ANOVA) and Tukey’s multiple comparisons test with adjusted P values.
Extraction of total DNA from gut contents and feces and 16S rRNA gene sequencing
A total of 29 scraped intestinal samples and 96 fecal pellets were individually placed in 2-mL tubes pre-filled with 0.1 mm silica and zirconia bead mix (Benchmark Scientific, Edison, USA), dissolved in 1 mL InhibitEX buffer (Qiagen Ltd., West Sussex, UK) and vortexed until homogenized. A bead-beating step (Beadbug microcentrifuge homogenizer, Bench-mark Scientific, USA) was applied for 3 × 60 s at 5 m/s with 5 min rest in-between. The DNA extrac-tion has been performed with QiAmp Fast DNA Stool Mini kit (Qiagen Ltd., UK), following the man-ufacturer’s instruction. Total genomic DNA was eluted in sterile microcentrifuge tubes and quantified by Qubit Fluorimetric Quantitation (ThermoFisher Scientific Ltd., UK), following the manufacturer’s in-structions. DNA aliquots were kept at −20 °C until used. Sequencing of the variable regions of the 16S rRNA gene was performed at Research and Testing Laboratory LLC (Lubbock, Texas, USA). Primers used to amplify the V1–V2 regions of 16S rRNA gene were 28F (5′-GAGTTTGATCNTGGCTCAG-3′) and 388R (5′-TGCTGCCTCCCGTAGGAGT-3′). Sequen-cing was performed using an Illumina Miseq (Illu-mina, San Diego, USA), with 10K paired-end sequencing protocol.
Processing and statistical analysis of metataxonomic data
Processing of the sequences was performed using Mothur v1.36, to reduce possible PCR effects and to cluster sequences into operational taxonomic units
(OTUs) at the 97% identity cut-off and provide the taxonomic annotations [24]. Paired-end reads (R1 and R2) were joined for each sample using the Mothur function “make.contigs” and trimmed at the 2.5%-tile and 97.5%-tile on the distribution lengths of the amplicons. Sequences with any ambiguities (i.e., Ns) were removed by setting parameter N= 0. Filtered se-quences were aligned against the SILVA 16S rRNA gene reference database (http://www.arb-silva.de). Re-moval of chimera sequences was done with the Uchime tool [25]; singleton and non-bacterial se-quences (e.g., Archaea, eukaryotic, chloroplast, and mitochondria) have been removed from the analysis. The taxonomic assignment from phylum to genus level of the processed sequences was done using the Ribosomal Database Project (RDP) Naïve Bayesian Classifier, using Trainset 14 with a cut-off of 80% [26]. FastTree (version 2.1.7) has been used to build a phylogenetic tree, using an approximated maximum likelihood solved by Jukes-Cantor evolutionary model [27]. To reduce the effect of possible different sam-pling methods and to obtain comparable sequencing libraries, each sample library has been subsampled based on the smallest library size. OTUs with less than 10 counts have been excluded from the dataset and grouped as “OTU_low”, and the analysis has been performed collapsing OTUs at the phylum-genus levels. Statistical analysis was performed in R (Version 3.2.2) and STAMP tool for metataxonomic data ana-lysis [28].
Alpha diversity indices (observed OTUs, Chao1, ACE, and Shannon) were calculated within samples from Mothur and tested for association with covariates (e.g., locations and immunizations) using a linear model, followed by Tukey’s honest significant difference (HSD) post hoc analysis.
Beta diversity was estimated using the Unifrac weighted distance to compare bacterial communities among samples [29], and represented in a non-metric dimensional scaling (NMDS) plot. The permutational multivariate analysis of variance (PERMANOVA) was calculated through the Adonis function [30] in R Vegan package (using 999 permutations) and was used to test the association between the microbiota composition and the covariates (e.g., location of the laboratories or immunizations).
The hierarchical clustering of genera was performed using the Spearman distance and the Ward agglomer-ation method. Statistical tests with P≤0.05 were con-sidered as significant.
yijk ¼μþTimeiþImmunizationj þðTimeImmunizationÞijþeijk
where y is the vector of either alpha diversity Chao or Shannon indices, or of theFirmicutes/Bacteroidetesratio calculated from the relative abundances in each sample at each timepoint; μ is the overall mean; time is the ef-fect of timepoint in classes (T0, T1…T4); immunization is the type of immunization (either the TSHR or βgal). The factorial interaction between immunization and time has also been included in the model;eis the vector of residual effects. Comparison between βgal and TSHR immunizations at each timepoint was made using the pairwiseT test with Benjamini-Hochberg correction for false discovery rate (FDR).
To test differences in phylum and genus counts be-tween immunizations and timepoints, the same model was used in the generalized linear model (GLM) implemented in the EdgeR package [31]. Pair-wise comparisons of phylum and genus counts be-tween timepoints and immunizations have been assessed with Fisher’s exact test in EdgeR package.
Correlations of either the taxonomy counts (phylum and genus relative abundances) or the mi-crobial counts from the traditional culture approach and disease features, such as anti-TSHR antibodies and thyroid hormone thyroxine levels (fT4), orbital adipogenesis, or muscular atrophy values, were esti-mated using the Spearman correlation coefficient (Rho) and represented in a correlation plot, using the R Corrplot package. Additional statistical methods are described in Additional file 2.
Results
Sequencing metrics
From 16S rRNA gene sequencing (V1–V2 regions), a total of 5,333,798 reads were obtained which re-duced to 4,047,186 reads after quality filtering. Fol-lowing alignment, we obtained an average of 20,534 reads per sample, ranging from 3502 to 134,901. Subsampling per library size resulted in a 96% aver-age coveraver-age per OTU definition at 3052 reads per sample. The averaged coverage and subsampling was sufficient to describe gut bacterial communities ac-cording to sequence-based rarefaction curves (data not shown).
We identified a total of 4281 OTUs: 1037 OTUs had more than 10 counts across samples and were retained.
Comparative analysis of the gut microbiota of GO preclinical mouse models in different centers
To assess whether the microbiota has an impact on the GO mouse model in different laboratories, we compared
the gut microbial contents of 5 TSHR mice from Center 1 and 10 TSHR-immunized BALB/c female mice from Center 2, after sacrifice (T4).
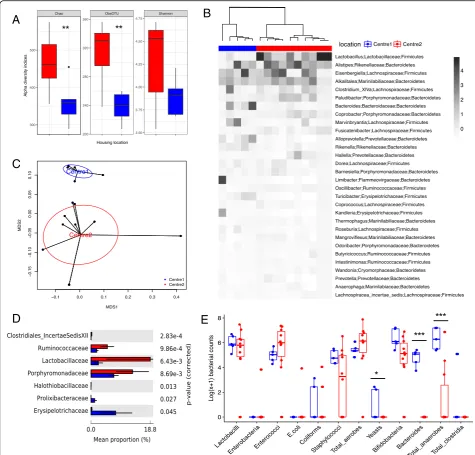
Comparison of the alpha diversity indices showed a significant reduction in the richness (P= 0.01), but not in the diversity of the Center 2 microbial community (P> 0.05, Fig.1a). The gut microbiota composition from the two centers showed a good separation according to the Spearman distance and Ward hierarchical clustering (Fig.1b), and a PERMANOVA test on the weighted Uni-frac distances revealed a spatial difference between bac-terial communities (P = 0.005 with 999 permutations, Fig.1c).
At a phylum level, Bacteroidetes and Firmicutes were the most represented of the seven phyla identified, with no differences between them in the two centers (P = 0.99). Lactobacillaceae, Ruminococcaceae, and
Por-phyromonadaceae families were more abundant in
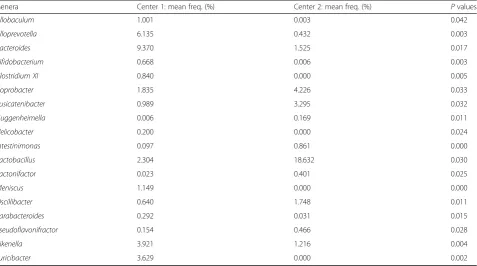
Cen-ter 2 than in CenCen-ter 1 TSHR mice (P< 0.01, Fig.1d). We observed significant differences in the abundance of 18 genera between the two centers, as detailed in Table2.
From the traditional microbial culture of the gut con-tents, we observed differences in yeast (P= 0.03186), Bac-teroides (P< 0.0005), and total anaerobe (P= 0.00081) counts, which were found to be enriched in the Center 1 compared with the Center 2 TSHR mice (Table3). Cultures from mouse intestinal scraping of Center 2 did not contain any total clostridia,Bacteroides, or yeasts, and we were able to culture enterobacteria,E. coli, and coliforms from only one mouse from this group.E.coliand coliforms were also the least abundant in the Center 2 TSHR mice (Fig. 1e). Furthermore, sinceYersinia enterocolitica has been impli-cated in GD pathogenesis [32], we used selective agar plates forYersiniasp. but noYersiniacolonies grew.
Gut microbiota differences in immunized and control mice within Center 2
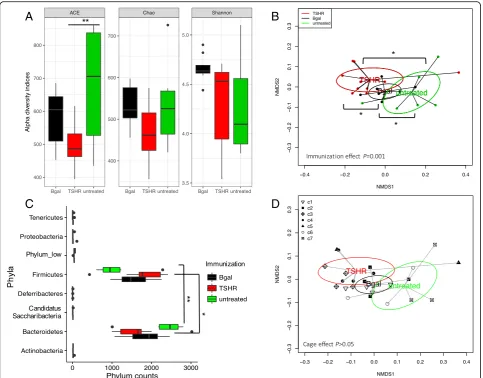
To observe the possible contribution of the gut micro-biota in the disease, we compared the gut micromicro-biota composition between immunization groups in mice within Center 2. No significant differences were ob-served in alpha diversity indices among immunizations, apart from the abundance-based coverage estimator (ACE) index between untreated and TSHR groups (Fig.2a,P= 0.01). The ACE index relies on the presence of rare OTUs [33], which were more abundant in the untreated group compared to the plasmid-immunized mice. Theβgal group showed a slightly skewed distribu-tion of the Shannon index when compared to the others; however, the post hoc comparison was not significant.
βgal bacterial communities were closer to those of the untreated mice, while we observed a spatial shift of the TSHR-immunized bacterial communities.
OTUs from Bacteroidetes and Firmicutes phyla were the most abundant among the phyla identified (Fig. 2c)
and showed a different distribution pattern among im-munized groups. In particular, Firmicutes counts were higher in TSHR-immunized mice (P= 0.05) and
Bacter-oidetes were found to be higher in the untreated group
(P= 0.012). At a genus level, eight genera were
A
C
B
D
E
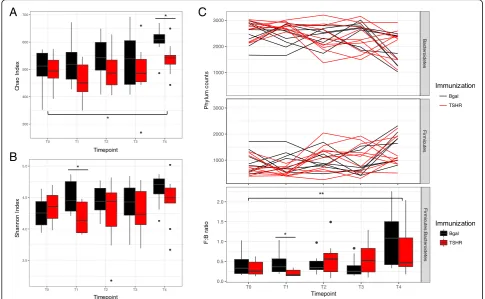
Fig. 1Comparative analysis of the gut microbiota in independent animal units.aBox and whisker plot of the alpha diversity indices for richness (Chao1 and observed OTUs indices) and evenness (Shannon index) of the bacterial communities in TSHR-immunized mice housed in Center 1
(blue) and Center 2 (red), respectively. Tukey’s HSD post hoc: Chao1,P= 0.01; observed OTUs,P< 0.001; Shannon,P= 0.08.bAnnotated heatmap
based on Spearman distance and Ward hierarchical clustering of the top 30 genera shows how well the two locations cluster together. Taxonomy explanation includes genera, family, and phylum, which are entered in order of abundance. Genus abundance is described by the change in the
intensity of the gray color, as annotated.cMultidimensional scaling plot (MDS) based on the weighted Unifrac distances between the two animal
units. PERMANOVA with 999 permutationsP= 0.005.dDifferentially abundant family from a pairwise comparison with Welch’sttest with 95%
confidence intervals (STAMP).eBox and whisker plot culture results from intestinal scraped samples derived from TSHR-immunized mice from Center
1 and Center 2. Results are expressed as a Log(x+ 1) transformed colony-forming units/gram feces (cfu/g).Pvalues: *P< 0.05; **P< 0.001;
differentially abundant between TSHR and βgal groups, three genera between TSHR and the untreated group, and four genera between βgal and the untreated group (Additional file3: Table S1). We found an enrichment of OTUs ofAcetitomaculumgenus in the βgal group com-pared to both TSHR (P= 0.004) and the untreated group (P= 0.003); an enrichment ofLactobacillusOTUs in the
TSHR compared to the untreated group (P= 0.018), and a reduction of Bacteroidescounts in TSHR when com-pared to theβgal group (P= 0.047). However, no signifi-cant differences were observed among immunized groups and in pairwise comparisons generated by the traditional bacterial culturing approach (Additional file3: Table S2).
Table 2Genera differentially abundant between Center 1 (n= 5) and Center 2 (n= 10) TSHR-immunized mice intestinal scraped samples
Genera Center 1: mean freq. (%) Center 2: mean freq. (%) Pvalues
Allobaculum 1.001 0.003 0.042
Alloprevotella 6.135 0.432 0.003
Bacteroides 9.370 1.525 0.017
Bifidobacterium 0.668 0.006 0.003
Clostridium XI 0.840 0.000 0.005
Coprobacter 1.835 4.226 0.033
Fusicatenibacter 0.989 3.295 0.032
Guggenheimella 0.006 0.169 0.011
Helicobacter 0.200 0.000 0.024
Intestinimonas 0.097 0.861 0.000
Lactobacillus 2.304 18.632 0.030
Lactonifactor 0.023 0.401 0.025
Meniscus 1.149 0.000 0.000
Oscillibacter 0.640 1.748 0.011
Parabacteroides 0.292 0.031 0.015
Pseudoflavonifractor 0.154 0.466 0.028
Rikenella 3.921 1.216 0.004
Turicibacter 3.629 0.000 0.002
ANOVA with Tukey’s HSD post hoc analysis (95% confidence interval), generated with STAMP. Mean freq: mean frequency (%)
Table 3Traditional microbiology results from TSHR-immunized mouse intestinal scraping from Center 1 (n= 5) and Center 2 (n= 10)
Microbial target Center 1: mean counts Center 2: mean counts Pvalues
Bacteroides 1.15E+05 b.d.l. 0.000
Bifidobacteria 6.41E+06 1.32E+06 0.057
Coliforms 3.27E+02 1.15E+03 0.453
E.coli b.d.l. 8.45E+02 0.499
Enterobacteria b.d.l. 6.82E+02 0.499
Enterococci 1.74E+05 6.10E+06 0.247
Lactobacilli 1.93E+06 4.68E+06 0.725
Staphylococci 1.31E+05 3.77E+05 0.175
Total aerobes 4.18E+05 9.90E+06 0.370
Total anaerobes 6.75E+06 7.39E+05 0.001
Total Clostridia 2.46E+04 b.d.l. 0.165
Yeast 8.72E+01 b.d.l. 0.031
In the scraped intestinal samples, we did not observe a cage effect on the composition of the large intestine microbiota (PERMANOVAP> 0.05; Fig.2d).
Dynamics of fecal microbiota during the immunization protocol
To assess whether the immunization plasmids and the duration of the protocol could have influenced the gut microbiota composition, we sequenced the bacterial 16S rRNA gene from the fecal pellets of the βgal and TSHR group from the baseline (T0) for 18 weeks afterwards, until the end of the experiment (T4).
We observed a significant increase of the richness (Chao index, Fig. 3a; P= 0.02) and the diversity
(Shannon index, Fig. 3b) over time, which was less ap-parent in the TSHR-immunized group. Significant differ-ences regarding richness between TSHR and βgal have been observed at T4 (P= 0.027, Table 4). The Shannon index of diversity, on the contrary, was significantly different between TSHR and βgal immunization at T1 (P= 0.023, Table4).
The murine fecal microbiota comprised Bacteroidetes
and Firmicutes phyla predominantly (Fig. 4c); followed
by Tenericutes, Proteobacteria Deferribacteres, and Can-didatus Saccharibacteria phyla. TheFirmicutes/ Bacteroi-detesratio has been used to describe the shift in the gut microbiota associated with aging [34] and also in disease conditions such as obesity [35]. The ratio showed
A
B
C
D
Fig. 2Gut microbiota composition in TSHR-immunized mice and control mice in Center 2 at final timepoint.aBox and whisker plots describing
the measurement of alpha diversity (Chao, ACE, and Shannon indices).bNon-metric dimensional scaling (NMDS) plot of weighted Unifrac distances
showed a spatial separation of microbial communities according to the immunizations. PERMANOVA based on 999 permutationsP= 0.001.cBoxplot
of the phylum counts according to immunizations. ANOVA on phylum counts BH adjustedP< 0.0001 and pairwiseTtest between
Bacteroidetes-Firmicutescounts adjustedP= 0.0003.dNon-Metric Dimensional Scaling (NMDS) plot based on weighted Unifrac distances shows spatial separation of the microbial community according to the immunization and caging within Center 2. Mice were co-housed according to their immunization at a maximum of four animals; cages are described by different shapes as in the legend. No significant difference in cage effect is observed. PERMANOVA
differences among the timepoints of the experimen-tal procedure (P< 0.01) and between TSHR and the
βgal group after 3 weeks from the first injection (T1, P= 0.011; Fig. 3c).
We fitted a generalized linear model (GLM) to com-pare the taxonomic counts at different timepoints within each group independently (either TSHR or βgal). Thirty-four genera have been identified as differentially abundant among all timepoints in the TSHR-immunized group (Additional file4: Table S1), while 25 were found in the βgal group (Additional file 4: Table S2). We ob-served differences in the taxonomic profile between TSHR and βgal groups at each timepoint using an exact
test (EdgeR). Once again, T1 was identified as the time-point with the highest number of genera differentially expressed, as illustrated by the diversity indices (Additional file4: Table S3).
In contrast to data obtained from the gut microbiota (Fig. 2d), a cage effect was observed in the fecal micro-biota, in particular, in interaction with time (P= 0.001) and immunization (P= 0.002; Additional file 5: Figure S1). The latter is probably due to the mice being caged according to the type of plasmid injection they received, but we also observed a significant difference within the same immunization group (e.g., TSHR in cage 4 and cage 5,P= 0.01).
:
A
B
C
Fig. 3Time-course analysis of GO preclinical fecal microbiota during the immunization protocol. Box and whisker plots of alpha diversity such as
Chao (a) and Shannon (b) indices showed differences over time.cPhylum dynamics over time and between immunizations.FirmicutesandBacteroidetes
were the most abundant phyla, showing differences with time and immunizations. Significant differences among timepoints have been observed at the
Firmicutes/Bacteroidetesratio, in particular between the baseline T0 and the last timepoint T4, but not related to immunization. A significant difference in
the ratio was observed after 3 weeks from the first injection (T1) betweenβgal and TSHR.Pvalues: *P≤0.05; **P= 0.01
Table 4Summary of the statistics from the time-course analysis of the fecal microbiota during the immunization protocol (T0–T4) and between immunizations (βgal and TSHR)
Index ANOVA model TSHR vs.βgal group
Immunization Time Time × immunization T0 T1 T2 T3 T4
Chao 0.006 0.02 0.8 0.75 0.066 0.28 0.33 0.027
Shannon 0.054 0.28 0.47 0.44 0.023 0.35 0.35 0.29
Firm:Bact 0.406 0.0003 0.16 0.39 0.028 0.46 0.2 0.26
Correlating the gut microbiota composition with clinical features and differences in GO development
We then investigated possible correlations between disease features, such as anti-TSHR antibodies, thy-roxine levels (fT4), orbital adipogenesis, and muscular atrophy, and the gut microbiota composition to deter-mine whether it contributes to the heterogeneity of induced responses, summarized in Additional file 1: Table S1.
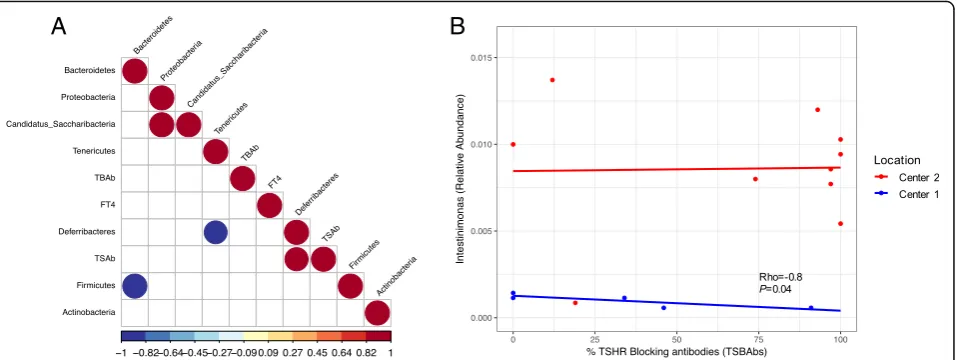
Within the Center 1 TSHR-immunized group, we found that OTUs from Firmicutes and Bacteroidetes negatively correlated to each other (Rho =−1,P< 0.0001). A positive correlation between levels of TSAb and Deferribacteres
phylum, which include one-genus Mucispirillum, was found (Rho = 0.92,P= 0.028; Fig.4a).
From those genera differentially abundant between TSHR-immunized mice from Center 1 and Center 2 (Table 2), identified via metataxonomics, we observed a strong negative correlation of the Firmicutes genus
Intestinimonas and the levels of TSBAb in the Center
1 (Rho =−0.89, P< 0.05) but not in the Center 2 counterpart (Fig. 4b). No significant correlation was observed between OTUs from the genus Intestinimo-nas and levels of TSAb or levels of free thyroxine hormone (fT4; data not shown).
On the contrary, the Box-Cox transformed counts from the traditional microbiology did not show any sig-nificant correlation with the disease features described (data not shown).
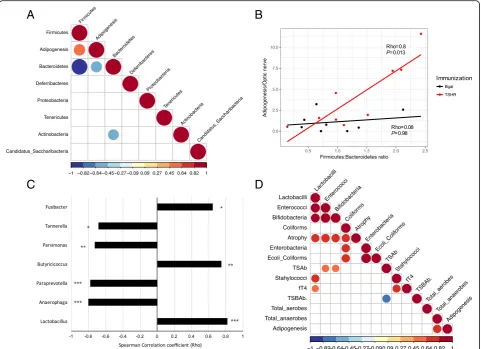
Within Center 2, Bacteroidetes and Firmicutes nega-tively correlated to each other (Rho =−0.99,P< 0.0001;
Fig.5a). We also found a significant positive correlation (Rho = 0.6, P= 0.009) between the OTUs from the
Firmicutes and the orbital adipogenesis value and a
negative correlation of this value with the phylum
Bac-teroidetes (Rho =−0.57, P= 0.014). As expected, these
correlations were specific to the TSHR-immunized mice (Fig.5b). The correlation pattern we found ( Firmi-cutespositively correlated,Bacteroidetes negatively cor-related) was also recapitulated at the genus level. Among the genera of the Firmicutes, three within the Clostridia family (Butyricicoccus, Parvimonas and
Fusi-bacter) and the genus Lactobacillus were correlated
positively with adipogenesis, while three Bacteroidetes
genera (Anaerophaga, Paraprevotella, and Tannerella) correlated negatively with the orbital adipogenesis values (Fig.5c).
A strong positive correlation (Rho = 0.82, P= 0.007) was observed between orbital adipogenesis and the total anaerobes counts obtained from the traditional microbial cultures of TSHR-immunized mice, but not in the controls (Fig. 5d). Moreover, from the trad-itional microbial cultures data, we observed correla-tions with other disease features, specifically in the TSHR group. We observed strong positive correla-tions between the muscular atrophy values and the cluster of lactobacilli (Rho = 0.74, P= 0.03), entero-cocci (Rho = 0.8, P= 0.02), bifidobacteria (Rho = 0.76,
P= 0.03), and coliforms (Rho = 0.73, P= 0.04). Levels of free thyroxine (fT4) were positively correlated with lactobacilli (Rho = 0.64, P= 0.05) and staphylococci (Rho = 0.77, P= 0.016).
A
B
Fig. 4Correlating the gut microbiota and disease features in Center 2 TSHR group.aSpearman correlation coefficient strength (Rho) of phylum
counts from TSHR mice in Center 2.FirmicutesandBacteoridetesshowed a strong negative correlation between each other. A positive correlation
between the one-genus phylumDeferribacteresand the level of thyroid-stimulating antibodies (TSAb) has been observed. Correlations withP<
0.05 are shown and strength of the Rho coefficient is represented by the change in the color intensity. fT4, free thyroid hormone thyroxine levels;
TSAb, thyroid stimulating antibodies; TSBAb, thyroid-stimulating blocking antibodies (as a percentage values).bEnrichedFirmicutesgenus
Intestinimonasbetween Center 1 (blue) and Center 2 (red) showed a strong negative correlation with the percentage of thyroid-stimulating
Discussion
Animal models have been invaluable in dissecting the mechanisms causing loss of immune tolerance leading to autoimmune conditions such as GD. Thus, we aimed to test the hypothesis that the gut microbiota may affect both outcome and reproducibility of induced auto-immune disease, such as reported in the recent research article of Berchner-Pfannschmidt and co-workers [12].
We observed significant differences in the diversity and spatial organization of the gut microbiota of female TSHR-immunized BALBc mice in two independent SPF units. We also demonstrated disease-associated microbial
taxonomies and correlation with ocular disease, suggesting that the gut microbiota have contributed to the heterogen-eity of induced response in the two locations, which fur-ther supports our hypothesis.
Animals were maintained in similar conditions. We are confident that there were no infections ongoing at the moment of sampling, since animals in both centers were routinely tested for the presence of viruses, myco-plasma and parasites (see Additional file 1: Table S2); moreover, housing facilities had comparable SPF condi-tions. Animals were from the same supplier but in differ-ent countries (Harlan Ltd. for Cdiffer-enter 1 and Harlan Lab.
A
B
C
D
Fig. 5Correlation of the gut microbiota composition with clinical features and differences in Center 2 mice.aCorrelation plot of phyla and the
orbital adipogenesis value. Spearman correlation coefficient strength (Rho) as indicated by the colored bar. Firmicutes andBacteoridetesshowed a
strong negative correlation between each other. A positive correlation betweenFirmicutesand a negative correlation withBacteroidetesOTUs and
the adipogenesis value (calculated in the orbit) has been observed. Adipogenesis clustered closer to the Firmicutes and Bacteroidetes value according
to the complete linkage method for hierarchical clustering. OnlyP< 0.05 are shown.bPositive strong correlation of theFirmicutes/Bacteroidetesratio
with the adipogenesis value (calculated in the orbit) resulted significant in TSHR-immunized group but not in theβgal group.cSpearman correlation
coefficient (Rho) of genera among phylaBacteroidetesandFirmicutesand the orbital adipogenesis values. The strength of the correlation coefficient is
represented onx-axis: bars on the left represent a negative correlation coefficient, while bars on the right represent a positive correlation coefficient.
Correlations withP< 0.05 are shown; order of entrance depends on theirPvalues: *P< 0.05; **P< 0.1; ***P< 0.005.dSpearman correlation
coefficient plot of the Box-Cox transformed microbiological counts and disease features in Center 2 TSHR-immunized mice. Feature clustering was
according to the complete linkage method for hierarchical clustering. Only correlations withP< 0.05 are shown and strength of the correlation
BV for Center 2), had received autoclaved water, and had been fed similar commercial chow, with the excep-tion that food pellets provided in Center 2 contained twice the amount of iodide compared to Center 1 food (see Additional file1: Table S3). Although iodide excess can be associated with abnormal thyroid function, we do not consider that this dietary variation is enough to ex-plain the results (i.e., elevated thyroxine levels were ap-parent in the Center 1 but not in the Center 2 mice). The effect of iodine has been studied in the NOD mouse which spontaneously develops autoimmune thyroiditis. Vecchiatti and colleagues [36] reported that excess iod-ine (0.2 mg/mouse/day) increased the incidence and se-verity of disease; however, the BALB/c mice in our study did not display thyroiditis. A transgenic NOD mouse ex-pressing the human TSHR-A subunit is able to develop antibodies to the human TSHR and this too is exacer-bated by iodine excess [37] but at levels far greater than in the chow used in Centers 1 and 2. We also considered whether iodine could affect the gut microbiota, in view of its use as an antiseptic, but all the studies we found were in this context, rather than the effect of dietary iod-ine on symbionts. The importance of SPF conditions is indicated by a previous study which failed to reproduce a GO animal model, despite using mice from the same supplier and identical bedding, water, and chow [10]. However, even SPF may be inadequate since differences were found in the gut microbiota of C57BL/6 colonies bred in two different rooms of the same SPF facility [38], fortunately mice in our study were all housed in the same room.
Cage effects were apparent in the fecal microbiota results, which highlight the importance of studying the gut micro-biota instead when comparing autoantigen (TSHR)-immu-nized and control mice, which are in the close proximity of the intestinal mucosa and the immune system, enabling us to explore its relationship with disease features.
We observed several disease-associated taxonomies; the abundance of the newly described butyrate-producing genus Intestinimonas [39] was reduced in the Center 1 group compared to Center 2 and correlated negatively with TSBAb. The Intestinimonas species butyroproducens
has a unique ability to produce butyrate from lysine and is involved in the detoxification of advanced glycosylation end (AGE) products such as fructoselysin, which have been linked to type 1 diabetes [40], although we are un-aware of any link between butyrate-producing bacteria and thyroid autoimmunity.
The TSHR-immunized group developed some signs of GO and their gut microbiota had increased OTUs of the phylum Firmicutes but decreased Bacteroidetes
compared with controls. This mirrors our prelimin-ary data in human disease where we observed a dra-matic reduction in the Bacteroides genus in GD
patients when they develop GO (INDIGO publish-able summary1).
We also obtained a positive correlation between
sev-eral Firmicutes counts, such as Clostridia and Bacilli,
with orbital adipogenesis in Center 2 TSHR-immunized mice. Million and co-workers have previously reported a positive correlation between OTUs from the Firmicutes
and weight gain/obesity in both animal models and humans [41]. Interestingly, the role of the genus Lacto-bacillus and its products in either triggering or protect-ing from adipogenesis has been debated and seems to be species-specific.
In the present work, we could exclude a possible gain-of-weight relationship with the adipogenesis value calculated in the orbit since no changes in mouse weights have been observed during the development of the chronic phase of the disease (data not shown). Fur-thermore, molecular mechanisms driving obesity and or-bital adipogenesis may well be different, since the latter is derived from the neural crest and the gut microbiota may have varying effects on different fat depots [42].
Our time-course analysis revealed that time had a dramatic role in shaping the fecal microbiota of the female mice which were 6–8 weeks old at the outset and 24–26 weeks at the end of the experiment, con-firming the work of McCafferty and colleagues [43]. The richness and diversity of βgal control mice in-creased with age but this was less apparent in TSHR-immunized animals. Significant differences in microbiota composition between control and TSHR immunizations were most apparent 3 weeks after the first immunization, at the initiation of the induced immune response.
Our control group comprised mice immunized with the βgal expression plasmid in which we observed a slight skew in the microbiota richness and diversity which may be caused by the systemic overexpression of the β-galactosidase enzyme, whose natural role is in glycan metabolism, e.g., the hydrolysis of the lac-tose to galaclac-tose and glucose [44]. Kaneda and collab-orators reported a βgal overexpression peak in the muscle fibers following electroporation from 5 days to 2 weeks after the injection [45].
It may be that the increased OTUs of the Firmicutes
βgal (P= 0.024), than untreated (P= 0.04) mice in their own center (Additional file 6: Figure S1).
The results we obtained using 16S rRNA gene meta-taxonomics and via the traditional microbial culture ap-proach were largely similar, with relatively few differences. Microbial cultures revealed significantly higher yeast counts (P= 0.03186) in Center 2 TSHR-immunized mice—which obviously could not be seen via the bacterial metataxonomics—and a nearly sig-nificant difference in theActinobacteriagenus
Bifidobac-terium (P= 0.057), which was not detected in our
metataxonomics data. Primers based on the V1–V2 re-gions of the 16S rRNA gene did not detect Bifidobacter-ium OTUs. Consequently, we applied a new set of primers (28F-combo) with which we observed a signifi-cant enrichment of bifidobacteria counts in Center 2 (Additional file 7: Figure S1), in agreement with the mi-crobial culture results.
Conclusions
In conclusion, our results indicate a role for the gut microbiota in modulating the heterogeneity apparent in the TSHR-induced model of GD and GO. In our next study, we will report the effects on our induced model of modifying the gut microbiota using antibiotics, pro-biotics, and fecal material transfer.
Our future studies will investigate whether the pres-ence, abspres-ence, or amounts of certain bacteria or yeast have the ability to directly alter the immune balance be-tween the Treg anti-inflammatory response and the Th17-mediated pro-inflammatory response in the gut mucosa as has been reported in models of other auto-immune diseases [22, 46]. Results of these experiments could then be confirmed by colonization studies in gnotobiotic animals. Factors such as level of dietary iod-ine intake and age of mice at immunization, which may both alter the gut microbiota and/or immune respon-siveness, are also warranted.
Endnotes 1
INDIGO publishable summary: http://www.indigo-iap-p.eu/publishable-summary/
Additional files
Additional file 1:Figure S1.Schematic representation of the GO
immunization protocol and sample collection.Table S1.Summary of
disease characteristics induced in mice in Center 1 and Center 2 using
TSHR expression plasmid illustrating the heterogeneity of response.Table
S2.Quarterly Health Screen Reports on viral, bacterial, mycoplasma and
parasite screen in both centers.Table S3.Composition of the
commercial chows provided ad libitum in Center 1 and Center 2. (DOCX 106 kb)
Additional file 2:Supplementary methods. (DOCX 121 kb)
Additional file 3:Table S1.Differential abundant taxonomic analysis
between TSHR (n= 10),βgal (n= 8), and untreated (n= 6), within Center
2. Welch’s T-test with 95% confidence interval using STAMP. Mean relative
frequency, rel. freq. Standard deviation, std. dev.Table S2.Comparison of
intestinal scraped samples from different immunization within Center 2 from the traditional microbiological culture. Data were Box-Cox transformed. (XLSX 43 kb)
Additional file 4:Table S1.Generalized linear model (GLM) of genera counts differentially present in TSHR-immunized mice over timepoints, in reference to the baseline (T0) using EdgeR. LogFC, Log2 fold change
between each timepoint and the baseline (T0); LR, likelihood ratio.Table
S2.Generalized linear model (GLM) of genera counts inβgal control mice
over timepoints using EdgeR. LogFC, Log2 fold change between each
timepoint and the baseline (T0); LR, likelihood ratio.Table S3.Pairwise
comparison of TSHR andβgal mice using Fisher’s Exact Test in EdgeR at
each timepoint (T0 to T4). LogFC, Log2 fold change ofβgal compared to
TSHR. (XLSX 46 kb)
Additional file 5:Figure S1. Temporal stability of fecal microbiota and cage effect of the immunizations. Weighted Unifrac distances of mice fecal microbial communities represented over the time course of the experiment according to the immunization (A) or the cage (B). Permutational MANOVA of weighted Unifrac distances according to timepoint, immunizations, caging, and their interactions (time × cage; time × immunization; immunization × cage) as described in
Additional file2. The time had a significant effect on the stability of the
fecal microbiota (P= 0.001), in particular between the baseline (T0) and
the last timepoint (T4,P= 0.003); and between the T1 and T4 (P= 0.009).
The interaction between time and immunization was significant (P=
0.007). Cage was also significant, in particular the interaction cage ×
timepoint (P= 0.001) and cage × immunization (P= 0.002). Significant
differences within the same immunization group cage has been
observed (TSHR group in C4 and C5,P= 0.01). (PDF 152 kb)
Additional file 6:Figure S1.NMDS plot based on the weighted Unifrac distances of Center2 immune and control mice including TSHR-immunized mice from Center 1. TSHR-TSHR-immunized mice from Center 1
were more similar to TSHR-immunized mice from Center 2 (P= 0.2) than
to theβgal (P= 0.024) than the untreated (P= 0.04). (PDF 28 kb)
Additional file 7:Figure S1.Bifidobacteriumcounts derived from the
28F-combo primers in the TSHR-immunized mice in Center 1 (n= 5) and
Center 2 (n= 10). ANOVA with Tukey’s HSD post hoc analysis (95%
confidence interval),Pvalue = 0.003 generated with STAMP. (PDF 21 kb)
Abbreviations
ACE:Abundance-based coverage estimator; AGE: Advanced glycosylation
end; CNS: Central nervous system; EAE: Experimental autoimmune encephalomyelitis; FDR: False discovery rate; fT4: Thyroid hormone thyroxine;
GD: Graves’disease; GLM: Generalized linear model; GO: Graves’orbitopathy
or ophthalmopathy; HSD: Honest significant difference; NMDS: Non-metric dimensional scaling; OTU: Operational taxonomic unit;
PERMANOVA: Permutational multivariate analysis of variance; RDP: Ribosomal Database Project; SFB: Segmented filamentous bacteria; SPF: Specific-pathogen-free; TRAB: Thyroid-stimulating hormone autoantibodies; Treg: Regulatory T cells; TSAb: Thyroid-stimulating antibodies;
TSBAb: Thyroid-stimulating blocking antibodies; TSH: Thyroid-stimulating
hormone; TSHR: Thyrotropin receptor;βgal:β-Galactosidase enzyme
Acknowledgements
We acknowledge the work of the other members of the INDIGO consortium: Mario Salvi, Lei Zhang, Giuseppe Colucci, Daryn Michael, and Iveta Garaiova. We also acknowledge the invaluable help of Dr. Ann Smith.
Funding
Supported by Marie-Sklodowska Curie Industry Industry-Academia Pathways and Partnerships (IAPP) action, GA number 612116 project INDIGO. Deutsche
Availability of data and materials
The datasets used and/or analyzed during the current study are available from the corresponding author on reasonable request, since we are waiting for the repository accession number.
Authors’contributions
SM collected the data and was involved in writing the report with GM and HLK. GM analyzed the data with FB and JRM. HLK, DC, JPB, UBP, MH, SDC, GEG, SP, and AE contributed to the study design and sample collection. ML designed and managed the project, supervised the analyses, and
contributed to the report. All authors read and agreed to the final version of the manuscript.
Ethics approval and consent to participate
The study was approved by the North Rhine Westphalian State Agency for Nature, Environment and Consumer Protection, Germany and by the Ethics
Committee of King’s College London, United Kingdom (UK).
Competing interests
The authors declare that they have no competing interests.
Publisher’s Note
Springer Nature remains neutral with regard to jurisdictional claims in published maps and institutional affiliations.
Author details
1
Division of Infection & Immunity, School of Medicine, Cardiff University, UHW main building, Heath Park, Cardiff CF14 4XW, UK.2Departments of
Bioinformatics, PTP Science Park Srl, via Einstein loc. Cascina Codazza, 29600 Lodi, Italy.3Molecular Ophthalmology, Department of Ophthalmology,
University Hospital Essen/University of Duisburg-Essen, 45147 Essen, Germany.4Faculty of Life Sciences and Medicine, King’s College London,
London SE5 9NU, UK.5Latner Thoracic Surgery Laboratories, Toronto General Research Institute, University Health Network and University of Toronto, Toronto M5G 1L7, Canada.6Cultech Ltd., Baglan, Port Talbot SA127BZ, UK.
7University Hospital Essen, University of Duisburg-Essen, Institute of Medical
Microbiology, 45147 Essen, Germany.8Graves’Orbitopathy Center, Endocrinology, Department of Clinical Sciences and Community Health, Fondazione Ca’Granda IRCCS, University of Milan, via Sforza 35, 20122 Milan, Italy.9King’s College Hospital NHS Foundation Trust (SDC), London SE5 9RS,
UK.10Italian National Council for Research (CNR), via Bassini 15, 20133 Milan, Italy.11School of Biosciences, Cardiff University, Sir Martin Evans Building,
Museum Avenue, Cardiff CF10 3AX, UK.12Center for Digestive and Gut Health, Imperial College London, W2 1NY, London, UK.13INDIGO
Consortiumhttp://www.indigo-iapp.eu.
Received: 18 October 2017 Accepted: 8 May 2018
References
1. Ericsson AC, Davis JW, Spollen W, Bivens N, Givan S, et al. Effects of vendor
and genetic background on the composition of the fecal microbiota of inbred mice. PLoS One. 2015;10:e0116704.
2. Hufeldt MR, Nielsen DS, Vogensen FK, Midtvedt T, Hansen AK. Variation in
the gut microbiota of laboratory mice is related to both genetic and
environmental factors. Compar Med. 2010;60:336–47.
3. Draman M, Ludgate M. Thyroid eye disease—an update. Exp Rev
Ophthalmol. 2016;11:1–12.
4. McLachlan SM, Rapoport B. Breaking tolerance to thyroid antigens:
changing concepts in thyroid autoimmunity. Endocr Rev. 2014;35:59–105.
5. Morshed SA, Davies TF. Graves’disease mechanisms: the role of stimulating,
blocking and cleavage region TSHR receptor antibodies. Horm Metab Res.
2015;47(Suppl 10):727–34.
6. Bahn RS. Graves’ophthalmopathy. New Engl J Med. 2010;362:726–38.
7. Banga JP, Moshkelgosha S, Berchner-Pfannschmidt U, Eckstein A. Modelling
Graves’orbitopathy in experimental Graves’disease. Horm Metab Res. 2015;
doi:https://doi.org/10.1055/s-0035-1555956.
8. Ludgate M. Animal models of Graves’disease. Eur J Endocrinol. 2000;
142:1–8.
9. Many MC, Costagliola S, Detrait M, Denef JF, Vassart G, Ludgate M.
Development of an animal model of autoimmune thyroid eye disease. J
Immunol. 1999;162:4966–74.
10. Baker G, Mazziotti G, von Ruhland C, Ludgate M. Reevaluating thyrotropin
receptor-induced mouse models of Graves’disease and ophthalmopathy.
Endocrinology. 2005;146:835–44.
11. Bhattacharyya KK, Coenen MJ, Bahn RS. Effect of environmental pathogens
on the TSHR-directed immune response in an animal model of Graves’
disease. Thyroid 2005;15:422–6.
12. Berchner-Pfannschmidt U, Moshkelgosha S, Diaz-Cano S, Edelmann B, Görtz
G-EE, Horstmann M, et al. Comparative assessment of female mouse model
of Graves’orbitopathy under different environments, accompanied by
pro-inflammatory cytokine and T cell responses to thyrotropin hormone
receptor antigen. Endocrinology. 2016;157:1673–82.
13. Moshkelgosha S, So P-W, Deasy N, Diaz-Cano S, Banga J. Retrobulbar
inflammation, adipogenesis, and acute orbital congestion in a preclinical
female mouse model of Graves’orbitopathy induced by thyrotropin
receptor plasmid-in vivo electroporation. Endocrinology. 2013;154:3008–15.
14. Murri M, Leiva I, Gomez-Zumaquero JM, Tinahones FJ, Cardona F, et al. Gut
microbiota in children with type 1 diabetes differs from that in healthy children: a case-control study. BMC Med. 2013;11:46.
15. Brown CT, Davis-Richardson AG, Giongo A, Gano KA, Crabb DB, et al. Gut
microbiome metagenomics analysis suggests a functional model for the development of autoimmunity for type 1 diabetes. PLoS One. 2011;6:25792.
16. Frank DN, St. Amand AL, Feldman RA, Boedeker EC, Harpaz N, Pace NR.
Molecular-phylogenetic characterization of microbial community imbalances in human inflammatory bowel disease. Proc Natl Acad Sci U S
A. 2007;104:13780–5.
17. Scanlan PD, Shanahan F, O’Mahony C, Marchesi JR. Culture-independent
analyses of temporal variation of the dominant fecal microbiota and
targeted bacterial subgroups in Crohn’s disease. J Clin Microbiol. 2006;44:
3980–8.
18. Laukens D, Brinkman BM, Raes J, De Vos M, Vandenabeele P. Heterogeneity
of the gut microbiome in mice: guidelines for optimizing experimental
design. FEMS Microbiol Rev. 2016;40:117–32.
19. Ochoa-Repáraz J, Mielcarz DW, Ditrio LE, Burroughs AR, Foureau DM, et al.
Role of gut commensal microflora in the development of experimental
autoimmune encephalomyelitis. J Immunol. 2009;183:6041–50.
20. Lee YK, Menezes JS, Umesaki Y, Mazmanian SK. Proinflammatory T-cell
responses to gut microbiota promote experimental autoimmune
encephalomyelitis. Proc Natl Acad Sci U S A. 2011;108(Suppl 1):4615–22.
21. Covelli D, Ludgate M. The thyroid, the eyes and the gut: a possible connection.
J Endocrinol Investig. 2017;https://doi.org/10.1007/s40618-016-0594-6.
22. Zhao SX, Tsui S, Cheung A, Douglas RS, Smith TJ, Banga JP. Orbital fibrosis
in a mouse model of graves’disease induced by genetic immunization of
thyrotropin receptor cDNA. J Endocrinol. 2011;210:369–77.
23. Box GEP, Cox DR. An analysis of transformations. J R Stat Soc B. 1964;26:
211–43.
24. Schloss PD, Westcott SL, Ryabin T, Hall JR, Hartmann M, et al. Introducing
mothur: open-source, platform-independent, community-supported software for describing and comparing microbial communities. Appl
Environ Microbiol. 2009;https://doi.org/10.1128/AEM.01541-09.
25. Edgar RC, Haas BJ, Clemente JC, Quince C, Knight R. UCHIME improves
sensitivity and speed of chimera detection. Bioinformatics. 2011;27:
2194–200.
26. Cole JR, Wang Q, Cardenas E, Fish J, Chai B, et al. The ribosomal database
project: improved alignments and new tools for rRNA analysis. Nucl Acids
Res. 2009;37:D141–5.
27. Price MN, Dehal PS, Arkin AP. FastTree 2–approximately
maximum-likelihood trees for large alignments. PLoS One. 2010;5:e9490.
28. Parks DH, Tyson GW, Hugenholtz P, Beiko RG. STAMP: statistical analysis of
taxonomic and functional profiles. Bioinformatics. 2014;https://doi.org/10.
1093/bioinformatics/btu494.
29. Lozupone C, Lladser ME, Knights D, Stombaugh J, Knight R. UniFrac: an
effective distance metric for microbial community comparison. ISME J. 2011;
5:169–72.
30. Anderson MJ. A new method for non-parametric multivariate analysis of
variance. Austral Ecol. 2001;26:32–46.
31. Robinson MD, McCarthy DJ, Smyth GK. edgeR: a Bioconductor package for
differential expression analysis of digital gene expression data.
32. Köhling HL, Plummer SF, Marchesi JR, Davidge KS, Ludgate M. The microbiota and autoimmunity: their role in thyroid autoimmune diseases.
Clin Immunol. 2017;https://doi.org/10.1016/j.clim.2017.07.001.
33. Chao A. Species estimation and application. In: Kotz S, Balakishnan N,
et al., editors. Encyclopedia of statistical sciences. New York: Wiley;
2005. p. 7907–15.
34. Mariat D, Firmesse O, Levenez F, Guimarăes VD, Sokol H, et al. The
firmicutes/bacteroidetes ratio of the human microbiota changes with age. BMC Microbiol. 2009;9:123.
35. Ley RE, Turnbaugh PJ, Klein S, Gordon JI. Microbial ecology: human gut
microbes associated with obesity. Nature. 2006;444:1022–3.
36. Vecchiatti S, Guzzo M, Caldini E, Bisi H, Longatto-Filho A, et al. Iodine
increases and predicts incidence of thyroiditis in NOD mice:
histopathological and ultrastructural study. Exp and therap med. 2013;5:
603–7.
37. Rapoport B, Aliesky HA, Banuelos B, Chen C-RR, McLachlan SM. A
unique mouse strain that develops spontaneous, iodine-accelerated, pathogenic antibodies to the human thyrotrophin receptor. J Immunol.
2015;194:4154–61.
38. Jakobsson H, Rodríguez-Piñeiro A, Schütte A, Ermund A, Boysen P, et al. The
composition of the gut microbiota shapes the colon mucus barrier. EMBO
Rep. 2015;16:164–77.
39. Kläring K, Hanske L, TPN B, Charrier C, Blaut M, et al. Intestinimonas
butyriciproducens gen. nov., sp. nov., a butyrate-producing bacterium from
the mouse intestine. Int J Syst Evol Microbiol. 2013;https://doi.org/10.1099/
ijs.0.051441-0.
40. Bui TPN, Ritari J, Boeren S, de Waard P, Plugge CM, Vos WM. Production of
butyrate from lysine and the Amadori product fructoselysine by a human gut commensal. Nat Commun. 2015;6:10062.
41. Million M, Lagier JC, Yahav D, Paul M. Gut bacterial microbiota and obesity.
Clin Microb Inf. 2013;19:305–13.
42. Anderson DJ, Axel R. Molecular probes for the development and plasticity
of neural crest derivatives. Cell. 1985;42(2):649–62.
43. McCafferty J, Mühlbauer M, Gharaibeh R, Arthur J, Perez-Chanona E, et al.
Stochastic changes over time and not founder effects drive cage effects in
microbial community assembly in a mouse model. ISME J. 2013;7:2116–25.
44. Juers DH, Matthews BW, Huber RE. LacZ galactosidase: structure and
function of an enzyme of historical and molecular biological importance.
Protein Sci. 2012;21:1792–807.
45. Kaneda T, Honda A, Hakozaki A, Fuse T, Muto A, Yoshida T. An improved
graves’disease model established by using in vivo electroporation exhibited
long-term immunity to hyperthyroidism in BALB/c mice. Endocrinology.
2007;148:2335–44.
46. Wu H-J, Ivanov I, Darce J, Hattori K, Shima T, et al. Gut-residing segmented
filamentous bacteria drive autoimmune arthritis via T helper 17 cells.