T E C H N I C A L A D V A N C E
Open Access
Targeted next generation sequencing as a
tool for precision medicine
Markus Gulilat
1,2, Tyler Lamb
2, Wendy A. Teft
1, Jian Wang
3, Jacqueline S. Dron
3, John F. Robinson
3,
Rommel G. Tirona
1,2, Robert A. Hegele
3, Richard B. Kim
1,2and Ute I. Schwarz
1*Abstract
Background:Targeted next-generation sequencing (NGS) enables rapid identification of common and rare
genetic variation. The detection of variants contributing to therapeutic drug response or adverse effects is essential for implementation of individualized pharmacotherapy. Successful application of short-read based NGS to pharmacogenes with high sequence homology, nearby pseudogenes and complex structure has been previously shown despite anticipated technical challenges. However, little is known regarding the utility of such panels to detect copy number variation (CNV) in the highly polymorphic cytochrome P450 (CYP) 2D6
gene, or to identify the promoter (TA)7 TAA repeat polymorphism UDP glucuronosyltransferase (UGT) 1A1*28. Here we developed and validated PGxSeq, a targeted exome panel for pharmacogenes pertinent to drug disposition and/or response.
Methods: A panel of capture probes was generated to assess 422 kb of total coding region in 100 pharmacogenes. NGS was carried out in 235 subjects, and sequencing performance and accuracy of variant discovery validated in clinically relevant pharmacogenes.CYP2D6CNV was determined using the bioinformatics tool CNV caller (VarSeq). Identified SNVs were assessed in terms of population allele frequency and predicted functional effects through in silico algorithms.
Results:Adequate performance of the PGxSeq panel was demonstrated with a depth-of-coverage (DOC)≥20×
for at least 94% of the target sequence. We showed accurate detection of 39 clinically relevant gene variants compared to standard genotyping techniques (99.9% concordance), including CYP2D6 CNV and UGT1A1*28. Allele frequency of rare or novel variants and predicted function in 235 subjects mirrored findings from large genomic datasets. A large proportion of patients (78%, 183 out of 235) were identified as homozygous carriers of at least one variant necessitating altered pharmacotherapy.
Conclusions: PGxSeq can serve as a comprehensive, rapid, and reliable approach for the detection of
common and novel SNVs in pharmacogenes benefiting the emerging field of precision medicine.
Keywords: Targeted exome sequencing, Next generation sequencing, Pharmacogenes, Copy number variation,
In silico prediction
© The Author(s). 2019Open AccessThis article is distributed under the terms of the Creative Commons Attribution 4.0 International License (http://creativecommons.org/licenses/by/4.0/), which permits unrestricted use, distribution, and reproduction in any medium, provided you give appropriate credit to the original author(s) and the source, provide a link to the Creative Commons license, and indicate if changes were made. The Creative Commons Public Domain Dedication waiver (http://creativecommons.org/publicdomain/zero/1.0/) applies to the data made available in this article, unless otherwise stated.
* Correspondence:[email protected]
1Division of Clinical Pharmacology, Department of Medicine, Western University, London Health Sciences Centre - University Hospital, 339 Windermere Road, London, ON N6A 5A5, Canada
Background
Rapid identification of genetic variation contributing to therapeutic drug response or adverse effects is essential for implementation of individualized pharmacotherapy [1]. Many gene-drug associations are now recognized as clinic-ally relevant, particularly those involving genes encoding drug metabolizing enzymes, membrane transporters, and certain drug targets, which together are often referred to as pharmacogenes [2]. Clinical guidelines have been developed for drugs with the strongest level of evidence of utility for pharmacogenetic testing in patients. For instance, the Clin-ical Pharmacogenetics Implementation Consortium (CPIC), an international expert group, documents the available evi-dence and provides recommendations for clinicians on genotype-based drug therapy [3]. CPIC guidelines have now been reported for more than 35 drugs including the anti-coagulant warfarin [4,5], the antiplatelet agent clopidogrel [6, 7], the cholesterol- lowering medication simvastatin [8], chemotherapeutics such as thiopurines (azathioprine and mercaptopurine) [9,10], tamoxifen [11], and fluoropyrimi-dines [12], as well as the antiretroviral therapeutics abacavir [13] and atazanavir [14]. As well, many pharmacogenetic biomarkers have been incorporated in drug labels by the US Food and Drug Administration [15] and the European Med-icines Agency [16].
Earlier research evaluated common functional vari-ation in pharmacogenes, while more recent large-scale whole genome or exome sequencing studies revealed that humans harbor a large number of rare, potentially deleterious variants in many of the same genes [17–20]. Specifically, the analysis of sequencing data for 146 phar-macogenes combining about 7500 individuals of the
Ex-ome Sequencing Project (ESP) [21] and the 1000
Genomes Project (1000G) [22] indicated that more than 90% of all recorded single nucleotide variants (SNVs) were rare with a minor allele frequency (MAF) below 1%, and that 30–40% of the predicted functional variabil-ity was associated with these rare variants [17]. Recent studies also support that rare SNVs in drug processing or drug target genes significantly contribute to interpati-ent differences in drug disposition and response beyond established common genetic predictors as shown for cytochrome P450 (CYP)2C9 and warfarin dose require-ment [23, 24] and solute carrier organic anion
trans-porter (SLCO) 1B1 and methotrexate clearance and
toxicity [25].
Next-generation sequencing (NGS) refers to rapid, high-throughput technologies that enable massively paral-lel DNA sequencing of entire human genomes, exomes or coding exons of select genes [26]. Targeted exome NGS capture panels are gaining popularity for pharmacogenetic testing due to their time- and cost-effectiveness, and abil-ity to simultaneously detect common and rare genetic variation [27,28]. Despite anticipated technical challenges
for the application of short-read based NGS to genes with high sequence homology, nearby pseudogenes and com-plex structure [29–31], these limitations might be over-come through careful probe design (i.e. target enrichment [32]) combined with advanced bioinformatics approaches as suggested by previous reports [27,28,33]. However, lit-tle is currently known regarding the utility of such panels to detect copy number variation (CNV) in the highly poly-morphicCYP2D6gene, or to identify the promoter (TA)7 TAA repeat polymorphism UDP glucuronosyl-transferase (UGT) 1A1*28, two common polymorphisms known to affect enzymatic activity and alter dose requirements for
substrate drugs [34, 35]. Therefore, we created a
NGS-based exome capture panel (PGxSeq) capable of de-tecting clinically established as well as novel genetic vari-ation with potential implicvari-ations in drug disposition and response. We applied our PGxSeq panel to 1) evaluate the sequencing performance achieved with the utilized target-enrichment strategy, 2) determine the accuracy of variant discovery in clinically relevant pharmacogenes compared to
traditional genotyping methods including CYP2D6 CNV
and UGT1A1*28, and 3) evaluate the identified variation with respect to population allele frequencies and predicted functional effects.
Methods
Sample collection
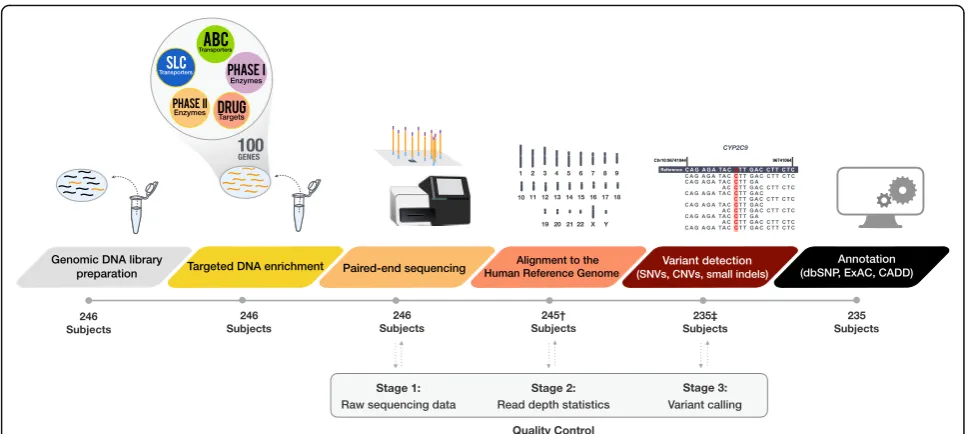
Genomic DNA (gDNA) was obtained from venous blood samples of 246 Caucasian subjects (220 adult and 26 pediatric patients) following written informed consent. Studies were approved by the Research Ethics Board of Western University, London, Canada. A flow diagram of the sample and subsequent data processing can be found in Fig.1.
Gene selection, capture probe design and enrichment method
We used the Nextera Rapid Capture Custom Enrichment Kit (Illumina, San Diego, CA) for the enrichment of cod-ing regions of 100 genes encodcod-ing major cytochrome P450 (CYP) enzymes, phase II conjugation enzymes, drug transporters of the solute carrier (SLC) and ATP binding cassette (ABC) families as well as regulatory proteins of relevance to variability in drug ADME (absorption, distri-bution, metabolism, excretion) and response including re-gions encompassing 14 known functional promoter or
intronic SNVs such as UGT1A1*28, CYP3A5*3, and
CYP2D6*41 (Additional file1: Table S1 and S2).
exon) and 250 bp of 5′and 3′untranslated regions (UTR). Known functional non-coding variants were separately tar-geted if not captured otherwise (Additional file1: Table S2). Chromosomal coordinates were obtained from University of California Santa Cruz (UCSC) genome browser using the GRCh37/hg19 human genome assembly. DNA library prep-aration and subsequent target-capture sequencing was con-ducted at the London Regional Genomics Center, London, Ontario, as previously described [36]. Briefly, DNA samples were processed in 13 runs in batches of 12 or 24 samples (referred to as sequencing cluster). After serial dilutions, DNA was adjusted to a final concentration of 5.0 ± 1 ng/μl using the Qubit DNA kit (Invitrogen, Eugene, OR). DNA was enzymatically fragmented, polymerase chain reaction (PCR)-amplified with individual sample barcodes, equimolar pooled, hybridized to the biotinylated capture probes, pooled using streptavidin beads, and PCR-amplified again to select the final target sequence. Resulting libraries were quantified, and loaded on to a standard flow-cell on the Illu-mina MiSeq Sequencer (IlluIllu-mina, San Diego, CA) using 2 × 300 bp or 2 × 150 bp paired-end chemistry.
Base calling, sequence alignment and variant detection
Prior to the alignment of reads to the reference genome, sequencing performance metrics were assessed (Fig. 1). Paired-end sequenced reads were separated according to sample-specific barcodes and sequencing data down-loaded as FASTQ files that were further assessed with the quality control tool, FastQC [37], including read count, base quality across reads (also Phred score, Q; describes the probability of a sequencing error as a measure of base
call accuracy), and guanine and cytosine (GC) content per sequence [38].
Alignment of sequencing reads and variant calling were performed using the CLC Bio Genomics Workbench 9.0 (CLC Bio, Aarhus, Denmark) through a custom auto-mated workflow. FASTQ files were imported and mapped to the reference human genome (GRCh37/hg19 build). Using default algorithms (i.e. Local Realignment and Re-move Duplicate Mapped Reads), initial read mapping was further optimized around insertion-deletion mutations (indels) and PCR duplicates removed.
Depth-of-coverage (DOC; also coverage) was defined as the number of reads mapped to a genomic position following alignment of sequenced reads and removal of duplicate reads. Reads that were non-specific matches (mapped to more than one location of hg19 reference genome) or missing the paired read were excluded from this calculation. For every subject, a Coverage Summary Report along with a base-by-base Coverage Table were exported. Coverage analysis was restricted to coding re-gions including 10 bp before and after each exon, and 250 bp of 3′ and 5’UTR. To detect samples with sub-stantial regions of low coverage, we expressed coverage as percentage of the 422 kb target sequence with a DOC ≥1×, ≥ 10×, ≥ 20×, and≥30× (Table 1). Subjects with more than 20% of their target sequence below 10× were excluded from variant analysis. Coverage was also assessed at the gene level and by sequencing cluster (n= 12 or 24).
To further ensure accuracy of variant and genotype call-ing, quality-based variant detection tools were employed with the following parameters: diploid organism, probability
of non-reference allele ≥95% (versus sequencing error), ≥ 10-fold coverage (10×),≥20% read frequency, and≥30 per base quality score at the variant location. Resulting se-quence variation reports were exported in variant call for-mat (VCF) for downstream annotation.
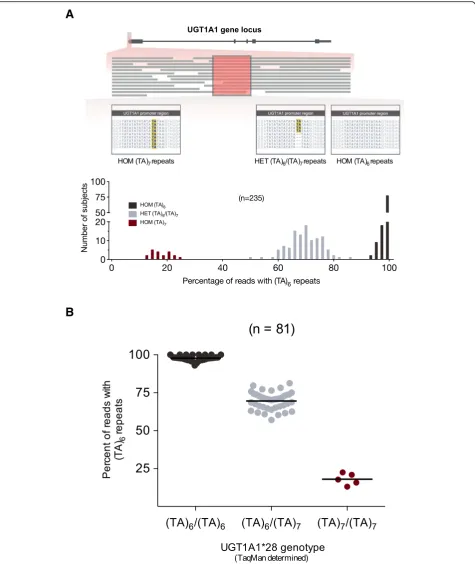
UGT1A1*28 carrier status was separately determined by manually assessing the number of TA repeats in the NGS sequence of individual reads mapped to the pro-moter region (n= 235). Each subject’s promoter region was interpreted as the percentage of mapped reads with six TA (TA)6repeats, with subject values clustering into three separate groups in a histogram (Fig.4a). We
evalu-ated concordance of UGT1A1*28 genotype determined
by NGS with a previously reported TaqMan assay [39] in a subgroup of 81 subjects.
CYP2D6 whole gene CNV was determined from NGS data using the bioinformatics tool CNV caller, an applica-tion within the VarSeq v1.3.4 variant annotaapplica-tion software (Golden Helix, Bozeman, MT), as previously described by Iacocca et al. [40]. VarSeq CNV caller identifies probable CNV carriers through coverage analysis, by normalizing the coverage across theCYP2D6gene for samples of inter-est compared to a reference control group (2 gene copies). CNV analysis was restricted to samples processed in the 24- sequencing cluster runs (n= 183) to minimize con-founding of sample preparation on coverage. First, we
de-termined theCYP2D6CNV status in 48 samples using a
TaqMan CNV assay (Hs04502391_cn), from which 30 subjects with 2CYP2D6copies were selected for our ref-erence control group. CNV status for the remaining sub-jects was then determined using this reference group. Only subjects that were found to be positive for a CNV (deletion or duplication) were further confirmed among the remaining 135 subjects using the TaqMan CNV assay.
Variant annotation and in silico functional assessment
Functional annotation of SNVs was carried out using ANNOVAR [41] through in silico prediction algorithms such as Combined Annotation Dependent Depletion (CADD) [42], Sorting Intolerant from Tolerant (SIFT)
[43], and PolyPhen-2 [44], and variant frequency among different populations was determined utilizing large gen-omic databases (Reference Sequence [RefSeq], Single Nu-cleotide Polymorphism database build 150 [dbSNP150], 1000 Genomes, Exome Aggregation Consortium [ExAC]) obtained October 17, 2018. SNVs with a CADD Phred score (scaled) greater than 20 [42], a SIFT score of less than 0.05 [43], or a PolyPhen-2 score of greater than 0.85 [44] were considered as potentially functional variants (al-tering protein function), and herein defined as deleterious. Variants were classified as 1) non-synonymous (coding variants resulting in amino acid change), 2) synonymous (coding variants without amino acid changes), 3) frame-shift deletion or insertion (in-del), 4) splicing (2 nucleo-tides within an intron-exon boundary), 5) stop gain or loss, or 6) functional intronic or promoter variants. Coding var-iants were further grouped by MAF reported in the ExAC
database as common (MAF≥5%), low frequency (1%≤
MAF > 5%), or the combined category of rare (MAF < 1%) and novel (absent from ExAC and dbSNP build 150 data-bases). In silico functional assessment was restricted to protein-coding genetic variation and gain or loss of a stop codon.
Concordance assessment
To assess concordance of clinically actionable NGS variant data, orthogonal genotyping was performed using TaqMan allelic discrimination for 39 clinically relevant SNVs includ-ingUGT1A1*28 andCYP2D6CNV. SNVs were chosen ac-cording to the level of evidence as defined by the
Pharmacogenomics Knowledge Base or PharmGKB (http://
www.pharmgkb.org/clinicalAnnotations accessed October 17, 2018) including 21 Level 1A SNVs with published prescribing recommendations for genotype-based dose adjustment or drug avoidance. Rare NGS variants were confirmed retrospectively by Sanger sequencing within 4
highly polymorphic pharmacogenes, namely ABCB1,
CYP2D6, SLCO1B1,andSLCO1B3. PCR conditions and se-quencing primers as well as TaqMan assay IDs are listed in Additional file1: Table S3 and Table S4, respectively.
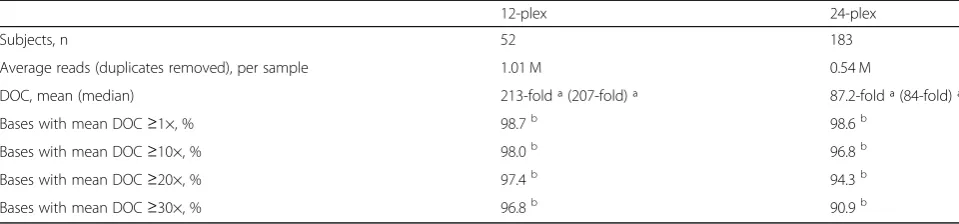
Table 1PGxSeq performance by sequencing cluster
12-plex 24-plex
Subjects, n 52 183
Average reads (duplicates removed), per sample 1.01 M 0.54 M
DOC, mean (median) 213-fold ª (207-fold) ª 87.2-fold ª (84-fold) ª
Bases with mean DOC≥1×, % 98.7b 98.6b
Bases with mean DOC≥10×, % 98.0b 96.8b
Bases with mean DOC≥20×, % 97.4b 94.3b
Bases with mean DOC≥30×, % 96.8b 90.9b
DOCdepth of coverage
ª Calculated across the 422 kb target sequence including all subjects each group
b
Results
Sequencing performance
Prior to alignment to the reference genome, sequencing data for all 246 subjects was assessed for read count, base quality, and GC distribution (Fig. 1 and Additional file 2: Figures S1-S3). The total number of sequenced reads per subject was dependent on sequencing cluster size, and one subject was identified to have very low read count (< 1 k reads) (Additional file2: Figure S1). The majority of reads showed an average base quality score above 30 (Phred
scale) among the 13 sequencing runs performed
(Additional file 2: Figure S2). The average GC content of reads (per subject) was 45.6 ± 2.0% (mean ± SD). GC con-tent distribution deviated greatly in 9 subjects compared to the remaining cohort (Additional file 2: Figure S3). After alignment of reads to the reference genome, we assessed coverage across the target sequence, and identified 11 sub-jects with greater than 20% of their target sequence≤10× read depth, including those with high GC content. Overall, we observed a negative correlation between the low cover-age and high GC content (Additional file2: Figure S3 B). In order to avoid false negative variant calling as previously re-ported [38], 11 subjects with low reads and/or high GC content were removed from further analysis.
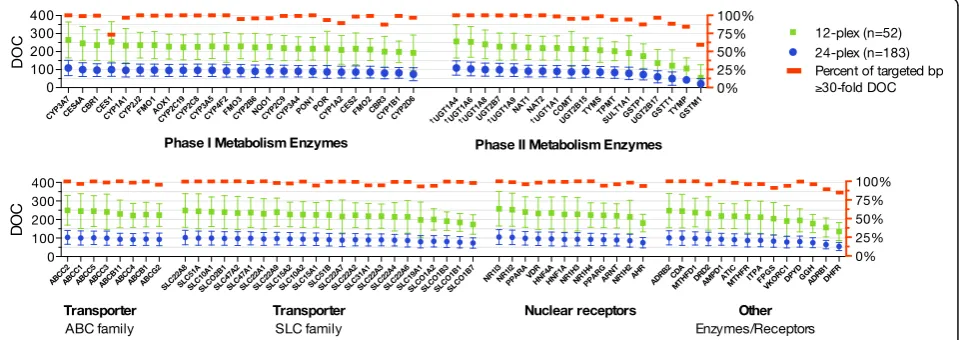
Accordingly, NGS data of 235 subjects were included for subsequent coverage analysis, and assessed by se-quencing cluster (n= 12 or 24) (Table 1). As expected, samples in the smaller cluster had a greater mean DOC per subject compared to those sequenced in the larger 24 DNA sample cluster (Table 1). Overall, the propor-tion of bases with a read depth≤10× was very small (2– 3.2%). On a gene-by-gene basis, on average, 98 of the
100 genes on our panel had a median DOC ≥50×, with
≥80% of the target region within these genes having
DOC ≥30× representing deep sequencing (Fig. 2). We
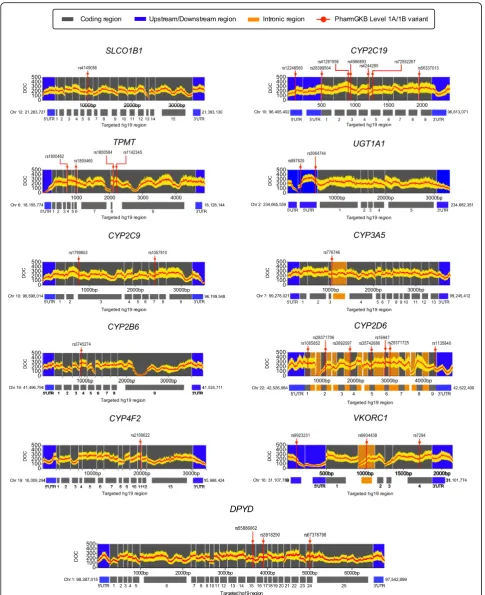
observed overall high coverage across clinically relevant pharmacogenes including regions of PharmGKB Level 1A/1B variants ( http://www.pharmgkb.org/clinicalAnno-tations) (Fig. 3). Among all genes, the glutathione
S-transferase (GST) M1 gene showed the lowest
cover-age per subject and large intersubject variability (min-max; 0–310×). For carboxylesterase 1 (CES1), there was lack of coverage for exons 12 to 14, resulting in a high proportion of targeted regions < 30×, followed by car-bonyl reductase 3 (CBR3) (Additional file2: Figure S4).
Accuracy of variant detection
Genotyping with TaqMan assays was utilized to validate 39 clinically relevant variants across 215 subjects (9 variants per subject, on average) detected with NGS data (Table2). We observed 99.9% concordance between NGS-derived and TaqMan-derived genotypes confirming heterozygous and homozygous carrier status. While we did not detect any false positive results (a variant was detected by NGS but not confirmed by TaqMan genotyping; specificity of 100%, 95% CI, 100–100%), a false negative NGS result was
observed in two heterozygous carriers for DPYD
rs67376798 and CYP2D6*10 rs1065852 (no variant
de-tected by NGS but observed by TaqMan genotyping; sensi-tivity of 99.7%, 95% CI, 99.2–100%). However, subsequent assessment of individual reads revealed a variant in both subjects that was previously not called due to the low coverage in the SNV region, since the threshold for
variant detection was not met (DOC ≥10x). Using
Sanger sequencing, we were able to retrospectively confirm five rare coding variants that were identified by
NGS in ABCB1, CYP2D6, SLCO1B1, and SLCO1B3
(Additional file1: Table S5).
UGT1A1*28 polymorphism detection using NGS data was carried out manually in 235 individuals. Each subject’s
Fig. 2Depth-of-coverage (DOC) assessment by gene according to size of sequence cluster (n= 12 or 24).†ForUGT1A4, UGT1A6, UGT1A8,and
promoter region was expressed as the percentage of reads with six TA repeats, which clustered into 3 separate groups according to their frequency distribution (Fig. 4a), and UGT1A1*28 genotype (*1/*1, *1/*28, *28/*28) confirmed by
TaqMan genotyping in a subset of 81 subjects (Fig. 4b; Table2).
CYP2D6 whole gene CNV analysis was performed in all subjects processed in the 24 sample sequencing
Table 2Concordance rate (%) between PGxSeq sequencing data compared to TaqMan-derived genotypes for clinically important SNVs as defined by PharmGKB
PharmGKB Gene Allele Nucleotide change
Effect dbSNP Allele frequency TaqMan Concordanceª FP FN
Level of evidence
150 Study 1000G ExAC Patients genotyped (N) (%) (%) (%)
(n= 235) EUR EUR WT HET HOM
1A CYP2C19 *17 C > T promoter rs12248560 0.23 0.23 NR 23 11 1 100 0 0
1A CYP2C19 *2 G > A p.P227P rs4244285 0.14 0.15 0.15 25 11 0 100 0 0
1A CYP2C19 *3 G > A p.Y212X rs4986893 ND 0 1.80E-04 50 0 0 100 0 NA
1A CYP2C9 *2 C > T p.R144C rs1799853 0.13 0.12 0.13 72 23 3 100 0 0
1A CYP2C9 *3 A > C p.I359L rs1057910 0.06 0.06 0.07 87 13 0 100 0 0
1A CYP2D6 *10 C > T p.P34P rs1065852 0.21 0.2 0.25 30 19 3 98.1 0 1.9
1A CYP2D6 *4 G > A splice rs3892097 0.19 0.19 0.17 52 26 6 100 0 0
1A CYP2D6 *3A A > del p.R208fs rs35742686 0.03 0.02 0.02 50 2 0 100 0 0
1A CYP2D6 *41 G > A intronic rs28371725 0.12 0.09 0.09 38 14 0 100 0 0
1A CYP3A5 *3 A > G splice rs776746 0.93 0.95 NR 1 9 27 100 0 0
1A CYP4F2 *3 C > T p.V433 M rs2108622 0.30 0.27 0.29 23 17 0 100 0 0
1A DPYD *13 T > G p.I560S rs55886062 2.1E-03 1.3E-03 6.18E-04 97 1 0 100 0 0
1A DPYD *2A G > A splice rs3918290 0.02 0.01 0.01 100 1 0 100 0 0
1A DPYD A > T p.D949V rs67376798 0.02 2.2E-03 4.09E-03 80 8 0 98.9 0 1.1
1A SLCO1B1 *5 T > C p.V174A rs4149056 0.18 0.17 0.16 67 31 4 100 0 0
1A TPMT *2 G > C p.A80P rs1800462 2.1E-03 6.00E-03 1.97E-03 51 1 0 100 0 0
1A TPMT *3B G > A p.A154T rs1800460 0.04 0.03 0.04 41 10 0 100 0 0
1A TPMT *4 G > A splice rs1800584 ND NR 3.01E-05 51 0 0 100 0 NA
1A TPMT *3C A > G p.Y240C rs1142345 0.04 0.03 0.04 41 10 0 100 0 0
1A UGT1A1 *28 (TA)6> (TA)7 promoter rs3064744 0.32 0.29 NR 36 40 5 100 0 0
1A VKORC1 G > A intergenic rs9923231 0.40 0.40 NR 19 15 6 100 0 0
1B CYP2B6 *9 G > T p.Q172H rs3745274 0.21 0.23 0.24 22 9 0 100 0 0
2A ABCB1 C > T p.I1145I rs1045642 0.48 0.47 0.47 18 61 26 100 0 0
2A CYP2D6 *9 AAG > del p.K281del rs5030656 0.02 0.02 0.03 48 4 0 100 0 0
2A SLCO1B1 *1B A > G p.N130D rs2306283 0.41 0.40 0.41 40 46 15 100 0 0
2B ABCG2 C > A p.Q141K rs2231142 0.12 0.10 0.10 87 20 1 100 0 0
3 ABCC2 G > A p.V417I rs2273697 0.19 0.20 0.20 45 19 4 100 0 0
3 ABCG2 G > A p.V12 M rs2231137 0.04 0.06 0.05 81 9 0 100 0 0
3 CYP2B6 C > T p.R487C rs3211371 0.12 0.10 0.12 23 8 0 100 0 0
3 CYP3A4 *22 C > T intronic rs35599367 0.05 0.05 NR 36 8 0 100 0 0
3 DPYD HapB3 G > A p.E412E rs56038477 0.03 0.02 0.02 73 11 0 100 0 0
3 SLCO2B1 G > A p.R290Q rs12422149 0.06 0.10 0.11 62 6 0 100 0 0
ª Percentage of total tested DNA samples with NGS-determined genotypes concordant with TaqMan results. False positive was defined as TaqMan determined “homozygous wildtype”and NGS determined“variant carrier”. False negative was defined as TaqMan determined“variant carrier”and NGS determined
A
B
A
B
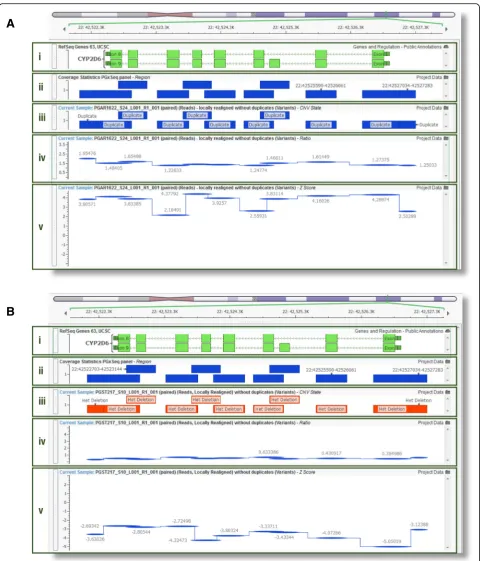
Fig. 5Next-generation sequencing (NGS)-based detection ofCYP2D6copy number variation.aRepresentative NGS output for a
cluster (n= 183). A representative sample output for a
subject with a CYP2D6 duplication and deletion is
shown in Fig.5. We detected a gene deletion (heterozy-gous form) and duplication in 2.5 and 3.3% of subjects, respectively, which were confirmed by TaqMan CNV assay (Table 3). Notably,CYP2D6 genotype revealed du-plications of *4 and/or *41 alleles in three out of 6 pa-tients resulting in a predicted intermediate metabolizer phenotype for CYP2D6. In addition, gene deletion oc-curred in combination with *3 and *4 alleles, resulting in a predicted poor metabolizer status in four out of 9 patients.
Analysis of variants in pharmacogenes
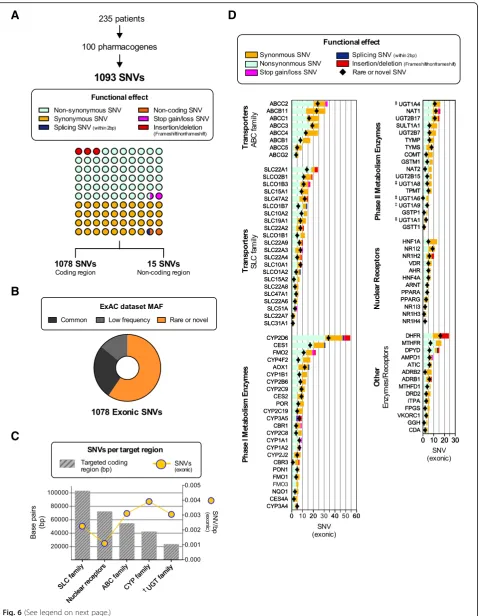
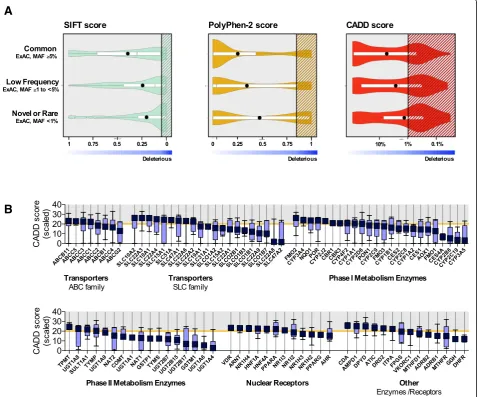
Genetic variation was assessed in 235 Caucasian study subjects (Additional file1: Table S6), and SNVs presented in Fig.6according to functional effect, number of variants per gene, and reported MAF in ExAC (if exonic), the latter capturing NGS exome data of 60,706 individuals [45]. A total of 1093 unique SNVs were identified, consisting of 605 non-synonymous (55.4%), 417 synonymous (38.1%), 7 splice-site (0.6%), 14 stop gain or loss (1.4%), and 35 insertion-deletions (18 frameshift, 17 non-frameshift; 3.2%), as well as 15 known non-coding SNVs (1.4%) (Fig.
6a). The majority of variants (72%) were only present in
heterozygous form. Among exonic variants (Fig. 6b),
26.3% of SNVs were common (ExAC MAF > 5%), 14.2%
occurred at a low frequency (ExAC MAF ≥1 and≤5),
whereas 59.5% were either rare or novel (ExAC MAF < 1% or absent from ExAC or dbSNP150). MAFs in this study largely mirrored those reported in much larger data sets of subjects with European descent (ExAC, 1000G) (Additional file2: Figure S5). According to gene family or drug-related function, theCYPgene families had the most variants per targeted base pairs, followed by theABCand UGTfamily, thenSLCfamily, while nuclear receptors were the least variable (Fig.6c). Individually, among Phase I
en-zymes, CYP2D6 had the highest total number of exonic
SNVs (54) and the highest number of rare or novel vari-ants from our gene panel (Fig.6d), whereasUGT1A4and
N-acetyltransferase 1 (NAT1) had the most SNVs among
Phase II enzymes. Within the SLCfamily, organic cation transporter 1 (SLC22A1) showed the highest number of SNVs as well as rare or novel SNVs among allSLCgenes
sequenced. Among transporter genes of the ABC family,
ABCC2had the highest number of the SNVs with 33 vari-ants. No variants were detected forCYP3A7andSLC51B, despite adequate coverage achieved across both coding sequences.
In silico assessment of variants in pharmacogenes
Potential functional effects of the identified non- synonym-ous variants were assessed with CADD, PolyPhen- 2, and SIFT. Our results showed marked differences between the
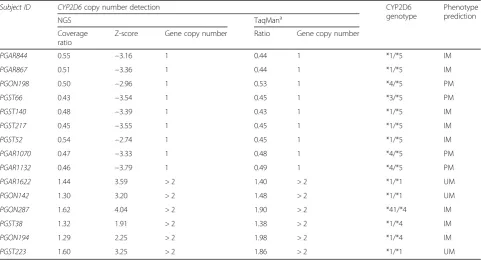
Table 3NGS-based detection ofCYP2D6whole gene copy number variation (CNV) in 183 subjects. For more detail on the detection, refer to Fig.5
Subject ID CYP2D6copy number detection CYP2D6
genotype
Phenotype prediction
NGS TaqMana
Coverage ratio
Z-score Gene copy number Ratio Gene copy number
PGAR844 0.55 −3.16 1 0.44 1 *1/*5 IM
PGAR867 0.51 −3.36 1 0.44 1 *1/*5 IM
PGON198 0.50 −2.96 1 0.53 1 *4/*5 PM
PGST66 0.43 −3.54 1 0.45 1 *3/*5 PM
PGST140 0.48 −3.39 1 0.43 1 *1/*5 IM
PGST217 0.45 −3.55 1 0.45 1 *1/*5 IM
PGST52 0.54 −2.74 1 0.45 1 *1/*5 IM
PGAR1070 0.47 −3.33 1 0.48 1 *4/*5 PM
PGAR1132 0.46 −3.79 1 0.49 1 *4/*5 PM
PGAR1622 1.44 3.59 > 2 1.40 > 2 *1/*1 UM
PGON142 1.30 3.20 > 2 1.48 > 2 *1/*1 UM
PGON287 1.62 4.04 > 2 1.90 > 2 *41/*4 IM
PGST38 1.32 1.91 > 2 1.38 > 2 *1/*4 IM
PGON194 1.29 2.25 > 2 1.98 > 2 *1/*4 IM
PGST223 1.60 3.25 > 2 1.86 > 2 *1/*1 UM
PMpoor metabolizer,IMintermediate metabolizer,UMultrarapid metabolizer
a
A
B
C
D
prediction scores derived from these algorithms (Fig. 7a). However, the proportion of rare (MAF < 1%) or novel vari-ants that were categorized as possibly deleterious was greater than the proportion of common (≥5%) or low fre-quency (≥1–5%) variants for all 3 tools (CADD:p= 0.0002, PolyPhen-2:p= < 0.0001, and SIFT:p= 0.0002) (Additional file2: Figure S6). The majority of pharmacogenes (96 out of 100) harbored at least one variant with a CADD score > 20
(median, 5) (Fig. 7b). On average, 14.8% (9.3–21.3%, min-max) of the coding (exonic) variants detected across the 100 pharmacogenes per subject were predicted as dele-terious (CADD score > 20). Although the majority of these variants were observed in heterozygous form (Additional file2: Figure S7), all 235 subjects had ≥1 deleterious vari-ant(s) in the homozygous form, with a median of 4 (1–12, min-max) SNVs per subject. Finally, we assessed prediction
(See figure on previous page.)
Fig. 6Assessment of genetic variation determined by PGxSeq in 235 subjects. According to functional effect (a), allele frequency reported in ExAC database (b), number of exonic variants per target region (c), and gene (d).‡ForUGT1A4, UGT1A6, UGT1A8,andUGT1A9,only SNVs located within the first exon were counted while shared exons were assessed only once withUGT1A1. ExAC, Exome Aggregation Consortium; MAF, minor allele frequency
A
B
scores among 12 CYP genes that account for the majority of reported drug oxidation reactions (Additional file 1: Figure S8); on average, 11% of SNVs (10 - 90th percentile, 4.1–20.0%) with a CADD > 20 among individuals were located within these genes.
Variation in genes of clinical relevance
Among 11 clinically relevant genes for which prescribing guidelines for specific gene-drug combinations have been
published (cpicpgx.org/genes-drugs/), there are 31
PharmGKB Level 1A and 1B variants categorized as hav-ing strong evidence for influenchav-ing drug efficacy/response and/or prescribing recommendations (Fig. 3). We identi-fied 24 out of these 31 variants in our cohort, with 183 pa-tients (78%) harbouring at least one PharmGKB level 1A/ 1B homozygous variant (Additional file2: Figure S9).
Discussion
As genotype-guided pharmacotherapies advance into the clinical setting, targeted NGS technologies provide great utility by simultaneously detecting common as well as rare genetic variation of potential relevance to adverse or de-sired drug response in patients. In this study, we established and validated a comprehensive targeted PGxSeq exome panel for most clinically important pharmacogenetic loci. Our findings demonstrate excellent concordance for the detection of clinically relevant variants compared to stand-ard pharmacogenetic assays including theUGT1A1*28
pro-moter (TA)7 TAA repeat and CYP2D6 copy number
variation. Moreover, adequate read depth along the target regions and a strong correlation of allelic frequencies for rare and novel variants in this population compared to lar-ger genetic datasets suggests accurate and reliable results, while confirming the high prevalence of such potentially functional variation within pharmacogenes.
Compared to traditional genotyping or sequencing strat-egies, the applied targeted exome sequencing strategy enabled accurate genotyping for common, previously estab-lished functional variation across exonic and intergenic re-gions in clinically important pharmacogenes as well as the comprehensive discovery of novel rare SNVs with fast and adequate performance. Available bioinformatics tools fur-ther allowed customized utilization of sequencing data at a small or large scale, i.e. the assessment of individual geno-types and genes of interest or a more exhaustive pharmaco-genetic analysis. Importantly, the majority of patients (78%) harbored one or more homozygous PharmGKB Level 1A or 1B variant(s) with recommendations to adjust dose or for al-ternative therapies confirming recent findings from the eMerge-PGx study comprising extensive sequencing data from 5000 patients for 82 pharmacogenes [46]. Moreover, 60% of the observed SNVs were rare (536 variants; 2.3 per patient) or novel (105 variants; 4.4 per 10 patients), the
latter absent in more than 60,000 individuals [45]; a similar frequency of 73% has been previously reported in a whole-genome sequencing study of 231 pharmacogenes [20]. Accordingly, a significant portion of novel variation will likely be missed when utilizing more cost-effective, array-based genotyping platforms such as DMET+ (1936 SNVs in 231 pharmacogenes; Affymetrix, CA, USA) or the genome-wide Infinium Global Screening Array-24 (665,608 SNVs; Illumina, CA, USA). Moreover, the capacity of asses-sing CNV in pharmacogenes is an additional advantage of this NGS panel. Overall, the multitude of other, newly dis-covered candidate variants among pharmacogenes in this study highlights the need for comprehensive sequencing ap-proaches to determine the likely more complex genotype of a patient, while high-throughput experimental strategies are warranted to screen and confirm effects of previously unre-ported genetic variation on protein activity.
While NGS is thought to be best suited for the detection of SNV, most recent reports highlight its utility for the identification of genomic structural variants as demon-strated forGSTs[27], the LDL receptor (LDLR) [40], the PCSK9 enzyme (PCSK9) [47], and various genes under-lying retinal dystrophies [48], among others. Our findings demonstrate that a read-depth based approach can be suc-cessfully applied for the identification of CNV inCYP2D6, a gene notorious for its complex genomic architecture and pseudogene homology [30, 49]. CYP2D6 gene dele-tion (*5 allele) and multiplicadele-tion are commonly observed among various ethnicities (2–3% in Caucasians) [11], resulting in reduced (or lack of ) and increased enzymatic activity, respectively. Previously,CYP2D6 CNV has been assessed in 61 adult [33] as well as 98 pediatric patients [50] utilizing whole-genome sequencing data, while tar-geted NGS pharmacogene panels have not reported such results [27, 28]. While previous approaches evaluating
whole-genome sequences have failed to predict CYP2D6
CNV in several subjects [33,50], we were able to confirm concordance in all assessed patients using the bioinfor-matics tool VarSeq CNV caller. Accuracy of these results is further supported by frequencies observed in this study that are in close agreement with the literature with 3.3% for CYP2D6 duplication (*1xN and *4xN), and 2.5% for CYP2D6 deletion (*1/*5, *3/*5 and *4/*5). Our findings clearly indicate that information regardingCYP2D6 geno-type and CNV is critical for accurate CYP2D6 phenogeno-type prediction, exemplified by duplication of non-functional alleles such as *4. Known to metabolize about 25% of
commonly prescribed drugs [51], CYP2D6 genotype is
To our knowledge, this is the first study reporting the utility of NGS data to identify UGT1A1*28 allele status. However, for this purpose, manual assessment of the
(TA)n repeat in sequencing reads within the UGT1A1
promoter region was required for each subject. Additional bioinformatics tools are warranted to automate variant calling ofUGT1A1*28to enable high-throughput analysis
in large patient numbers. UGT1A1*28has been reported
to lower glucuronidation rate of the active metabolite of irinotecan, SN-38, likely associated with higher toxicity [54,55], and is currently part of prescribing guidelines for atazanavir [14].
A significant number of pharmacogenetic variants de-tected in our validation cohort was either rare or novel (60%), and more than half (55%) resulted in amino acid changes, supporting previous observations in larger data-sets [17, 46, 56, 57]. While the proportion of SNVs with predicted effects on protein function differed among ap-plied in silico tools, differences in scoring have been previ-ously observed and are not surprising given the way these algorithms were derived [27]. SIFT leverages the evolution-ary conservation of amino acids [43], PolyPhen-2 uses pathogenicity information [44], while CADD is the most re-cent algorithm integrating conservation metrics, regulatory information, and protein-level effect among others [42]. Moreover, a higher false negative rate may apply for pre-dicting rare gain-of-function compared to loss-of-function variants using SIFT and PolyPhen [58], while algorithms
such as CADD may be more comparable [59]. A recent
study suggests that the in silico algorithms used here pre-dict altered enzymatic or transporter function with about 80% accuracy compared to in vitro assessment [27]. Among 207 to 275 possibly deleterious variants predicted in this study, rare or novel SNVs were more likely to have func-tional effects than common or low frequency variants (Additional file2: Figure S6), and accounted for 41–51% of all deleterious SNVs. These findings are similar to a recent report evaluating NGS data from thousands of individuals in 146 pharmacogenes, where 30 to 40% of rare variation was predicted to be functional [17]. Moreover, we found that nearly all patients (221 of 235) carried at least one dele-terious allele (CADD score > 20) in 12CYPgenes with key roles in drug metabolism [56, 60]; these potentially clinic-ally relevant findings need to be followed up.
Genetic profiling using any short-fragment sequen-cing platform is a widely recognized challenge for NGS of pharmacogenes [30, 61], and requires sufficient rep-resentation of mapped sequenced reads in the region of interest to ensure accuracy. As expected, many
mem-bers of theCYP,SULTandUGTgene families were
re-ported as harboring 250-bp sequence fragments that map to more than one place in the genome due to their sequence similarity, with regions that are up to 100% identical (i.e. pseudogenes) predicted of being the most
problematic [29]. An estimated 1.8% of our 422 kb tar-get sequence (69 exons in 19 genes) was found to be susceptible to potential mismapping. Although our hybridization-based enrichment strategy achieved a me-dian read coverage above 50x for most genes (98 of 100), the results also indicate that the median or mean value alone may not always correctly indicate evenly sufficient read coverage across the targeted region. Spe-cifically, for CES1 the average median per subject was
DOC ≥100x was observed, however 30.2% of its
tar-geted bases (Exon 12–14) showed a DOC <30x indicat-ing areas prone to higher false negative rates (Fig. 2, Additional file2: Figure S3); a 95–100% sequence simi-larity has been previously reported for CES1exons 12– 14 [29]. Accordingly, high homology regions may bene-fit from longer capture probes for hybridization-based target enrichment to ensure appropriate capture and/or
sequence read mapping. Moreover, DOC for GSTM1
were the lowest among all genes of our panel. A previ-ous report in a Korean population sample showed
indi-viduals with GST gene deletion (GST*0) lacked
coverage when assessed with NGS, while the number of gene copies correlated the mean number of sequenced read depth [27]. Deletions of GSTs are also prevalent
among Europeans (MAF ~ 0.5 [62]), and we noted 57
and 17% of our study group had near zero coverage for GSTM1 and GSTT1, respectively, likely representing GST*0 carrier status (Additional file 2: Figure S10). Our findings highlight the need for monitoring targeted regions for low sequence coverage, absent data or am-biguous calls to reduce false negative or positive find-ings by defining test panel limitations in agreement with current clinical laboratory standards for NGS [63].
While we show the potential application of targeted ex-ome sequencing as a comprehensive pharmacogenetic pro-filing tool, there are some limitations. Validation of concordance was limited to variants in 39 loci in 16 genes in our relatively small, mostly Caucasian sample, in contrast to previously reported multi-center studies that assessed hundreds of SNVs in larger populations [27,28] including commercially available DNA control samples [27, 63]. However, despite the small sample size, the herein observed variation compared well to findings from larger data sets. Moreover, our gene panel is largely restricted to pharmaco-genes of relevance to drug disposition, while a recent report indicates the increasing relevance of drug target genes [64]. Lastly, in contrast to whole-genome sequencing, our tar-geted exome panel is unable to detect pharmacogenomic variants in 3′- and 5′-untranslated as well as intronic re-gions that may be of relevance.
Conclusions
pediatrics. Bringing these technologies to clinical pharma-cogenetics represents a timely and logical convergence, es-pecially given the history of applied genetic concepts and molecular methods within the discipline. Through com-prehensive validation of performance and accuracy, results from our study and others demonstrate the utility of tar-geted exome sequencing panels as sensitive and reliable
sequencing platforms for pharmacogenes, including
CYP2D6CNV [27,28]. But despite the relative ease of the sequencing process, the time and effort required for post-sequencing computational and bioinformatics data analyses are significant due to the technical and interpretive complexity of NGS and the biology of some pharmacoge-netic gene targets. Moreover, as new variants are discovered using these high-throughput detection methods, the need for standards in attributing pathogenicity together with development of tools for high-throughput functional assessment and clinical validation are required before imple-menting findings to aid therapeutic decision-making.
Additional files
Additional file 1:Table S1.Genomic coordinates of PGxSeq capture probe design.Table S2.Known promoter and intronic SNVs targeted in PGxSeq panel.Table S3.Polymerase chain reaction conditions and primers used for Sanger sequencing of rare NGS variants.Table S4. TaqMan assay ID for the validated clinically relevant SNVs.Table S5. Concordance of rare variation in select genes by Sanger sequencing. Table S6.Characterization of unique variants identified by PGxSeq in 235 Caucasian subjects. (XLSX 298 kb)
Additional file 2:Figure S1.Mean (±SD) read count per subject (duplicates removed) stratified by sequencing cluster (n= 246).Figure S2.Number of reads versus mean base quality score (Phred scale) per read for all sequencing runs (n= 246).Figure S3.Assessment of guanine and cytosine [GC] content within sequencing reads (n= 246). Histogram of the average percent GC content across total reads (A). Relationship between subjects average GC content and coverage (B).Figure S4. Mean (±SD) depth of coverage (DOC) across the targeted sequence for CES1 and CBR1 showing the inaccessible target regions.Figure S5.Study minor allele frequencies (MAF) in relation to the reported MAF in 1000 Genomes Project (1000G) and Exome Aggregation Consortium (ExAC) datasets.Figure S6.In silico functional prediction scores for genetic variants identified among 235 subjects. Rare or novel variations had a greater proportion of possibly deleterious prediction scores for all three algorithms (SIFT, Polyphen-2 and CADD).Figure S7.Zygosity of the potentially deleterious variants (CADD scaled score greater than 20) per subject (n= 235), showing there were more heterozygous compared to homozygous variants per subject.Figure S8.Single nucleotide variants (SNV) per subject (n= 235) found in cytochrome P450 (CYP) enzymes (CYP1A1, CYP1A2, CYP1B1, CYP2B6, CYP2C19, CYP2C8, CYP2C9, CYP2D6, CYP2J2, CYP3A4, CYP3A5, and CYP4F2) that are potentially deleterious variants (CADD scaled score greater than 20) separated by zygosity. Figure S9.Number of Pharmacogenomics Knowledge Base (PharmGKB) “Level 1A/1B”variants (categorized as having strong supporting evidence for affecting drug efficacy/response and/or specific prescribing recom-mendationshttps://www.pharmgkb.org/clinicalAnnotations) found in 235 subjects separated by zygosity.Figure S10.Histogram of the GSTM1 and GSTT1 gene coverage as a fraction total subject coverage in 235 subjects. (PDF 2439 kb)
Abbreviations
1000G:1000 Genomes Project; ABC: ATP binding cassette; ADME: Absorption, distribution, metabolism, excretion; CADD: Combined Annotation Dependent
Depletion; CBR3: Carbonyl reductase 3; CES1: Carboxylesterase 1; CNV: Copy number variation; CPIC: Clinical Pharmacogenetics Implementation Consortium; CYP: Cytochrome P450; dbSNP150: Single nucleotide polymorphism database build 150; DOC: Depth-of-coverage; ESP: Exome sequencing project; GC: Guanine and cytosine; gDNA: Genomic DNA; GST: Glutathione S-transferase; Indels: Insertion-deletion; LDLR: LDL receptor; MAF: Minor allele frequency; NAT1: N-acetyltransferase 1; NGS: Next-generation sequencing; PCR: Polymerase chain reaction;
PharmGKB: Pharmacogenomics knowledge base; RefSeq: Reference Sequence; SIFT: Sorting intolerant from tolerant; SLC: Solute carrier; SLCO: Solute carrier organic anion transporter; SNVs: Single nucleotide variants; UCSC: University of California Santa Cruz; UGT: UDP
glucuronosyltransferase; UTR: Untranslated region; VCF: Variant call format
Acknowledgements
We would like to thank Cameron Ross and David Carter for excellent technical assistance with genotyping and NGS, and David Sheshelidze for computational support concerning NGS data management and analysis.
Funding
This work was supported by the Wolfe Medical Research Chair in
Pharmacogenomics, the Children’s Health Foundation, London, Ontario, and the Canadian Institutes of Health Research, Drug Safety and Effectiveness Network (DSEN-PREVENT, FRN-117588).
Availability of data and materials
All data generated or analysed during this study are included in this published article and its additional materials files (Additional files1and2).
Authors’contributions
Participated in research design: MG, RBK, RGT, and UIS. Data acquisition, analysis, and/or interpretation: MG, TL, WAT, JW, JSD, JFR, RBK, RGT, and UIS. Wrote or contributed to the writing of the manuscript: MG, RAH, UIS. All authors read and approved the final manuscript.
Ethics approval and consent to participate
Adult and pediatric studies have been approved by the Research Ethics Board of Western University, London, Canada (REB15586; REB107097). All subjects provided written informed consent except minor participants (those under the age of 12), where parents provided written informed consent. Children aged 13 to 17 years provided written informed consent, where the child and/or parents/ guardians were able to refuse to participate.
Consent for publication Not applicable.
Competing interests
R.B.K., R.G.T., and U.I.S. declare a pending US provisional patent application for PGxSeq.
All other authors have no conflict of interest to disclose (M.G., T.L., W.A.T., J.W., J.S.D., J.F.R., R.A.H.).
Publisher’s Note
Springer Nature remains neutral with regard to jurisdictional claims in published maps and institutional affiliations.
Author details
1Division of Clinical Pharmacology, Department of Medicine, Western University, London Health Sciences Centre - University Hospital, 339 Windermere Road, London, ON N6A 5A5, Canada.2Department of Physiology and Pharmacology, Western University, Medical Sciences Building, Room 216, London, ON N6A 5C1, Canada.3Robarts Research Institute, Western University, 1151 Richmond St. N, London, ON N6A 5B7, Canada.
Received: 7 January 2019 Accepted: 13 May 2019
References
McPherson JD. New York: Cold Spring Harbor Laboratory Press; 2019;9: a033027.
2. DeGorter MK, Xia CQ, Yang JJ, Kim RB. Drug transporters in drug efficacy and toxicity. Annu Rev Pharmacol Toxicol. 2012;52:249–73.
3. Clinical Pharmacogenetics Implementation Consortium. Guidelines.https:// cpicpgx.org/guidelines/. Accessed 20 Sept 2017.
4. Johnson JA, Caudle KE, Gong L, Whirl-Carrillo M, Stein CM, Scott SA, et al. Clinical pharmacogenetics implementation consortium (CPIC) guideline for
pharmacogenetics-guided warfarin dosing: 2017 update. Clin Pharmacol Ther. 2017;102:397–404.
5. Johnson JA, Gong L, Whirl-Carrillo M, Gage BF, Scott SA, Stein CM, et al. Clinical pharmacogenetics implementation consortium guidelines for CYP2C9 and VKORC1 genotypes and warfarin dosing. Clin Pharmacol Ther. 2011;90:625–9. 6. Scott SA, Sangkuhl K, Gardner EE, Stein CM, Hulot JS, Johnson JA, et al.
Clinical pharmacogenetics implementation consortium guidelines for cytochrome P450-2C19 (CYP2C19) genotype and clopidogrel therapy. Clin Pharmacol Ther. 2011;90:328–32.
7. Scott SA, Sangkuhl K, Stein CM, Hulot JS, Mega JL, Roden DM, et al. Clinical pharmacogenetics implementation consortium guidelines for CYP2C19 genotype and clopidogrel therapy: 2013 update. Clin Pharmacol Ther. 2013; 94:317–23.
8. Ramsey LB, Johnson SG, Caudle KE, Haidar CE, Voora D, Wilke RA, et al. The clinical pharmacogenetics implementation consortium guideline for SLCO1B1 and simvastatin-induced myopathy: 2014 update. Clin Pharmacol Ther. 2014;96:423–8.
9. Relling MV, Gardner EE, Sandborn WJ, Schmiegelow K, Pui CH, Yee SW, et al. Clinical pharmacogenetics implementation consortium guidelines for thiopurine methyltransferase genotype and thiopurine dosing: 2013 update. Clin Pharmacol Ther. 2013;93:324–5.
10. Relling MV, Gardner EE, Sandborn WJ, Schmiegelow K, Pui CH, Yee SW, et al. Clinical pharmacogenetics implementation consortium guidelines for thiopurine methyltransferase genotype and thiopurine dosing. Clin Pharmacol Ther. 2011;89:387–91.
11. Goetz MP, Sangkuhl K, Guchelaar HJ, Schwab M, Province M, Whirl-Carrillo M, et al. Clinical pharmacogenetics implementation consortium (CPIC) guideline for CYP2D6 and tamoxifen therapy. Clin Pharmacol Ther. 2018;103:770–7. 12. Amstutz U, Henricks LM, Offer SM, Barbarino J, Schellens JHM, Swen JJ, et al.
Clinical pharmacogenetics implementation consortium (CPIC) guideline for Dihydropyrimidine dehydrogenase genotype and Fluoropyrimidine dosing: 2017 update. Clin Pharmacol Ther. 2018;103:210–6.
13. Martin MA, Hoffman JM, Freimuth RR, Klein TE, Dong BJ, Pirmohamed M, et al. Clinical pharmacogenetics implementation consortium guidelines for HLA-B genotype and Abacavir dosing: 2014 update. Clin Pharmacol Ther. 2014;95:499–500.
14. Gammal RS, Court MH, Haidar CE, Iwuchukwu OF, Gaur AH, Alvarellos M, et al. Clinical pharmacogenetics implementation consortium (CPIC) guideline for UGT1A1 and Atazanavir prescribing. Clin Pharmacol Ther. 2016;99:363–9. 15. US Food and Drug Administration. Table of Pharmacogenomic biomarkers
in drug labeling.https://www.fda.gov/Drugs/ScienceResearch/ucm572698. htm. Accessed 20 Sept 2017.
16. Ehmann F, Caneva L, Prasad K, Paulmichl M, Maliepaard M, Llerena A, et al. Pharmacogenomic information in drug labels: European medicines agency perspective. Pharmacogenomics J. 2015;15:201–10.
17. Kozyra M, Ingelman-Sundberg M, Lauschke VM. Rare genetic variants in cellular transporters, metabolic enzymes, and nuclear receptors can be important determinants of interindividual differences in drug response. Genet Med. 2017;19:20–9.
18. Nelson MR, Wegmann D, Ehm MG, Kessner D, St Jean P, Verzilli C, et al. An abundance of rare functional variants in 202 drug target genes sequenced in 14,002 people. Science. 2012;337:100–4.
19. Ashley EA, Butte AJ, Wheeler MT, Chen R, Klein TE, Dewey FE, et al. Clinical assessment incorporating a personal genome. Lancet. 2010;375:1525–35. 20. Mizzi C, Peters B, Mitropoulou C, Mitropoulos K, Katsila T, Agarwal MR, et al.
Personalized pharmacogenomics profiling using whole-genome sequencing. Pharmacogenomics. 2014;15:1223–34.
21. Tennessen JA, Bigham AW, O'Connor TD, Fu W, Kenny EE, Gravel S, et al. Evolution and functional impact of rare coding variation from deep sequencing of human exomes. Science. 2012;337:64–9.
22. Abecasis GR, Auton A, Brooks LD, DePristo MA, Durbin RM, Handsaker RE, et al. An integrated map of genetic variation from 1,092 human genomes. Nature. 2012;491:56–65.
23. Sagreiya H, Berube C, Wen A, Ramakrishnan R, Mir A, Hamilton A, et al. Extending and evaluating a warfarin dosing algorithm that includes CYP4F2 and pooled rare variants of CYP2C9. Pharmacogenet Genomics. 2010;20: 407–13.
24. Liu N, Irvin MR, Zhi D, Patki A, Beasley TM, Nickerson DA, et al. Influence of common and rare genetic variation on warfarin dose among African-Americans and European-African-Americans using the exome array. Pharmacogenomics. 2017;18:1059–73.
25. Ramsey LB, Bruun GH, Yang W, Trevino LR, Vattathil S, Scheet P, et al. Rare versus common variants in pharmacogenetics: SLCO1B1 variation and methotrexate disposition. Genome Res. 2012;22:1–8.
26. Koboldt DC, Steinberg KM, Larson DE, Wilson RK, Mardis ER. The next-generation sequencing revolution and its impact on genomics. Cell. 2013; 155:27–38.
27. Han SM, Park J, Lee JH, Lee SS, Kim H, Han H, et al. Targeted next-generation sequencing for comprehensive genetic profiling of Pharmacogenes. Clin Pharmacol Ther. 2017;101:396–405.
28. Gordon AS, Fulton RS, Qin X, Mardis ER, Nickerson DA, Scherer S. PGRNseq: a targeted capture sequencing panel for pharmacogenetic research and implementation. Pharmacogenet Genomics. 2016;26:161–8.
29. Mandelker D, Schmidt RJ, Ankala A, McDonald Gibson K, Bowser M, Sharma H, et al. Navigating highly homologous genes in a molecular diagnostic setting: a resource for clinical next-generation sequencing. Genet Med. 2016;18:1282–9.
30. Drogemoller BI, Wright GE, Niehaus DJ, Emsley R, Warnich L. Next-generation sequencing of pharmacogenes: a critical analysis focusing on schizophrenia treatment. Pharmacogenet Genomics. 2013;23:666–74. 31. Nielsen R, Paul JS, Albrechtsen A, Song YS. Genotype and SNP calling from
next-generation sequencing data. Nat Rev Genet. 2011;12:443–51. 32. Mamanova L, Coffey AJ, Scott CE, Kozarewa I, Turner EH, Kumar A, et al.
Target-enrichment strategies for next-generation sequencing. Nat Methods. 2010;7:111–8.
33. Twist GP, Gaedigk A, Miller NA, Farrow EG, Willig LK, Dinwiddie DL, et al. Constellation: a tool for rapid, automated phenotype assignment of a highly polymorphic pharmacogene, CYP2D6, from whole-genome sequences. NPJ Genom Med. 2016;1:15007.
34. Bosma PJ, Chowdhury JR, Bakker C, Gantla S, de Boer A, Oostra BA, et al. The genetic basis of the reduced expression of bilirubin UDP-glucuronosyltransferase 1 in Gilbert's syndrome. N Engl J Med. 1995;333: 1171–5.
35. Dalén P, Dahl M-L, Ruiz MLB, Nordin J, Bertilsson L. 10-hydroxylation of nortriptyline in white persons with 0, 1, 2, 3, and 13 functional CYP2D6 genes. Clin Pharmacol Ther. 1998;63:444–52.
36. Johansen CT, Dube JB, Loyzer MN, MacDonald A, Carter DE, McIntyre AD, et al. LipidSeq: a next-generation clinical resequencing panel for monogenic dyslipidemias. J Lipid Res. 2014;55:765–72.
37. FastQC: a quality control tool for high throughput sequence data.http:// www.bioinformatics.babraham.ac.uk/projects/fastqc. Accessed 17 Oct 2018 38. Guo Y, Ye F, Sheng Q, Clark T, Samuels DC. Three-stage quality control
strategies for DNA re-sequencing data. Brief Bioinform. 2014;15:879–89. 39. Ehmer U, Lankisch TO, Erichsen TJ, Kalthoff S, Freiberg N, Wehmeier M, et al.
Rapid allelic discrimination by TaqMan PCR for the detection of the Gilbert's syndrome marker UGT1A1*28. J Mol Diagn. 2008;10:549–52.
40. Iacocca MA, Wang J, Dron JS, Robinson JF, McIntyre AD, Cao H, et al. Use of next-generation sequencing to detect LDLR gene copy number variation in familial hypercholesterolemia. J Lipid Res. 2017;58:2202–9.
41. Wang K, Li M, Hakonarson H. ANNOVAR: functional annotation of genetic variants from high-throughput sequencing data. Nucleic Acids Res. 2010;38: e164.
42. Kircher M, Witten DM, Jain P, O’Roak BJ, Cooper GM, Shendure J. A general framework for estimating the relative pathogenicity of human genetic variants. Nat Genet. 2014;46:310–5.
43. Kumar P, Henikoff S, Ng PC. Predicting the effects of coding non-synonymous variants on protein function using the SIFT algorithm. Nat Protoc. 2009;4:1073–81.
44. Adzhubei IA, Schmidt S, Peshkin L, Ramensky VE, Gerasimova A, Bork P, et al. A method and server for predicting damaging missense mutations. Nat Methods. 2010;7:248–9.
46. Bush WS, Crosslin DR, Owusu-Obeng A, Wallace J, Almoguera B, Basford MA, et al. Genetic variation among 82 pharmacogenes: the PGRNseq data from the eMERGE network. Clin Pharmacol Ther. 2016;100:160–9.
47. Iacocca MA, Wang J, Sarkar S, Dron JS, Lagace T, McIntyre AD, et al. Whole-gene duplication of PCSK9 as a novel Whole-genetic mechanism for severe familial hypercholesterolemia. Can J Cardiol. 2018;34:1316–24.
48. Ellingford JM, Horn B, Campbell C, Arno G, Barton S, Tate C, et al. Assessment of the incorporation of CNV surveillance into gene panel next-generation sequencing testing for inherited retinal diseases. J Med Genet. 2018;55:114–21.
49. Hicks JK, Swen JJ, Gaedigk A. Challenges in CYP2D6 phenotype assignment from genotype data: a critical assessment and call for standardization. Curr Drug Metab. 2014;15:218–32.
50. Cohn I, Paton TA, Marshall CR, Basran R, Stavropoulos DJ, Ray PN, et al. Genome sequencing as a platform for pharmacogenetic genotyping: a pediatric cohort study. NPJ Genom Med. 2017;2:19.
51. Ingelman-Sundberg M, Sim SC, Gomez A, Rodriguez-Antona C. Influence of cytochrome P450 polymorphisms on drug therapies: pharmacogenetic, pharmacoepigenetic and clinical aspects. Pharmacol Ther. 2007;116:496–526. 52. Crews KR, Gaedigk A, Dunnenberger HM, Leeder JS, Klein TE, Caudle KE, et
al. Clinical pharmacogenetics implementation consortium guidelines for cytochrome P450 2D6 genotype and codeine therapy: 2014 update. Clin Pharmacol Ther. 2014;95:376–82.
53. Hicks JK, Sangkuhl K, Swen JJ, Ellingrod VL, Muller DJ, Shimoda K, et al. Clinical pharmacogenetics implementation consortium guideline (CPIC) for CYP2D6 and CYP2C19 genotypes and dosing of tricyclic antidepressants: 2016 update. Clin Pharmacol Ther. 2017;102:37–44.
54. Sakaguchi S, Garcia-Bournissen F, Kim R, Schwarz UI, Nathan PC, Ito S. Prolonged neutropenia after irinotecan-based chemotherapy in a child with polymorphisms of UGT1A1 and SLCO1B1. Arch Dis Child. 2009;94:981–2. 55. Iyer L, Das S, Janisch L, Wen M, Ramirez J, Karrison T, et al. UGT1A1*28
polymorphism as a determinant of irinotecan disposition and toxicity. Pharmacogenomics J. 2002;2:43–7.
56. Gordon AS, Tabor HK, Johnson AD, Snively BM, Assimes TL, Auer PL, et al. Quantifying rare, deleterious variation in 12 human cytochrome P450 drug-metabolism genes in a large-scale exome dataset. Hum Mol Genet. 2014;23: 1957–63.
57. Fujikura K, Ingelman-Sundberg M, Lauschke VM. Genetic variation in the human cytochrome P450 supergene family. Pharmacogenet Genomics. 2015;25:584–94.
58. Flanagan SE, Patch AM, Ellard S. Using SIFT and PolyPhen to predict loss-of-function and gain-of-loss-of-function mutations. Genet Test Mol Biomarkers. 2010; 14:533–7.
59. Ghosh R, Oak N, Plon SE. Evaluation of in silico algorithms for use with ACMG/ AMP clinical variant interpretation guidelines. Genome Biol. 2017;18:225. 60. Evans WE, Relling MV. Pharmacogenomics: translating functional genomics
into rational therapeutics. Science. 1999;286:487–91.
61. Lauschke VM, Ingelman-Sundberg M. Requirements for comprehensive pharmacogenetic genotyping platforms. Pharmacogenomics. 2016;17:917–24. 62. Kurose K, Sugiyama E, Saito Y. Population differences in major functional
polymorphisms of pharmacokinetics/pharmacodynamics-related genes in eastern Asians and Europeans: implications in the clinical trials for novel drug development. Drug Metab Pharmacokinet. 2012;27:9–54.
63. Rehm HL, Bale SJ, Bayrak-Toydemir P, Berg JS, Brown KK, Deignan JL, et al. ACMG clinical laboratory standards for next-generation sequencing. Genet Med. 2013;15:733–47.