in the population sciences published by the Max Planck Institute for Demographic Research Konrad-Zuse Str. 1, D-18057 Rostock · GERMANY www.demographic-research.org
DEMOGRAPHIC RESEARCH
VOLUME 14, ARTICLE 21, PAGES 509-540
PUBLISHED 28 JUNE 2006
http://www.demographic-research.org/Volumes/Vol14/21/ DOI: 10.4054/DemRes.2006.14.21
Research Article
Internal migration and household living
conditions in Ethiopia
Blessing Uchenna Mberu
1 Introduction 510 2 The historical and political context of migration in Ethiopia 510 3 Internal migration and household living conditions 513
4 Data, measures and methods 515
4.1 Data 515
4.2 Measures 516
4.2.1 Dependent variable 516
4.2.2 Independent and control variables 519
4.3 Analytical methods 521
5 Results 522
5.1 Socioeconomic characteristics of the study population 522 5.2 Migration and living conditions: bivariate analysis result 525
5.3 Multivariate analysis 527
6 Discussion and conclusions 530
7 Acknowledgements 534
Internal migration and household living conditions in Ethiopia
Blessing Uchenna Mberu 1
Abstract
Using the 1998 Migration, Gender and Health Survey in Five Regions of Ethiopia, and multivariate regression techniques, this paper examines the relationship between internal migration and household living conditions. The analysis finds significant living condition advantage of permanent and temporary migrants over non-migrants, primarily linked to migration selectivity by education and non-agricultural income. Once the independent effects of these variables are controlled, no statistical significant independent association exists between migration status and living conditions. Government policies of resettlement in the 1980s and ethnic federalism of the 1990s may have engendered stress migration and exacerbated poor living outcomes for return migrants. The resort to migration and/or resettlement as an individual or government policy response to periodic unfavorable conditions in places of origin is not strongly supported by this analysis as the key to improved living conditions. Promoting higher education and opportunities for employment outside the agricultural sector are more likely to yield improved living conditions in Ethiopia.
1 Blessing U. Mberu is a Senior Lecturer at Abia State University, Uturu, Nigeria, currently a doctoral student in the Department of Sociology,
1. Introduction
Increases in internal migration associated with economic and political transitions in countries of Asia, Africa, Latin America and the Pacific (Gurmu et al, 2000) have made migration a salient feature of life in developing countries. Ethiopia is one of the countries in Africa with a relatively high level of internal migration and population redistribution. This is associated with the country’s economic transition from a socialist to a market-oriented economy, critical political changes since the 1970s through 1990s, and civil war and famine (Kiros and White, 2004; Berhanu and White, 2000; Kibreab, 1996; Kloos, 1992; Clapham, 1991; Kidane, 1989). Researchers have shown how the character, direction, and volume of migration in Ethiopia in the last two to three decades have been shaped by political instability, decline in the agricultural sector, and government resettlement policies of the 1980s, whose official objective was to prevent famine and attain food security (Gebre, 2001; Ezra, 2001). Under these circumstances, migration became not only an individual or family response to an adverse socioeconomic, physical and political environment, but also an official government policy.
While these forces have combined to promote the redistribution of the population over the last several years (Berhanu and White, 2000), empirical assessments of the consequences of these movements on the living conditions of migrants and their households in Ethiopia remains limited. Recent studies have established links between migration and food insecurity (Gebre, 2001), and between the migration status of parents and child immunization (Kiros and White, 2004). However the links between migration and household welfare have not been made. This paper uses survey data from five regions of the country to construct a household living conditions index, and employs multivariate models to examine the association between migration and household living conditions, controlling for individual and socioeconomic characteristics.
2. The historical and political context of migration in Ethiopia
Ethiopia with a 2005 estimated population of 73 million is the second most populous country in Africa. Unique among African countries, the ancient Ethiopian monarchy maintained its freedom from colonial rule, with the exception of the 1936-41 Italian occupation preceding and during World War II. In 1974 a military junta, the Derg, deposed Emperor Haile Selassie (who had ruled since 1930) and established a socialist state. Following the socialist revolution, two major wars violently ravaged the country:
1) The Ethiopia-Somali dispute over the Ogaden region, which led in 1977-78 to the largest conventional war between independent African states; and 2) the war between central Ethiopian government and movements seeking separate independence for Eritrea. In the wake of these wars, lesser but still devastating conflicts proliferated in the region: the civil war in northern Somalia, the Afar and Oromo movements, and the Tigray resistance in Northern Ethiopia (Clapham, 1991).
The Derg regime was characterized by acts of repression against opposition forces and their sympathizers inside Ethiopia. The political repression reached its zenith in 1977 with the declaration of the Red Terror: support for the revolutionary motherland or death was the choice offered to Ethiopians by their new military leaders. The repression was concentrated in urban areas of Ethiopia, especially Addis Ababa, which was the center of opposition. In Eritrea, the assumption of state power by the Derg was met by intensified resistance prompting the Derg to unleash its terror in both rural and urban areas in order to break the resistance. Urban and even remote rural areas became scenes of military confrontations (Kibreab, 1996), with considerable loss of life and property and massive internal displacements to Ethiopian cities, particularly Addis Ababa, as well as migration across international borders (Kibreab, 1987). Consequently, Ethiopia was one of Africa’s largest producers of refugees up until the early 1990s (Bariagaber, 1995).
ostensibly a long-term famine prevention measure, exacerbated the food crisis by not only interfering with agricultural production but also disrupting social relations (Cohen and Isaksson, 1987). Consequently, the program engendered discontent among the peasants and out-migration flows towards cities to avoid living in settlements established and controlled by government (Berhanu and White, 2000).
Torn by bloody coups, uprisings, wide-scale drought, and massive refugee problems, the socialist military regime was finally toppled in 1991 by a coalition of rebel forces, the Ethiopian People's Revolutionary Democratic Front (EPRDF). Since coming to power, the EPRDF has promoted a policy of ethnic federalism as a form of democratization of Ethiopian society. The country is ethnically heterogeneous (Oromo 40%, Amhara and Tigre 32%, Sidamo 9%, Shankella 6%, Somali 6%, Afar 4%, Gurage 2%, other 1%), and the new leaders established largely ethnic-based territorial units. The politics of ethnicity have thus become the defining feature of governance, access to power and resources, development, and management of public affairs. One notable effect of this policy has been the massive population redistribution, particularly the return migration of settlers from Western Ethiopia back to their region of ethnic origin in the North.
Despite the low level of economic development, population movement in Ethiopia is substantial. Rural-rural and rural-urban migration was a result of the accumulated impact of famines and Ethiopians’ survival strategies (Mariam, 1985; CSA, 1992; Kloos and Lindtjorn, 1994; Kiros and White, 2004). In addition, the country has been undergoing a major transformation from a centrally planned to a market-oriented economy since the current government came to power in 1991. Under such transformations, internal migration tends to play an increasing role both demographically and economically (Kiros and White, 2004).
increased rapidly again between 1984 and 1994, but at rates lower than those in the first period. For most towns, an explanation for the decline in growth rates could be the 1975 Rural Land Act. Some researchers argue that the post revolution land reforms and the new socioeconomic structures emerging from the societal reorganization appear to have inhibited rural-urban migration (Rafiq and Hailemariam, 1987). Another factor could be the socioeconomic deterioration of the urban environment, particularly the shortage of housing and lack of jobs, which reduced rural-urban and urban-urban movements. Also differential allocation of investments for development of socioeconomic activities among urban areas could have contributed to maintaining high growth rates of some towns in comparison to others. Some of the country’s regional migrational differentials are also linked to environmental factors.
In terms of migrant composition, age-specific sex ratios from the 1994 Ethiopian census show that males dominate females in age groups 30-44 and 45-59, while females dominate males at young and old ages of 0-14, 15-29 and 60-65 years. The female dominance at young ages, particularly at age group 15-29 is linked to marriage-related migration including divorce. The prevalence of the divorced among migrant females is linked to the fact that a divorced woman is socially unaccepted and often under pressure to leave her place of usual residence and migrate to nearby urban centers. Literacy status and educational attainment are significantly linked to rural-urban mobility in the country, with more than half (51 percent) of migrants literate. Indicators from the 1999 Labor Force Survey (LFS) also show that migration flows for 1994-1999 was composed by a significant number of unemployed people (Cassacchia, et al, 2001).
Building on the forgoing historical context, this paper proceeds in subsequent sections to address the extent to which the migration patterns detailedly reviewed, relates to the living conditions of Ethiopian households.
3. Internal migration and household living conditions
in times of sickness and old age, and for education and funerals. In sum, the literature of the 1980s viewed migration in Africa as part of the livelihood and survival strategy for the rural family (Andersson, 2001). Accordingly, population redistribution and the growth of cities and towns are expected to serve as important catalysts for national development and raise the living standards of individual migrants and their households (Gurmu et al, 2000).
In contrast, other studies in the region link migration with negative outcomes. Of particular concern is the selectivity of migration for the young, the educated, the innovative, and the energetic into rural-urban migration, leaving behind in rural areas the very young, the apathetic, the retired and tired, the illiterate and the infirmed. Thus those who will stimulate the local economy and contribute to improvement in household living conditions are lost, perpetuating rural poverty and dependency, as well as undermining rural social viability (Lockwood, 1990; Makinwa, 1981; Adepoju, 1983; Dijk et al, 2001).
Researchers are also increasingly pointing to the vulnerability of migrants to adverse living conditions in their urban destinations. The rapid urbanization in the region, the unprecedented growth in the size of the population of young people, and the declining economic performance of most African countries have been linked to a new face of poverty, with a significant proportion of the population living below the poverty line in over-crowded slums and sprawling shanty towns around major cities (NISER, 1997; UN-HABITAT, 2003). This pattern of urban living is characterized by high levels of unemployment and underemployment, poverty, crime, risky reproductive behavior, generally debilitating environmental conditions, and poor health outcomes (Lloyd, 2005; APHRC, 2002; Brockerhoff and Brenan, 1998).
In these assessments, there is a failure to emphasize the socio-economic, political and environmental contexts in which most migration in sub-Saharan Africa take place. Apart from civil wars, many countries in the region are plagued with recurring droughts, famine, political conflicts and transitions, as well as unfavorable government policies that often trigger movement of the most vulnerable poor. The disruptions associated with these forces complicate the model of migration both as a major component of population change and as a determinant or consequence of economic development (Adepoju, 1977). Yet what happens in such contexts, which are typical of several African countries, is relevant in understanding the relationships between migration and human well-being in the region.
marginally-embedded in the place of origin with no locational incentive to stay. Gurmu et al (2000) identifies particularly the increased volume of movement of vulnerable women and young people with little education and few job skills, with a high proportion being domestic or service workers. In the same light, Ezra (2001) demonstrates that rural out-migration in northern Ethiopia has been a response to push factors related to ecological degradation and poverty in rural areas, rather than a response to pull factors from urban areas. Under these circumstances, the potential outcomes of such moves are hardly optimistic.
It is against this backdrop that this paper provides a unique opportunity to examine a recent survey from Ethiopia for evidence of whether the massive internal population movements during the last three decades translated to improved economic circumstances of migrant households. The study focuses on household living conditions on the premise that poverty is about people and its detrimental outcomes play out in the living conditions of men, women and children in the household (Gage et al, 1997).The central hypothesis of the study is that if the “benefits-of-migration” model is true for Ethiopia, then the migration status of the head of a household will affect the living conditions of the household. Household heads are chosen as the reference persons based on the assumption that the economic circumstance of the head of a household is the single most important indicator in determining a family’s economic status (McLanahan and Booth, 1989).
4. Data, measures and methods
4.1 Data
places, weredas (districts) were selected that were known from the census data to have high concentrations of migrants. Kebeles (neighborhoods) were then chosen, again on the basis of high concentration of migrants gleaned from Kebele authorities and key informants. Households within kebeles were then listed, using lists of households prepared by the Kebele administration and specific households were randomly selected for inclusion in the survey. For the rural sample, in each of the four regions outside Addis Ababa, one wereda (rural district) was selected, and within it two or three Peasant Associations - PAs (large villages) were selected for sampling. These PAs were chosen to represent areas of either high out-migration or high in-migration, or possibly a mix of both. Attempts were made to choose both a highland and a lowland community. For the villages within these PAs, household lists were obtained and households were randomly sampled for inclusion in the survey. For both urban and rural households, an approximate balance was maintained between male and female respondents to allow for gender comparison. Data on migrant status, living conditions in the household and the demographic characteristics of respondents were collected using the household questionnaire. For the purposes of this analysis, 1608 heads of households covered by the survey were selected as reference persons. Following data exploration, 1554 heads of household who have complete information on all the highly correlated variables relevant for the construction of a household living conditions index were selected for this study. Fifty-four households whose living conditions could not be determined due to missing information on some of the relevant household items were dropped from the analysis. Except for the missing information, there is no significant difference between the characteristics of those households that were dropped and those included in the analysis.
4.2 Measures
4.2.1 Dependent variable
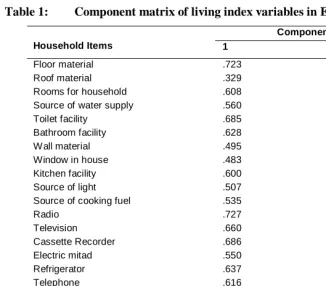
return, makes it implausible to regard any one year’s income as representative of the incomes earned over the longer time span in which demographic decisions are made (ibid). In consideration of these, sets of questions in the survey that relate to housing and living conditions were used to construct household living condition index. First, households were asked about the physical quality of their houses, in terms of materials used for building the wall, the roof and the floor, as well as the main source of light for the household, the nature of bathing and toilet facilities, and the number of rooms in the house. Second, they were asked to report about the ownership of various means of personal transportation and other household durables - a car, a bicycle, television, sofa, radio, electric fan, electric iron, electric stove, electric mitad, clock, insecticide sprayer, cassette recorder, cylinder, telephone, refrigerator, cart and plough. In order to use these variables to rank household living conditions, they were aggregated into a living standards index using principal component analysis. This data reduction method is used to determine the number of factors that can adequately explain observed correlations among variables. It has the advantage of compressing an assortment of variables into a few key factors, taking into account the correlations between them, and assigning appropriate weights to each of the observed variables in the form of factor scores. This procedure creates a set of mutually uncorrelated components of the data, and the first principal component is intuitively the linear index of the underlying variables that captures the most common variation among them (Filmer and Pritchett, 1999). In this analysis, of the 26 household items selected for an exploratory factor analysis, 19 that are highly correlated were selected as proxy variables for constructing the living standard index. The increase of the variance explained from 30 percent in the exploratory analysis to 36 percent for the 19 items, confirms that the higher the correlation between items in the analysis, the higher the variance explained (Kim and Mueller, 1978). The dependent variable (the index of living conditions) therefore is the regression scores of the first principal component (ranging from –1.47 to 2.97 with zero mean and standard deviation of 1). The wealth index score is a relative measure of household living conditions. The higher negative scores indicate poor living conditions; higher positive scores indicate higher and better standards of living. The nineteen variables used in the index and their factor loadings in two components are presented in
Table 1.
Table 1: Component matrix of living index variables in Ethiopia
Components
Household Items 1 2
Floor material Roof material Rooms for household Source of water supply Toilet facility
Bathroom facility Wall material Window in house Kitchen facility Source of light Source of cooking fuel Radio Television Cassette Recorder Electric mitad Refrigerator Telephone Clock Sofa set Eigen-values
% of variance explained
.723 .329 .608 .560 .685 .628 .495 .483 .600 .507 .535 .727 .660 .686 .550 .637 .616 .706 .525 6.88 36% .029 .678 .116 .236 .074 -.363 .413 .096 .576 -.117 .323 -.276 .339 -.205 -.294 -.258 -.261 -.269 -.351 1.95 10%
Extraction Methods: Principal Component Analysis.
context therefore (with its obvious limitations to collecting data on income and consumption), the use of household asset index represents a pragmatic approach to get around the problem of data limitations to examine issues (such as household welfare) critical for understanding poverty and providing evidence for poverty alleviation policies.
4.2.2 Independent and control variables
The survey provided data on migration status of heads of households in four migrant categories - non-migrants, permanent migrants, temporary migrants and return migrants. Migration is defined as movement out of a rural or urban place of origin that lasted for at least six months. Permanent migrants are those who left their places of origin and continue to reside in their places of destination. Return migrants are those who have lived outside their places of origin for up to six months but are currently returned to place of origin. Temporary migrants are migrants residing outside their places of origin for at least six months but periodically move back and forth between origin and destination. These four migration categories adequately represent the history of Ethiopia’s migration streams (Dejene, 1990; Gebre, 2001).
The study controls for socioeconomic and demographic factors, which includes education, gender, age, income sources (a close proxy for occupation), marital status, household size, housing tenancy, age of household, rural or urban and region of residence.
(reference), medium-sized households of 6-10 persons and large households of 11 members and above. In terms of income sources, the distinction is made between those who earn their income from agriculture coded 0 and others who do not coded 1. Non-agricultural sources of income include non-Non-agricultural businesses, wages, salaries, welfare/pension, remittances and rents.
Home ownership contributes to the well-being and happiness of families, and intensifies upward social mobility and wealth accumulation (Megbolugbe and Linneman, 1993; Wachter and Megbolugbe, 1992; Tipple and Willis, 1991). In sub-Saharan Africa, however, housing tenancy is more complicated than in developed countries. Researchers in the region have established that tenure choice transcends the two modal prototypes of owners and renters. In addition to this bimodal prototype are rent-free consumers or family-housers with family rights to housing either through inheritance or the favor of a living owner (Tipple and Willis, 1991). Indeed, Korboe (1992) estimates that about 25 per cent of all households are likely to fall within this category. While it may be argued that home ownership is implicated in the outcome of this study, substantial research have demonstrated that housing is fundamentally more of a producer than a consumer durable and has suggested that home ownership is a determinant not an indicator of living standards (Montgomery and Hewett, 2005). This variable is coded into three categories: owner-occupier housing (reference), rented homes and rent-free housers.
The survey determined households established before 1984 and those establish after. The year 1984 marked the 10th year anniversary of the coming to power of the socialist government (the Derg). Households formed before or during the early years of the regime, prior to the 1984-85 famine, are expected to benefit from the stability of previous years and the significant redistribution of property particularly land holdings. Those formed after 1984-85 are expected to be adversely affected by the resistance movements and war during the later years of the revolution.
environmental degradation and famine. This expectation is controlled for with a dummy variables coded 0 if residence is urban and 1 if rural.
Considerable differences exist among Ethiopian regions with respect to economic potentials, population densities, socioeconomic development and urbanization. The potential of Addis Ababa as an important destination for migrants is linked to its role as the national capital, which signifies a better concentration of facilities and opportunities (Gurmu et al, 2000). However the impact of the political conflicts and attendant economic deterioration of the city leaves a less optimistic expectation of the better life for the metropolis. The regional effects are examined along five regions: Oromiya (reference), Tigray, Addis Ababa, Amhara, and SNNPR (Southern Nations, Nationalities, and Peoples Region).
4.3 Analytical methods
The analysis of data includes a description of the study population followed by a bivariate analysis of the correlations between all categories of independent variables and living conditions index. Finally, a multivariate model using Ordinary Least Squares (OLS) is estimated to determine the independent effects of the predictor variables on living conditions net the effects of all other variables. The multivariate regression model developed for this purpose is:
Y = β0 + ∑β1k (Migration status) k + ∑β2k (Education) k + β3 (Sex of head) + ∑β4k (Age of Head)k + ∑β5k (Religion)k + ∑β6k (Marital Status)k + ∑β7k (Income Source)k + ∑β8k (Housing Tenancy)k +
∑β9k (Household Size)k + β10 (Household Age) + β11 (Rural Residence) + ∑β12k (Region of Residence) k + ε,
where, k represents categories of the predictors.
In consideration of multicollinearity concerns, with Addis Ababa being wholly urban, a multicollinearity test was conducted for all variables in the regression. The colinearity statistics2 (tolerance and VIF (variance inflation factor)) do not indicate a redundant predictor among all categories of independent and control variables. However, to check for the consistency of the estimates and the poverty level of Addis
2 Colinearity test produce the tolerance statistics and Variance Inflation Factor (VIF). The tolerance is an indication of the percentage of variance
Ababa relative to other regions, a regression model was run without the rural-urban variable and a fixed effects3 model was also run to control for regional unobservable factors that might bias the estimates.
5. Results
5.1 Socioeconomic characteristics of the study population
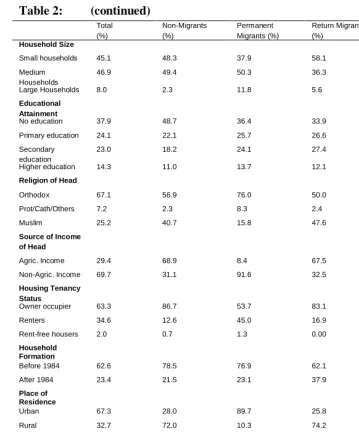
Table 2 summarizes the characteristics of the study population and their distribution by migration status. The table shows that most (58 percent) heads of household are permanent migrants. The corresponding proportions for other migration categories are: 5.4 percent temporary migrants, 8.0 percent return migrants and 28 percent non-migrants. The distribution conforms to high levels of out-migration from places of origin that is generally associated with famine, war and government-promoted resettlement programs.
The distribution of migrants by gender reflects the proportion of male to female heads of household in the overall sample, except for permanent migrants where the proportion of female heads is relatively higher than in the other migrant categories. This may be a reflection of what is observed from the national census that female heads are socially under pressure to migrate in the event of divorce or widowhood.
Table 2: Socioeconomic characteristics of heads of households by migration status
Total (%)
Non-Migrants (%)
Permanent Migrants (%)
Return Migrants (%)
Temporary migrants (%) Gender
Male 70.5 71.5 67.7 85.5 74.4
Female 29.5 28.5 32.3 14.5 25.6
Age of Head of Household
15-29 14.3 16.9 8.5 20.2 59.8
30-49 46.7 40.0. 50.1 53.2 28.0
50 and above 39.1 43.1 41.5 26.6 12.2 Marital Status
Never Married 8.2 9.6 4.1 4.0 55.7
Currently Married 68.6 74.5 69.9 76.6 34.2 Previously Married 21.4 15.9 25.9 19.4 10.1
3 To address the concern of regional unobservables that may bias the estimates; a fixed effects regression model was run by including regional
Table 2: (continued) Total (%) Non-Migrants (%) Permanent Migrants (%) Return Migrants (%) Temporary migrants (%) Household Size
Small households 45.1 48.3 37.9 58.1 87.8 Medium
Households
46.9 49.4 50.3 36.3 11.0
Large Households 8.0 2.3 11.8 5.6 1.2 Educational
Attainment
No education 37.9 48.7 36.4 33.9 11.3
Primary education 24.1 22.1 25.7 26.6 11.8 Secondary
education
23.0 18.2 24.1 27.4 35.0
Higher education 14.3 11.0 13.7 12.1 35.0 Religion of Head
Orthodox 67.1 56.9 76.0 50.0 56.1
Prot/Cath/Others 7.2 2.3 8.3 2.4 26.8
Muslim 25.2 40.7 15.8 47.6 17.1
Source of Income of Head
Agric. Income 29.4 68.9 8.4 67.5 1.3
Non-Agric. Income 69.7 31.1 91.6 32.5 98.8 Housing Tenancy
Status
Owner occupier 63.3 86.7 53.7 83.1 18.5
Renters 34.6 12.6 45.0 16.9 63.0
Rent-free housers 2.0 0.7 1.3 0.00 18.5 Household
Formation
Before 1984 62.6 78.5 76.9 62.1 10.6
After 1984 23.4 21.5 23.1 37.9 89.4
Place of Residence
Urban 67.3 28.0 89.7 25.8 91.5
Rural 32.7 72.0 10.3 74.2 8.5
Region of Residence
Tigray 19.7 29.2 18.4 8.1 1.2
Amhara 22.4 25.3 19.0 21.8 46.3
Oromiya 17.2 17.5 16.1 29.8 9.8
SNNPR 22.0 16.4 24.4 33.1 8.5
Addis Ababa 18.7 11.6 22.2 7.3 34.1
Total N=1554 n=440 n=908 n=124 n=82
The study population is one with very low levels of education: 24 percent have only primary education and 38 percent have no education. While this outcome is higher than the national literacy average, it reiterates the low levels of literacy in the country. When examined against migration status, there seem to be little selection, as those with primary or no education are almost evenly distributed among migrants and non migrants. Among non-migrants, 48 percent have no education and 22 percent attained primary education. For permanent migrants the outcome is 36 percent and 26 percent respectively. For return migrants the distribution is 35 percent (no education) and 26 percent (primary education). It is only among temporary migrants that an unusual 70 percent have at least a secondary education. This outcome may be related to the opportunities offered by government employment for educated Ethiopians who are posted to different regions of the country as teachers, health officers and agricultural extension workers. To the extent that these are government postings that often change at the whims of government policy and/or senior government officials, such middle level professionals are most likely to identify themselves as temporary migrants. There is also a noticeable presence of university students and poorly educated male and female service workers in urban areas among this group. In fact, job assignment is found to play a leading role on all their earlier moves (Gurmu et al, 2000). This may explain not only their levels of educational attainment in this sample but also their engagement outside the traditional farming sector, with consequent living conditions advantage relative to non-migrants discussed subsequently. This interpretation is consistent with results from the 1999 Labor Force Survey in Ethiopia, which identified not only a substantial category of migration due to transfer of the place of work, accounting for 23 percent of total migrant population in 1999, but also its urban destination character (Casacchia et al, 2001).
Orthodox Christianity is the dominant religious affiliation of all respondents constituting 67 percent of the study population. Again this parallels the dominance of Orthodox Christianity in the general population. Examined against migration status, the same picture prevails except that Muslims constitute a significant proportion of non- and return migrants. Those currently married are 68 percent of the total sample and dominate all migration categories, except among temporary migrants where the unmarried are dominant.
Twenty-nine percent of heads of household earn their incomes from agriculture, and 70 percent earn incomes from non-agricultural sources. This outcome is driven by permanent and temporary migrants among whom only 8.4 and 1.3 percent respectively earn agricultural incomes. Among non- and return migrants, the outcome is reversed with 69 and 68 percent respectively earning their incomes from agriculture.
Only 8 percent of households are composed of eleven persons or more. The dominance of small and medium-sized families prevails among migrants and non-migrants, and may reflect the decline in fertility that occurred in Ethiopia over the 1980s through the 1990s under the duress of economic and political crises (Lindstrom and Berhanu, 1999).
About 62 percent of households were formed before 1984; this distribution also holds for return migrants, and is even larger for permanent and non-migrants. However temporary migrants have relatively younger households with 89 percent of them formed after 1984. In terms of rural and urban residence, one observes a bi-polar distribution. While over 70 percent of non-migrants and return migrants reside in rural areas, approximately 90 percent of permanent and temporary migrants reside in urban areas. The sample is evenly distributed among the five regions of the country, but there are remarkable regional variations in terms of their migration status. Most non-migrants are concentrated in Tigray and Amhara, while permanent migrants mostly reside in SNNPR and Addis Ababa. Return migrants mostly reside in SNNPR, Oromiya and Amhara (in that order), whereas temporary migrants mostly reside in Amhara and Addis Ababa.
While this paper will underscore the explanations for some of the observed migration patterns, the primary question addressed in subsequent sections is the extent to which these variables and migration status are related to the living conditions of Ethiopian households.
5.2 Migration and living conditions: bivariate analysis result
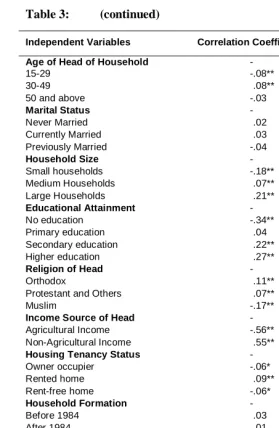
Table 3 shows the correlations between each category of the independent variables and living conditions. In this result, two complementary outcomes are observed.
Table 3: Correlations of categories of independent variables and living conditions index in Ethiopia (N=1554)
Independent Variables Correlation Coefficients (r)
Migration Status -
Non Migrants -.29**
Permanent Migrants .35**
Return Migrants -.15**
Temporary Migrants -.02
Gender -
Male .02
Table 3: (continued)
Independent Variables Correlation Coefficients (r)
Age of Head of Household -
15-29 -.08**
30-49 .08**
50 and above -.03
Marital Status -
Never Married .02
Currently Married .03
Previously Married -.04
Household Size -
Small households -.18**
Medium Households .07**
Large Households .21**
Educational Attainment -
No education -.34**
Primary education .04
Secondary education .22**
Higher education .27**
Religion of Head -
Orthodox .11**
Protestant and Others .07**
Muslim -.17**
Income Source of Head -
Agricultural Income -.56**
Non-Agricultural Income .55**
Housing Tenancy Status -
Owner occupier -.06*
Rented home .09**
Rent-free home -.06*
Household Formation -
Before 1984 .03
After 1984 .01
Place of Residence -
Urban .59**
Rural -.59**
Region of Residence -
Oromiya .11**
Tigray .11**
Amhara -.22**
SNNPR -.07**
Addis Ababa .09**
First, being a permanent migrant, an urban resident, earning income from non-agricultural enterprises, living in Oromiya and Tigray regions, and having secondary and higher education are all positively correlated with living conditions. Conversely, living in rural areas of Ethiopia, earning income from agricultural enterprises, having no education, being a non- or a return migrant, living in Amhara region and belonging to a small-sized household of 1-5 persons (in descending order of magnitude) are most negatively correlated with household living conditions. Though these correlations are informative and mostly significant, they are not especially high, the highest being .59 and -.59 (scores for urban and rural residence respectively). The next section presents a multivariate regression analysis which refines and modifies these outcomes by taking account of confounding variables.
5.3 Multivariate analysis
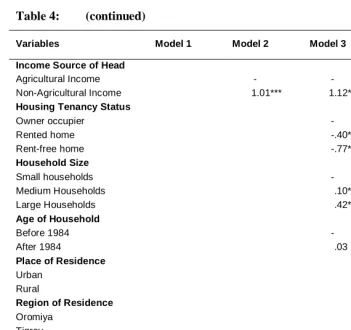
In order to determine the net effects of the independent and control variables, four estimated multivariate regression models are summarized in Table 4. In Model 1, with non-migrants as the reference category, the outcome replicates the result of the bivariate analysis above, with permanent migrants better off than other groups in living conditions. Similarly, temporary migrants show significantly better living conditions than non-migrants. However, with the introduction of control variables in Models 2, 3, and 4, the results generally indicate no independent significant relationship between internal migration status and improved living conditions. In Model 2, controlling for the individual characteristics of the heads of household, the significant advantage of permanent migrants over non-migrants disappeared and temporary migrants become significantly worse off. In Models 3 and 4, controlling for household and community effects, the results indicate no independent significant relationship between the migration status and household living conditions. While these outcomes generally run contrary to the conventional expectations of the benefits of migration as a household survival strategy in a locally restrictive environment, it underscores both the role of migration selectivity in the perceived implication of migration for improved living conditions and the particular historical context of Ethiopia during the last three decades.
of education as in Model 2. In Model 4 controlling for urban and rural residence and regional differences, the results show that secondary education improves living conditions by 58 percent and higher education improves living conditions by 86 percent relative to those with no education.
In terms of the gender of head, households with female heads have significantly better living conditions than males. However the strength of the relationship decreases with the introduction of additional controls in Models 3 and becomes only marginally significant in Model 4.
Table 4: OLS regression coefficients of living conditions in Ethiopia (N=1554)
Variables Model 1 Model 2 Model 3 Model 4
Migration Status
Non Migrants - -
Permanent Migrants .75*** .07
Return Migrants -.06 -.10
Temporary Migrants .39*** -.36**
Educational Attainment
No education - - -
Primary education .24*** .22*** .14***
Secondary education .72*** .69*** .57***
Higher education .96*** .96*** .86***
Gender
Male - - -
Female .21*** .18** .14*
Age of Head of Household
15-29 - - -
25- 49 .29*** .22*** .19**
50 and above .49*** .35** .29***
Religion of Head
Orthodox - - -
Protestant/Catholic/ Others .06 -.02 -.01
Muslim .12* .07 .17**
Marital Status
Never Married - - -
Currently Married 0.9 -.02 -.12
Table 4: (continued)
Variables Model 1 Model 2 Model 3 Model 4
Income Source of Head
Agricultural Income - - -
Non-Agricultural Income 1.01*** 1.12*** .36***
Housing Tenancy Status
Owner occupier - -
Rented home -.40*** -.35***
Rent-free home -.77*** -.63***
Household Size
Small households - -
Medium Households .10* .06
Large Households .42*** .35***
Age of Household
Before 1984 - -
After 1984 .03 -.001
Place of Residence
Urban -
Rural -1.00***
Region of Residence
Oromiya -
Tigray -.01
Amhara -.63***
SNNPR -.38***
Addis Ababa -.44***
Intercept -.45*** -1.54*** -1.37*** 0.13
R2 .13 .42 .47 .56
F for R Square Change 77.3*** 12.9*** 27.1*** 145***
Levels of Statistical Significance: *** P<. 001, **P<. 01, *P<. 05
Muslims have marginally better living conditions than other religious groups in Models 2 and 4, though the relationship is not statistically significant in Model 3.
accumulated advantages over the life course in a harsh environment and deteriorating economy.
Ethiopians who earn incomes from non-agricultural enterprises like trading, those who earn salaries, and those who receive remittances and rents are significantly better off than those who earn agricultural incomes. This remains true in Models 2 and 3. In Model 4, with regional and urban/rural controls, the variation among different income sources is weaker but remains significant.
In Models 3 and 4, living in a rented home is related to a decrease in household living conditions by 40 percent and 35 percent respectively relative to living in own homes. On the other hand, living in a rent-free home is related to a 77 percent decrease in living conditions in Model 3 and a 63 percent decrease in Model 4.
Looking at the association between household structure and living conditions, the outcome indicates a marginal advantage for medium-sized households (6-10 persons) compared to small-sized households (1-5 persons). However, there is a profound advantage of large household structures (11 persons and above) over small-sized households by 43 percent in Model 3, and 35 percent in Model 4.
Finally, living in rural Ethiopia is associated with a significant decrease in living conditions when compared to living in urban areas. In terms of region of residence, there is no significant difference between living in Oromiya and Tigray. However, relative to living in Oromiya, living in SNNPR, Addis Ababa and Amhara significantly decreases living conditions by 38 percent, 44 percent and 63 percent respectively. The results of the regression model without the urban/rural variable, and that of the fixed-effect model, did not yield significantly different outcomes; hence they were not presented here.
6. Discussion and conclusions
The multivariate results show that the significant living conditions advantage of permanent and temporary migrants over non-migrants in Model 1 are primarily due to selectivity into migration status by education and occupation. A step by step introduction of each variable into the regression pinpoints education and access to non-agricultural sources of income as the individual variables mostly responsible for varying effects of migration status across models (tables not shown). When education was introduced into the analysis, the significant advantage observed for permanent migrants over non-migrants remained but that observed for temporary migrants disappeared. Further, when sources of income (a proxy for occupation) were introduced into the model, the significant advantage of permanent migrants over non-migrants disappeared and temporary migrants became significantly disadvantaged. These outcomes point to the selectivity of permanent migrants into mostly non-agricultural employment and temporary migrants into both higher education and non-agricultural employment. Despite the low levels of education of most permanent migrants (26 percent have primary education and 36 percent had none at all), stable urban residence with an overwhelming access to employment in the non-agricultural sector is key to their living conditions. For temporary migrants, their educational attainment advantage (35 percent have secondary education and another 35 percent attained higher education) and employment mostly in the non-agricultural sector account for their living conditions.
most Meketel settlers, nor throughout the country. “Had they not migrated to Metekel, many of the settlers would have avoided the two famines” (Gebre, 2001).
From the backdrop of the foregoing, migration may be relevant for improved living conditions in Ethiopia if migrants are educated and able to gain access into non-agricultural livelihood sources. However with low levels of education, poor economic opportunities, high levels of unemployment in the urban centers and recurring conflicts, the resort to migration to supposedly better environments, as an individual and household survival strategy and official policy response to periodic drought and famine, may not improve living conditions, it may worsen the situation. The economic, psychological and social stability that may help to translate migration into better living conditions seem to be generally lacking in the country in the period under consideration. With a national literacy rate of 29 percent in 1999-2000 (FDRE 2002:13), policy efforts at poverty alleviation may be effective if they emphasize the promotion of higher education and non-farming livelihood opportunities.
One significant outcome from the descriptive analysis is the low level of participation in agriculture. This outcome obviously does not reflect the efficiency of the agricultural sector, as in developed societies where lower participation reflects better factor utilization. Rather, this may be an indicator of the dwindling levels of participation in the sector following drought, famine, war, and resettlements. Lindstrom and Berhanu (1999) show that the sequence of land and business nationalization, rural resettlement programs, political crackdowns and wars in the 1970s through the 1990s was highly disruptive of economic activity. Accordingly, agricultural production among other economic activities stagnated and real per-capita income fell (Hansson, 1995). This helps to explain the low levels of living conditions associated with agriculture as an income source in this analysis. Agriculture is the primary source of sustenance for people living in rural areas and it is generally the first victim of environmental stress. Research in developing countries confirms that the poor primarily live in rural areas and are predominantly dependent on agriculture. In Ethiopia, rural areas are identified as the worst hit by drought and famine. With no fundamental technological restructuring of agriculture and little or no potential returns to education in the sector, more educated people are likely to continue to migrate to urban areas, thereby depriving rural areas the much needed human capital to boost her transformation and development.
Latin America, in which nuclear households are worse-off than extended households in terms of household amenities and possessions (Gage et al 1997; Cronk, 1991; Otite, 1991). Locoh (1994) have identified the protective role of large families under pervasive uncertainties associated with fluctuations in economic and political conditions, as in Ethiopia.
One surprising outcome is the identified advantage of female-headed households over male-headed households. While this outcome is viewed with caution, other studies in Ethiopia have offered some plausible explanations. One of such explanation is the dominance of men in agriculture, particularly pastoralism, which is a highly vulnerable livelihood system in the country. Constant severe droughts, conflict over land and war cause large-scale livestock mortality, and makes moving to fresh grazing lands almost impossible. This results in thousands of displaced people moving to towns and camps in search of food and employment. In contrast, women are mostly associated with off-farm livelihood activities like handcrafts, sewing, selling of food and petty trading which are more detached from environmental hazards (Massow, 1999). In addition, relief work and the efforts to deliver aid to famine affected areas also may have reduced relocation of women (Berhanu and White, 2000). This becomes even more plausible against the background that most programs on poverty alleviation target women than men. Under these circumstances, female-headed households may have benefited from the advantages of stationary populations and programs that assist their livelihood sustenance. The extent to which the outcome in this analysis is valid may represent the perspective that people are poor and become poor not because they are male or female, but because they are subjected to socioeconomic and political processes that deprive them of access to material conditions of existence (Gimenez, 1999). This underscores the point that programs that target only female poverty may be missing the second half of the fundamentally vulnerable group: poor men.
(Yilma, 2005). In contrast, the concentration of poverty over three regions, particularly Amhara, is congruent with the findings of other studies in the area. The creation of new federated regions based on ethnic nationalities in the early 1990s resulted not only in massive return migration of northern ethnic groups resettled in the south and southwest, but also in widespread human right abuses, including the loss of many lives in which Amhara ethnic settlers in the south were the primary victims (Ezra, 2001). Sharp et al (2002) confirm Ahmara as the region most vulnerable to poverty, and classified 76 percent of households in the region as destitute, significantly food insecure, and less able to meet their basic needs. For the non-destitute households, less than half (43 percent) live in visibly inadequate housing.
Finally, the low levels of living conditions in Addis Ababa raised the genuine concern about the validity of the estimates, but statistical operations (tests of multicollinearity and fixed-effects models to control regional unobservables) specifically to verify the status of the metropolis relative to other regions did not significantly alter this status for the national capital. Apart from a high-level of urban unemployment, decline in real income among employed persons, and the shortage of urban housing, the Red Terror and insecurity due to political problems were more severe in Addis Ababa than in any other city (Berhanu and White, 2000). Recent studies that found below replacement fertility in Addis Ababa primarily attribute the outcome to poverty and high cost of living in the city. This outcome continues to reiterate the increasing concern about the urbanization of poverty in developing countries particularly in sub-Saharan Africa (UN-HABITAT, 2003). In sum, the regional imbalance identified in this analysis, underscores the magnitude of policy efforts needed to promote even development and address issues related to living conditions’ inequity in Ethiopia.
7. Acknowledgements
References
Adepoju, A. (1977). Migration and Development in Tropical Africa: Some Research , Priorities. African Affairs, 76(33): 210-225.
__________ . (1983). Selected Studies on Dynamics, Patterns and Consequences of Migration: Medium-Sized Towns in Nigeria. Paris, UNESCO, Vol. IV. Pp7-8.
___________. (1995). Emigration Dynamics in sub-Saharan Africa. International Migration. Special Issue: Emigration Dynamics in Developing Countries, Vol. 33, nos. 3/4.
Andersson, J.A. (2001). Mobile Workers, Urban Employment and ‘Rural’ Identities: Rural-Urban Networks of Buhera Migrants, Zimbabwe. In: M. Dedruijn, R. Van Dijk and Dick Foeken (Eds.), Mobile Africa: Changing Patterns of Movement in Africa and Beyond. Lieden, the Netherlands: Brill.
APHRC. (2002). Population and health dynamics in Nairobi Informal Settlements. Nairobi, Kenya: African Population and Health Research Center (APHRC).
Arhinful, D.K. (2001). “We Think of Them”: How Ghanaian Migrants in Amsterdam Assist Relatives at Home. Leiden: African Studies Center, Research Report 62.
Bariagaber, A. (1995). Linking Political Violence and Refugee Situations in the Horn of Africa: An Empirical Approach. International Migration, 33(2): 209-234.
Berhanu, B. and M.J.White. (2000). War, Famine and Female Migration in Ethiopia, 1960-1989. Economic Development and Cultural Change, 49 (1): 91-113.
Brockerhoff, M and Brenan, E. (1998). The poverty of cities in developing countries. Population and Development Review, 24 (1):75-114.
Casacchia, O., M. Crisci and C. Reynaud, (2001). Chapter 3: Internal Migration in Ethiopia. In: Migration and Urbanization in Ethiopia, with Special Reference to Addis Ababa. www.irpps.cnr.it/etiopia/sito/progetto3.htm
Central Statistical Authority (1992).The analysis of local moves and internal migration, Vol. II. Addis Ababa, Ethiopia: Central Statistical Authority.
_______. (1999). The 1994 Population and Housing Census of Ethiopian: Result at Country Level, Vol.11 Analytical Report, June 1999. Addis Ababa, Ethiopia: Central Statistical Authority.
Clapham, C. (1991). The Structure of Regional Conflict in Northern Ethiopia. Disasters 15(3): 244-253.
Cohen J.M. and N.H. Isaksson. (1987). Villagization in the Arsi region of Ethiopia. Uppsala: Swedish University of Agricultural Sciences.
Cronk, L. (1991). Wealth, Status and Reproductive Success among the Mukogodo of Kenya. American Anthropologist 93:345-360.
Dejene, A. (1990). Environment, Famine, and politics in Ethiopia: A view from the Village. Boulder and London: Lynne Rienner Publishers.
Dijk, H.V. and Dick Foekan and Kiky van Til. (2001). Population Mobility in Africa: An Overview. In M. De Bruijn, Rilk Van Dijk and Dick Foekan (Eds.), Mobile Africa: Changing patterns of Movement in Africa and Beyond. Leiden: Brill.
Ezra, M. (2001). Ecological Degradation, Rural Poverty, and Migration in Ethiopia: A Contextual Analysis. Policy Reasearch Division, Population Council Working Paper, No. 149.
FDRE. (2002). Household Income, Consumption and Expenditure (HICE) Surveys, 1999/2000. Addis Ababa: Federal Democratic Republic of Ethiopia (FDRE).
Filmer D. and Pritchett, L. (1998). Estimating wealth effects without income or expenditure data-or tears: Educational enrolment in India. World Bank policy Research Working Paper No.1994. Washington DC: The World Bank.
_____. (1999). The effects of Household Wealth on Educational Attainment: Evidence From 35 Countries. Population and Development Review 25(1): 85-120.
Fischer, P. A., Reiner Martin, and Thomas Straubhaar, (1997). Should I Stay or Should I Go? In: International Migration, Immobility and Development: Multidisciplinary Perspectives. Oxford and New York: Berg.
Gage, J.A., Sommerfelt, E., Paini, A.L. (1997). Household Structure and Childhood Immunization in Niger and Nigeria. Demography 34(2): 295-309.
Gebre, Y.D. (2001). Population Displacement and Food Insecurity in Ethiopia: Resettlement, Settlers and Hosts. University of Florida: PhD Dissertation.
Golini, A., M. Said, O. Casacchia, C. Reynaud, S. Basso, L. Cassata, and M. Crisci (2001) Migration and Urbanization in Ethiopia, with special reference to Addis Ababa. La Sapienza, Roma: Department of Demographic Sciences, University of Roma, and Addis Ababa: Central Statistical Authority.
Gurmu, E., Sidney Goldstein and Alice Goldstein, (2000). Migration, Gender and Health Survey in Five Regions of Ethiopia: 1998. (A United Nation Training and Research Project on the Interrelations of Migration and Economic Change, Women’s Status, Reproduction and Health). Addis Ababa: Addis Ababa University and Providence: Brown University.
Gwatkin, D.R., S. Rustein, K. Johnson, R.P. Pande, and A.Wagstaff. (2000). Socioeconomic Differences in Health, Nutrition, and Population in Kenya. Washington, DC: HNP/Poverty Thematic Group, The World Bank.
Hansson, G. (1995). The Economy of Ethiopian Economy 1974-1994: Ethiopia Tikdem and After. London: Routledge.
Harrison, P. (1982). Inside the third world. Harmondsworth, UK: Penguin.
Hogan, D.P. and Biratu, B. (2004) Social Identity and Community Effects on Contraceptive Use and Intentions in Southern Ethiopia. Studies in Family Planning, 35 (2): 79 - 90.
Kibreab, G. (1987). Refugees and developments: The case of Eritrea. Trenton, N.J.: The Red Sea Press.
__________(1996). Eritrea and Ethiopian Refugees in Khartoum: What the Eyes Refuses to See. Africa Studies Review, 39(3):131-178.
Kidane, A. (1989). Demographic Consequences of the 1984-1985 Ethiopian Famine. Demography, 26(3): 515-522.
Kim, J. and Mueller, C.W. (1978). Introduction to Factor Analysis: What It Is and How To Do It. California: Sage Publications Ltd.
Kiros, G-E. and M.J. White. (2004). Migration, community context and child immunization in Ethiopia. Social Science and Medicine, 59: 2603-2616.
Kloos, Helmut. (1990). Health aspects of resettlement in Ethiopia. Social Science & Medicine, 30(6): 643-656.
Famines in Ethiopia: Implications for Food Aid and Rehabilitation. Disasters, 18(23): 130-139.
Korboe, D. (1992). Family-houses in Ghanaian cities: to be or not to be? Urban Studies, 29: 1159±1172.
Lindstrom, D.P. and Berhanu, B. (1999). The Impact of War, Famine, and Economic Decline on Marital Fertility in Ethiopia. Demography, 36(2): 247-261.
Lipton, M. (1976). Why poor people stay poor: Urban bias in world development. Cambridge, MA: Harvard University Press.
Lloyd, C.B. (2005) Growing Up Global: The Changing Transitions To Adulthood In Developing Countries. Washington, DC: The National Academies Press.
Lockwood, V. S. (1990). Development and Return Migration to Rural Polynesia.International Migration Review, 24(2): 347-371.
Locoh, T. (1994). Will the Decline in Fertility in Sub-Saharan Africa Last? A Time of Uncertainty. In: T. Locoh and V. Hertrich (eds.) The Onset of Fertility Transition in Sub-Saharan Africa, Liege: IUSSP.
Makinwa, P.K. (1981). Internal Migration and Development in Nigeria: Lessons From Bendel State. Ibadan: Heineman Educational Books (Nig) Ltd.
Mariam, M.W. (1985). The social consequences of famine. In Fasil Gebre-Kiro (ed) Changing Rural Poverty. Trenton: Africa World Press.
Massow, von F. (1999). Oxfam Policy Department: Health and Education in Ethiopia, Summary Reports. London: Oxfam Working Papers.
Mclanahan, S. and Booth, K. (1989). Mother-Only Families: Problems, Prospects and Politics. Journal of Marriage and the Family, 51(3): 557-580.
Megbolugbe, I.F. and Linneman, P.D. (1993). Home-ownership. Urban Studies, 30: 659-682.
Montgomery, M., M. Gragnolati, K. Burke, and E. Paredes (2000). Measuring Living Standards with Proxy Variables. Demography, 37(2): 155-174.
Montgomery, M. and Hewett, P. (2005). Poverty and Children’s Schooling in Urban and Rural Senegal. Policy Research Division Working Paper no. 196. New York: Population Council.
_______________. 2003. Understanding Poverty in Nigeria. Ibadan: NISER.
Otite, O. (1991). Marriage and Family Systems in Nigeria. International Journal of Sociology of the Family, 21: 15-54.
Pankhurst, A. (1992). Resettlement and Famine in Ethiopia: the villagers; experience. Manchester: Manchester University Press.
Porter, A. (1986). Resettlement in Ethiopia. Lancet, 1, 217.
Rafiq M. and Hailemariam A. (1987). Some structural aspects of urbanization in Ethiopia. Genus. 43(3-4):183-204.
Sharp, K., S. Devereux, and Y. Amare. (2002) Destitution in Ethiopia's Northeastern Highlands (Amhara National Regional State). Sussex: University of Sussex for Save the Children United Kingdom.
Stark, O. and Bloom D.E. (1985). The new economics of labor migration. American Economic Review, 75: 845-867.
UN-HABITAT. (2003). The Challenge of Slums: Global Report on Human Settlements. London and Sterling: Earthscan.
Wachter, S.M. and Megbolugbe, I.F. (1992). Racial and ethnic disparities in Homeownership. Housing Policy Debate, 3: 333 -370.
Wagstaff, A., P. Paci, and E. van Doorslaer. (1991). On the measurement of inequalities in health. Social Science and Medicine, 33(5): 545-557.
Webb, P. and J. von Braun. (1994). Famine and Food security in Ethiopia: Lessons for Africa. Chickesther, United Kingdom: Wiley.
Willis, K.G. and Tipple, A.G. (1991) Economics of multihabitation: housing conditions, Household occupancy and household structure under rent control, inflation, and non-marketability of ownership rights. World Development, 19(1705-1720).
Yilma, T. (2005). The Eriterean and Tigrean Ascaris War in Defense of a Colonial Boundary: Badme. Http://www.ethiopic.com/ethiopia/tilahun6.htm.