* Corresponding Author - E-mail: [email protected]
Optimization of parameters affecting separation of gas
mixture of O
2, N
2, CO
2and CH
4by PMP membrane
modified with TiO
2, ZnO and Al
2O
3nanoparticles
Afshar Alihosseini
1,*, Davood Zergani
1, Amir Hossein Saeedi Dehaghani
21Department of Chemical Engineering, Faculty of Engineering, Central Tehran Branch, Islamic Azad University,
Tehran, Iran
2Faculty of Chemical Engineering, Department of Petroleum Engineering, Tarbiat Modares University, Tehran, Iran
Received: 31 May 2019, Accepted 3 August 2019
ABSTRACT
T
he application of membranes in various industries is one of the most urgent needs to reduce energy consumption and environmental pollutants as well as low investment costs in the process of separation. Inthis investigation, the optimization of effective parameters for separation of gas mixture of CH4, CO2, O2
and N2 is studied by modified poly(4-methyl-1-pentane) (PMP) membrane including nanoparticles (TiO2, ZnO,
Al2O3). Design expert software was used and prevailing data on membrane modeling were categorized according
to the process variables such as permeability, selectivity, composition and percentage of nanoparticle, and gas pressure difference. In order to validate the model, the results predicted by the model were compared with the experimental data. Good agreement was observed between the predicted and experimental data, and it was found that nanoparticles have a considerable effect on the results. In the case of gas permeability, the best results were obtained for the nanoparticles of alumina (15 wt%) at the pressure of 3 bar. However, titanium dioxide nanoparticle (10 wt%) at the pressure of 9 bar showed the best results for gas selectivity. The optimum point for both permeability
and selectivity was obtained for the membrane containing 10 wt% titanium dioxide at 5 bar. Polyolefins J (2020)
7: 13-24
Keywords: Poly(4-methyl 1-pentane), Permeability, Selectivity, Titanium dioxide, Aluminum oxide.
ORIGINAL PAPER
INTRODUCTION
In recent years, gas separation is progressively per-formed by separation methods such as absorption, adsorption, and cryogenic distillation by novel
tech-nologies like membrane systems [1-4]. Industries con
-tinually are looking for a new method to reduce en-vironmental pollution, reduce energy consumption and lower investment costs, so the approach has changed to
use membranes in industries such as natural gas
sweet-ening [5]. Over the past decade, this technology showed
an immense growth compared to the conventional gas
separation processes [6]. The matter of gas separation
has been verified in several professions and many ap
-plications [7,8]. The advantages of membrane sepa
compact structure, lower operating and maintenance cost, ease of processing and also the least impact on the environment cause to gain interest in various
in-dustries [9,10]. Hassanajili et al. studied the efficacy
of metal nanoparticles on the separation of CH4 and
CO2 pure gases for two nanocomposite membranes
of polyesters. The net gas permeability test illustrates
that the permeability improves along with the rising
silica content. This might be related to the increase
in the free volume of the polymer network caused by
the separation of the molecular chain [11]. Also, they investigated the property of mixed component of PMP
and silica particles in the separation of n-C4H10/CH4.
Results of their research showed that pure PMP mem
-brane has different gas permeability properties
com-pared to PMP/silica compound. Adding the silica in the PMP polymer matrix resulted in gas permeability
and selectivity of n-C4H10/CH4 enhancement. Selec -tivity of n-C4H10/CH4 was 13 for the pure PMP and the selectivity for the PMP filled with 45 wt% silica increased to 26. Furthermore, the permeability of
n-C4H10 increased about 3 to 4 times compared to the
pure PMP [12]. Abedini et al. investigated the sepa
-ration and purification of hydrogen with embedding MIL53 particles on PMP mixed matrix membranes
(MMMs). Their results showed that solubility of hy
-drogen compared to CO2 decreased significantly with
increasing the MIL53 particle in PMP matrix. Increas
-ing of feed pressure and the embedd-ing of
nanopar-ticles increase the CO2/H2 selectivity and permeability
of CO2 [13].
The result of functionalized NH2-MIL45 particles
on the features of PMP in the separation of CO2/CH4
was investigated separately in another research by
Abedini et al. According to these results, by increasing particle loading in the polymer matrix, an enhance
-ment occurred in the permeability of CO2. Moreover,
CO2/CH4 selectivity was enhanced considerably [14].
In fact, among the known polymers in gas separation
processes, PMP has the superior permeability of pure hydrocarbons [15] and therefore PMP is introduced
as a proper material to fabricate dense homogeneous
membranes for gas separation. Pechaf et al [16] have studied the combination of polyimide and zeolite as a polymer membrane. For this object, they prepared a mixed network membrane made up of polyimide and
20 wt% zeolite and then analyzed the permeability data for gases including O2, CO2, N2, and CH4. The
permeability of N2 and O2 gases decreased, but it
in-creased for CH4 and CO2. This change in permeability
is strongly influenced by the changes in the perme
-ability coefficient. Matteucci et al studied the perme
-ability of CH4, N2 and CO2 by adding TiO2
nanopar-ticles to poly (1-trimethylsilyl-1-propyne) (PTMSP).
Results showed that permeability of these gases in-creased more than 4 times in comparison with the pure
polymer [17]. Also, they studied the effect of TiO2 nanoparticles on 1, 2-polybutadiene (PB) in another research. Obtained results showed that in a membrane
containing 27 vol.% TiO2 nanoparticles, permeability
coefficients of CO2, CH4, N2 ,and H2 gases increased
3 times in comparison with the pure polymer. Further
-more, the solubility coefficient of the gases increased
by adding the nanoparticles to the polymer, while the
permeability coefficients decreased by addition of the nanoparticles [18].
Statistical modeling has been utilized as a method
to evaluate the effect of various variables including
adding nanoparticles zinc oxide (ZnO), aluminum
oxide (Al2O3), titanium dioxide (TiO2) to PMP mem
-brane on both structural characteristics of the
mem-branes and performance of the polymeric memmem-branes.
Furthermore, a statistical method was employed in a
previous work to research and optimize permeability
and selectivity on the polymer membranes for the gas
separation [19]. Experimental data for permeability
and selectivity of different gases for several polymer
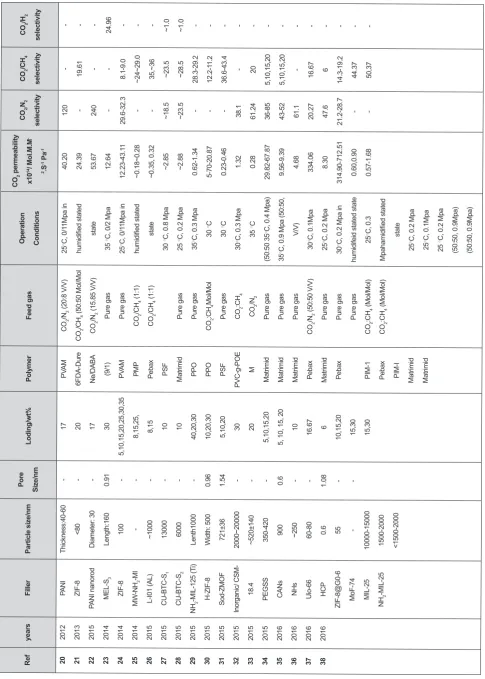
membranes are summarized in Table1.
According to the above-mentioned parameters that can affect the membrane properties and the problems involved in high-performance membranes, the main
objective of this study is to investigate the percentage
of ZnO, Al2O3 and TiO2 nanoparticles added to PMP
membrane for evaluating the effect of nanoparticle type and its percentage on improvement of the gas
permeation and separation performance in the mixed matrix membranes. Moreover, another aim of this study is to use the design expert software to identify the influences of the experimental variables to reach
optimal conditions for high-performance mixed ma
Table 1. Experimental data for permeability and selectivity of different gases for several polymer membranes.
CO
2
/H2
selectivity
CO
2
/CH
4
selectivity
CO
2/
N2
selectivity
CO
2
permeability
x10
14/ Mol.M.M
-2.S -1 Pa
-1
Operation Conditions
Feed gas
Polymer
Loding/wt%
Pore Size/nm
Particle size/nm
Filler
years
Ref
- -
-24.96 - - - ~1.0 ~1.0 - - -
-19.61 - - 8.1-9.0
~24~29.0 35,~36 ~23.5 ~28.5 28.3-29.2 12.2-1
1.2
36.6-43.4
- 20 5,10,15,20 5,10,15,20
-16.67 6
14.3-19.2 44.37 50,37
120 - 240
-29.6-32.3
-
-~18.5 ~23.5 - - - 38.1 61.24 36-85 43-52 61.1 20.27 47.6
21.2-28.7
-
-40.20 24.39 53.67 12.64
12.23-43.1
1
~0.18~0.28 ~0.35, 0.32 ~2.85 ~2.88 0.62-1.34 5-70-20.87 0.23-0.46 1.32 0.28 29.82-67.87 9.56-9.39 4.68 334.06 8.30
314.90-712.51 0.60,0.90 0.57-1.68
25
○C, 0/1
1Mpa in
humidified stated
state
35
○C, 0/2 Mpa
25
○C, 0/1
1Mpa in
humidified stated
state
30
○C, 0.8 Mpa
25
○C, 0.2 Mpa
35
○C, 0.3 Mpa 30 ○C
30
○C
30
○C, 0.3 Mpa 35 ○C
(50:50 35
○C, 0.4 Mpa)
35
○C, 0.9 Mpa (50:50,
V/V)
30
○C, 0.1Mpa
25
○C, 0.2 Mpa
30
○C, 0.2 Mpa in
humidifeid stated state
25
○C, 0.3
Mpahamidified stated
state
25
○C, 0.2 Mpa
25
○C, 0.1Mpa
25
○C, 0.2 Mpa
(50:50, 0.9Mpa) (50:50, 0.9Mpa)
CO
2
/N2
(20:8 V/V)
CO
2
/CH
4
(50:50 Mol/Mol
CO
2
/N2
(15.85 V/V)
Pure gas Pure gas
CO
2
/CH
4
(1:1)
CO
2
/CH
4
(1:1)
Pure gas Pure gas
CO
2
:CH
4
Mol/Mol
Pure gas CO
2
:CH
4
CO
2
/N2
Pure gas Pure gas Pure gas
CO
2
/N2
(50:50 V/V)
Pure gas Pure gas Pure gas
CO
2
:CH
4
(Mol/Mol)
CO
2
:CH
4
(Mol/Mol)
PV
AM
6FDA-Dure Ne/DABA (9/1) PV
AM
PMP Pebax PSF
Matrimid PPO PPO PSF
PVC-g-POE
M
Matrimid Matrimid Matrimid Pebax Matrimid Pebax PIM-1 Pebax PIM-I Matrimid Matrimid
17 20 17 30
5,10,15,20,25,30,35
8,15,25, 8,15 10 10 40,20,30 10,20,30 5,10,20 30 20 5,10,15,20
5, 10, 15, 20
10 16.67 6
10,15,20 15,30 15,30
- -
-0.91 - - - 0.96 1.54 - - - 0.6 - - 1.08 -
-Thickness:40-60
<80
Diameter: 30 Length:160
100 - ~1000 13000 6000
Lenth1000 Width: 500 721±36 2000~20000 ~520±140 350-420 900 ~250 60-80
0.6 55
-10000-15000 1500-2000 <1500-2000
PANI ZIF-8 PANI nanorod MEL-S
3
ZIF-8
MW
-NH
2
-MI
L-I01 (AL) CU-BTC-S
1
CU-BTC-S
2
NH
2
-MIL-125 (T
i)
H-ZIF-8 Sod-ZMOF
Inorganic/
CSM-18.4 PEGSS CANs NHs Uio-66 HCP
ZIF-8@G0-6 MoF-74 MIL-25 NH
2
-MIL-25
2012 2013 2015 2014 2014 2014 2015 2015 2015 2015 2015 2015 2015 2015 2015 2016 2016 2016 2016
CO2 gases have been studied in order to investigate
the specifications in the employed PMP membrane
by nanoparticles. These experiments were also opti
-mized and modeled for the industrial applications in gas separation.
EXPERIMENTAL
Methodology
PMP with low molecular weight (Sigma Aldrich) was
used as the membrane in the background phase, while
the nanoparticles ZnO, Al2O3, TiO2 added to PMP membrane as mineral modifiers were purchased from Aldrich Chemical Company (Milwaukee, USA). The average size of the used nanoparticles was 20-30 nm,
while they have been used in various contents from
5-15%. The permeability of pure gases including N2,
O2, CH4, and CO2 was measured in a pure membrane
and PMP membrane modified with the nanoparticles. Eq. (1) is used to calculate gas permeability:
(
1 2)
ql P
P P A
=
− (1)
where P is the gas permeability, q is the flow rate of
permeate gas, l is the membrane thickness, P1-P2 is the pressure drop in the membrane, and A is the
perme-ation area. The selectivity of the gas pairs was calcu
-lated by dividing the ratio of the gas permeability. Eq
2 is used to evaluate the ratio of selectivity of gas A
to gas B.
A AB
B P S
P
= (2)
Where SA/B is selectivity, PA is gas A permeability and PB is gas B permeability.
Statistical analysis and design expert
The design expert software (Version 7.0.0, 2005) has been used for evaluation of the equation coefficients
and data regression analysis. Design expert is a soft
-ware for designing of experiments, modeling, evaluat
-ing the effects of different variables and find-ing the optimized conditions to get a response. For this object,
design expert has been applied for designing of the ex
-periments and statistical analysis, in order to prepare
an effective model. For the purpose of statistical cal
-culations, experimental variables of Yactual in the frame
of Ycoded have been coded on the basis of the following
equation:
actual
coded Y Y
Y
Y
− =
D (3)
Ycoded is the coded (dimensionless) amount of the vari
-ables (Yactual),
Y
is the average amount (Yactual) and“DY” gives the difference between
Y
and Yactual. Eq. 4 is the response as a function of variables withmultiple regression applications using the least square
method.
0 1 1 2 2 3 3 4 4 12 1 2 13 1 3
F A AY A Y A Y A Y A YY A YY= + + + + + + +… (4)
This ploynominal equation is necessary for the pur
-pose of modeling because the encoding method
en-ables execution of the same. In this research, for mod
-eling of the gas selectivity and permeability in the
PMP-modified membranes a general function with optimization design was used, since the independent variables are identified as:
Y1= type of polymer,
Y2= percentage of polymer
Y3= type of nanoparticle
Y4 = percentage of nanoparticle
Interactions and combinations of the domain variables
are some of the important advantages of experimental
design method in comparison to the classic
statisti-cal approach. In addition, components selectivity of CO2/CH4 S(CO2/CH4), N2/CH4 S(O2/N2), O2/N2 S(O2/N2), and
CO2/N2 S(CO2/N2) and components permeability of O2 (PO2), CH4 (PCH4), CO2 (PCO2), and N2 (PN2) were taken as the responses of the function. Table 2 shows four
important variables that applied in this analysis with their levels and relevant types and also the variables of
PMP polymer and nanoparticle type in dimensionless form (constant and definite). Also, standard analysis
has been done for analyzing the model and curve pro
-duction. The most appropriate polynominal model has been selected with significant amounts (p<0.05), with
appointed multiple correlation coefficient (appointed
R2).
RESULTS AND DISCUSSION
To evaluate polymer modification with nanoparticles, design expert software is used and the results of the
model, as well as permeability, selectivity and then
optimization of operational conditions, are discussed.
Permeability results for different gasses
The permeability models for different gasses using de
-sign expert software are as following:
a) Permeability models for TiO2 nanoparticles as a
function of nanoparticle percentage and gas pressure.
P X X P X X P P X × × − × − × − + × × − − − = − − 4 2 4 2 3 4 3 4 O 016 . 0 1 0 . 0 0 1 3 8 . 7 018 . 0 0 1 2 3 . 5 013 . 0 1 9 . 1 1 4 . 6 P 3 2 P X X P X X P X × − × − − − × − + = − 4 2 4 3 2 4 4 4 N 1 9 . 2 0 1 2 5 . 1 3 . 0 4 2 . 1 7 0 . 1 7 2 . 9 1 5 5 . 106 P 2 P X X P X P P X × − − − × × − + − = 4 2 4 2 4 4 O C 3 8 . 1 7 8 0 . 0 093 . 0 6 0 . 1 8 . 0 4 . 112 9 3 . 127 P 2 4 2 2 4 4 3 4 4 H C 1 1 . 0 6 3 . 0 1 . 0 0 1 7 5 . 4 4 . 0 3 1 . 0 3 . 8 2 8 . 9 2 P 4 X P P X X X P X × − + − × × − − + − = −
b) Permeability models for Al2O3 nanoparticles as a
function of nanoparticle percentage and gas pressure.
P X X P X X P P X × × − − × × − + × × × − + + = − − 4 2 4 2 3 4 3 4 O 016 . 0 1 0 . 0 0 1 3 8 . 7 018 . 0 0 1 2 3 . 5 013 . 0 8 0 . 1 604 P 3 2 P X X P X X P P X N × × − × × − − − × × × − + = − 4 2 4 3 2 4 4 4 1 9 . 2 0 1 2 5 . 1 3 . 0 4 2 . 1 019 . 3 7 0 . 1 8 3 . 1 3 5 5 . 106 P 2 P X X P X X P P X O C × × − × − × − − × × − + − = 4 2 4 2 4 4 4 3 8 . 1 7 8. 0 093 . 0 77 . 2 6 0 . 1 8 . 0 5 3 . 5 6 9 3 . 127 P 2 P X P X X X P X H C × × − + × − × × × − × − × + − = − 4 2 2 4 4 3 4 4 1 1 . 0 6 3 . 0 1 . 0 0 1 7 5 . 4 4 . 0 3 1 . 0 1 2 . 0 2 8 . 9 2 P 4
c) Permeability models for ZnO nanoparticles as a function of nanoparticle percentage and gas pressure.
P X X P X X P P X O × − − × − + × × − + + = − − 4 4 2 3 4 3 4 016 . 0 1 0 . 0 0 1 3 8 . 7 018 . 0 0 1 1 2 3 . 3 013 . 0 3 9 . 1 4 . 6 P 3 2 P X X P X X P P X N × × − × × − − − × − − + = − 4 2 4 3 2 4 4 4 1 9 . 2 0 1 2 5 . 1 3 . 0 4 2 . 1 9 1 . 3 7 0 . 1 5 0 . 4 2 5 5 . 106 P 2 P X X P X X P P X O C × − − − − × − + − = 4 2 4 2 4 4 4 3 8 . 1 7 8. 0 093 . 0 77 . 2 6 0 . 1 8 . 0 7 2 . 1 5 9 3 . 127 P 2 P X P X X P X P X H C × − + − × × − − + − = − 4 2 2 4 4 3 4 4 1 1 . 0 6 3 . 0 1 . 0 0 1 7 5 . 4 4 . 0 3 1 . 0 5 1 . 0 2 8 . 9 2 P 4
Table 3 shows the model data of different conditions
and response of the gases to the different amounts of
variables; the permeability of the pure gases show
that with increasing the volume fraction of added
nanoparticles, gases permeability increases. How
-ever, gas permeability is depended on the amount of nanoparticles, because some effective parameters of
the gases such as solubility and molecular size are dif
-ferent from each other. In such a way, the permeability
of the gas molecules with smaller kinetics diameter has been greater than that of the larger molecules, be-cause the permeability is the dominant parameter in
the polymeric membranes and synthetic network. It
can be seen that the addition of nanoparticles to the membrane has increased the gas permeability since it is known as an effective factor in the improvement of
membrane permeability.
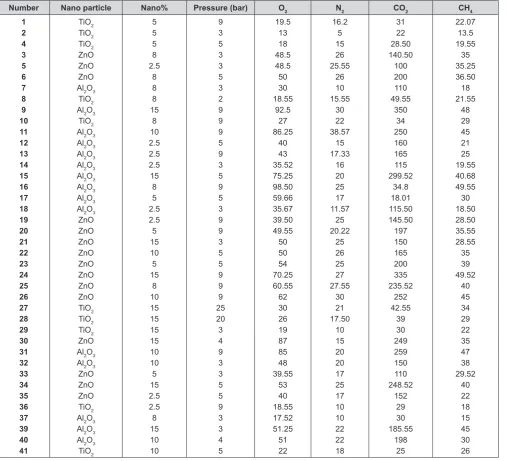
As the table shows, maximum values of permeabil
-ity for O2, N2, CO2 and CH4 are equal to 92.5, 30, 350
and 48 barrer, respectively, in PMP membrane modi
-fied with 15 % of Al2O3 at the pressure of 9 bar. Fig -ures 1 and 2 show combined effects of the percentage
of nanoparticle and pressure on CO2 and O2
perme-ability.
As shown in these figures, by increasing the pres
-sure and percentage of nanoparticles, permeability
is increased in the PMP membrane. Moreover, the
Table 2. Variables types and their levels of factorial experi-ments design matrix.
Variable Level
Type Actual Coded
Type of polymer X1 PMP { 1 }
Percentage of polymer X2 3% { 1 }
Type of nanoparticle X3
TiO2 AL2O3
ZnO
{ 0 } { 1 }
{- 1 }
Percentage of nanoparticle X4
nanoparticles in contrast to the pressure also show
higher values. This means that at constant pressure, in
-creasing the nanoparticle content can increase the gas
permeability. If the percentage of specific nanoparticle
increases, with the increase of gas permeability, the
pressure in the PMP membrane also shows a relative increase.
Figure 3 illustrates the combined effects of
percent-age of the nanoparticle and precursor on CO2/CH4 selectivity with the average material (actual factor).
As shown in Figure 3, by increasing the pressure and
nanoparticle content, selectivity increases in the PMP membrane. Similar to permeability in selectivity,
nanoparticles in contrast to the pressure shows higher
values as well. This means that at constant pressure,
increasing of the nanoparticle content causes to
in-crease the value of gas selectivity. If the percentage of specific nanoparticle increases with the increase of gas selectivity, the pressure in the PMP membrane again
shows a relative increase. The results of both perme
-ation and selectivity of PMP/nanoparticle show that
addition of nanoparticle can enhance gas permeability
and selectivity for PMP.
Figures 4 to 7 illustrate an adaption between the
data obtained from the experimental data and gas per
-meation models for different gases (O2, N2, CO2 and
Table 3. Membrane permeability and gas separation under different conditions.
Number Nano particle Nano% Pressure (bar) O2 N2 CO2 CH4
1 2 4 3 5 6 7 8 9 10 11 12 13 14 15 16 17 18 19 20 21 22 23 24 25 26 27 28 29 30 31 32 33 34 35 36 37 39 40 41
TiO2 TiO2 TiO2 ZnO ZnO ZnO Al2O3 TiO2 Al2O3 TiO2 Al2O3 Al2O3 Al2O3 Al2O3 Al2O3 Al2O3 Al2O3 Al2O3 ZnO ZnO ZnO ZnO ZnO ZnO ZnO ZnO TiO2 TiO2 TiO2 ZnO Al2O3 Al2O3 ZnO ZnO ZnO TiO2 Al2O3 Al2O3 Al2O3 TiO2
5 5 5 8 2.5
8 8 8 15 8 10 2.5 2.5 2.5 15
8 5 2.5 2.5 5 15 10 5 15 8 10 15 15 15 15 10 10 5 15 2.5 2.5 8 15 10 10
9 3 5 3 3 5 3 2 9 9 9 5 9 3 5 9 5 3 9 9 3 5 5 9 9 9 25 20 3 4 9 3 3 5 5 9 3 3 4 5
19.5 13 18 48.5 48.5 50 30 18.55
92.5 27 86.25
40 43 35.52 75.25 98.50 59.66 35.67 39.50 49.55 50 50 54 70.25 60.55 62 30 26 19 87 85 48 39.55
53 40 18.55 17.52 51.25 51 22
16.2 5 15 26 25.55
26 10 15.55
30 22 38.57
15 17.33
16 20 25 17 11.57
25 20.22
25 26 25 27 27.55
30 21 17.50
10 15 20 20 17 25 17 10 10 22 22 18
31 22 28.50 140.50
100 200 110 49.55
350 34 250 160 165 115 299.52
34.8 18.01 115.50 145.50 197 150 165 200 335 235.52
252 42.55
39 30 249 259 150 110 248.52
152 29 30 185.55
198 25
22.07 13.5 19.55
35 35.25 36.50 18 21.55
48 29 45 21 25 19.55 40.68 49.55 30 18.50 28.50 35.55 28.55 35 39 49.52
40 45 34 29 22 35 47 38 29.52
CH4), and a good agreement between the models and experimental data can be seen. These figures show a
good conformity between the data obtained from the
experimental amounts and those estimated from the
gas transport models for both permeability and
selec-tivity of gasses in the optimized condition.
Figure 1. Effects of combined pressure and nanoparticle percentage on CO2 permeability (a) surface plot and (b) contour plot.
Figure 2. Effects of combined pressure and nanoparticle percentage on O2 permeability; (a) surface plot and (b) contour plot.
Figure 3. The combined effects of percentage of nanoparticle and precursor on CO2/CH4 selectivity with average material (actual
Selectivity results for different gases
The selectivity models for different gases using design expert software are as following:
a) Selectivity models for TiO2 nanoparticles as a
func-tion of nanoparticle percentage and gas pressure.
4 2 2 4 3 2 4 4 00621 . 0 0 1 9 3 . 3 4 0 . 0 8 8 0 . 0 8 4 0 . 0 1 4 . 0 8 . 8 1 S 2 2 X P X P X P X P N O × − × − + × + − − = − 4 2 2 4 2 4 4 6 0 . 0 1 1 0 . 0 2 0 0 . 0 5 9 . 0 9 1 . 2 1 6 . 3 7 9 . 4 3 S 2 2 X P X P X P X P N O C × − − + × + − + = 4 2 2 4 2 4 4 3 0 0 . 0 2 3 . 0 8 8 0 0 . 0 5 1 . 1 4 5 . 3 2 1 . 0 3 6 . 8 4 S 4 2 X P X P X P X P H C O C × − − + × + − − =
b) Selectivity models for Al2O3 +nanoparticles as a
function of nanoparticle percentage and gas pressure.
4 2 2 4 2 4 4 2 6 0 0 . 0 9 3 0 0 . 0 6 2 0 0 . 0 8 8 0 . 0 8 4 0 . 0 6 4 0 . 0 7 . 6 S 2 2 X P X P X P X P N O × − − + × + − − = 4 2 2 4 2 4 4 6 0 . 0 1 1 0 . 0 0 2 0 0 . 0 8 5 9 . 0 9 1 0 2 1 1 . 0 7 3 . 3 2 S 2 2 X P X P X P X P N O C × − − + × + − + = 4 2 2 4 2 4 4 6 0 . 0 1 1 0 . 0 1 8 8 0 0 . 0 5 1 . 2 4 5 . 3 1 3 . 0 4 6 . 4 3 S 4 2 X P X P X P X P H C O C × − − + × + − − =
c) Selectivity models for ZnO nanoparticles as a func
-tion of nanoparticle percentage and gas pressure.
4 2 2 4 2 4 4 3 0 0 . 0 2 3 . 0 8 8 0 0 . 0 5 1 . 2 4 5 . 3 2 1 . 0 2 0 . 1 2 S 4 2 X P X P X P X P H CO C × − − + × + − − =
Figure 4. Comparison between observed and estimated
re-sponses for O2.
Figure 5. Comparison between observed and estimated
re-sponses for N2.
Figure 6. Comparison between observed and estimated
re-sponses for CO2.
Figure 7. Comparison between observed and estimated
Table 4. Effect of the different variables (percentage and type of nanoparticles, pressure) on gas selectivity of the modified PMP
membrane.
Number Pressure Nano Nano T
ype CO2/N 2 CO2/CH 4 O 2/N 2
Number Pressure Nano Nano T
ype CO2/N 2 CO2/CH 4 O 2/N 2
(bar) (%wt) (-) (-) (-) (bar) (%wt) (-) (-) (-)
1 2 3 4 5 6 7 8 9 10 11 12 13 14 15 16 17 18 19 20 21 22 23 24 25 26 27 28 29 30 31 32 33 34 3 4 5 7 8 9 3 3 3 3 3 3 3 4 4 4 4 4 4 5 5 5 5 10 5 5 5 5 5 5 5 7 7 7 10 10 10 10 10 10 0 2.5 5 8 8 10 15 0 2.5 5 8 10 15 0 20 5 30 5 15 0 2.5 5 8 10 15 5 20 5 TiO2 TiO2 TiO2 TiO2 TiO2 TiO2 ZnO ZnO ZnO ZnO ZnO ZnO ZnO ZnO ZnO ZnO ZnO ZnO ZnO Al2O3 Al2O3 Al2O3 Al2O3 Al2O3 Al2O3 ZnO ZnO ZnO ZnO ZnO ZnO Al2O3 Al2O3 Al2O3
46.7 50 67.7 77.7 79.95 80.2 24.9 24.93 24.97 24.97 25.55 25.52 27.3 24.4 25.2 25 28.2 29.2 30.2 24.2 40 27.2 45 30 36 24.98 25.2 25 29.92 31.2 34.95 25.4 48 28.2 16.83 17.12 21.26 22.21 23 33.98 8.5 8.88 8.95 9.8 8.4 9.2 10.3 9.5 9.3 9 9.4 10 11.1 9.2 12 9.85 10.2 10.2 12.3 8.95 9.4 9.95 10.2 9.8 11.2 10.3 12 10.3 19.2 19.53 19.96 20 20.2 20.6 6.75 6.2 7.2 6.9 6.98 8.2 9.2 7.3 7.4 7.9 8.5 8.85 9.2 7.2 10.2 7.5 10.2 8.5 9.5 7.2 7.3 7.5 8.2 7.98 9.56 7.5 10.2 8.2 35 36 37 38 39 40 41 42 43 44 45 46 47 48 49 50 51 52 53 54 55 56 57 58 59 60 61 62 63 64 65 66 67 7 7 7 7 7 7 7 7 7 3 9 9 9 9 9 9 9 9 9 9 9 10 10 10 10 10 10 10 10 10 10 10 10 30 10 15 0 2.5 5 8 10 15 0 20 5 30 10 15 0 2.5 5 8 10 15 0 20 5 30 10 15 0 2.5 5 8 10 15
Al2O3 Al2O3 Al2O3 ZnO ZnO ZnO ZnO ZnO ZnO Al2O3 Al2O3 Al2O3 Al2O3 Al2O3 Al2O3 ZnO ZnO ZnO ZnO ZnO ZnO Al2O3 Al2O3 Al2O3 Al2O3 Al2O3 Al2O3 ZnO ZnO ZnO ZnO ZnO ZnO 57 36 45 25 26 26.75 33.92 34.95 39.2 25.2 50 29 57 35 44.2 24.98 27.2 26.2 31 36 40 24.59 45 29.7 54.2 33.55 41.2 24.2 26.2 27.2 31 35 39.98 15 10.2 15 9.2 10 9.2 10.2 11.2 12.56 10 12.3 9.2 15 12.3 14 9.50 9.92 9.9 10.95 11.95 11 8.5 12.3 8.7 12.5 9.88 12.2 9.95 8.2 9.2 10.2 11 11.2 12 8.5 9.85 7.2 8.85 7.2 7.98 8.95 9.97 7.2 9.85 7.7 10.2 8.99 9.2 7.3 77 7.8 8.95 8.2 9.2 6.3 10.2 6.9 10.3 6.8 9.8 7.82 8.4 8.3 8.4 8.9 9.9
Figure 8.Comparison between observed and estimated
re-sponses for O2/N2 selectivity.
Figure 9.Comparison between observed and estimated
4 2 2
4
2 4
4
2
6 00 . 0 9
3 3
0 0 . 0
4
6 0 . 0 8
8 0 . 0 8
4
0 . 0 5
3
9 . 0
2
.
4
S
2 2
X P X
P X
P X
P N
O
× −
− −
× +
− +
=
4 2 2
4
2 4
4
6 0 . 0
1 1
0 . 0
2
0
2
0 0 . 0 5
9 . 0 9
1
.
2 1 3
. 0
2
6 . 5
2
S
2 2
X P X
P X
P X
P
N O C
× −
− +
× + −
− =
Table 4 shows the model data and response of the dif
-ferent gas selectivity to the dif-ferent amounts of
vari-ables (pressure and type and content of nanoparticle).
It can be seen that the addition of the nanoparticles to the membrane has increased the gas selectivity since it is known as an effective factor in the improvement of
the membrane selectivity. As the table shows, in PMP
membrane modified by 10% TiO2 at the pressure of
9 bar, the maximum values of selectivity for CO2/N2,
CO2/CH4 and O2/N2 are 80.2, 23.98 and 20.6 barrer, respectively.
Figures 8, 9 and 10 illustrate a fine conformity be
-tween the data obtained from the experimental values
and those estimated from the gas selectivity models
for O2/N2, CO2/N2 and CO2/CH4 selectivity,
respec-tively. It can be seen that between the models and ex
-perimental data is a good agreement.
CONCLUSIONS
In this study, the effects of incorporation of selected
nanoparticles such as TiO2, Al2O3 and ZnO on the ef
-ficiency of PMP membranes were investigated. To
this purpose, different variables such as operating gas pressure, type and concentration of nanoparticle were
applied as the main controller parameters to evaluate
the gas transportation properties throughout PMP. Ex
-perimental design, modeling and improvement of the
gas separation procedure have been fulfilled. Design
expert software was used and prevailing data on mem
-brane modeling and the results were categorized ac
-cording to process variables such as permeability, se-lectivity, composition of nanoparticle percentage and
gas pressure. In PMP membrane modified by 15 wt%
Al2O3 at the pressure of 9 bar, maximum values of per
-meability for O2, N2, CO2 and CH4 were equal to 92.5, 30, 350 and 48 barrer, respectively. TiO2 nanoparticles were found to be the best nanoparticle in selectivity, so
that maximum values of selectivity for CO2/N2, CO2/
CH4 and O2/N2 were, respectively, equal to 80.2, 23.98
and 20.6 in PMP membrane modified by 10 wt% TiO2
at the pressure of 9 bar.
REFERENCES
1. Zeinali S, Aryaeinezhad M (2015) Precipitation in a micromixer from laboratory to industrial scale. Chem Eng Technol 38: 2079-2086 2. Barquı´n AF, Coterillo CC, Palomino M, Valencia
S, Irabien A (2015) Current status and future prospect of polymer-layered silicate
mixed-matrix membranes for CO2/CH4 separation.
Chem Eng Technol 38: 658-666
3. Heydari S, Pirouzfar V (2016) The influence of
synthesis parameters on the gas selectivity and
permeability of carbon membranes: Empirical modeling and process optimization using surface methodology. RSC Adv 6: 14149-14163 4. Soleymanipour SF, Saeedi Dehaghani AH,
Pirouzfar V, Alihossein A(2016) The morphology
and gas-separation performance of membranes comprising multiwalled carbon nanotubes/
polysulfone-Kapton. J Appl Polym Sci 133: 4389-4397
5. Nematollahi MH, Saeedi Dehaghani AH, Abeini
R (2016) CO2/CH4 separation with(
poly4-methyl-1-pentyne) (TPX) based mixed matrix
membrane filled with Al2O3 nanoparticles.
Korean J Chem Eng 33: 657-665
6. Abedini R, Mousavi SM, Aminzadeh R (2012)
Figure 10.Comparison between observed and estimated
Effect of nonchemical synthesized TiO2
nanoparticles and coagulation bath temperature on morphology, thermal stabilty and pure
water flux of asymmetric cellulose acetate
nanocomposite membranes prepared via phase
inversion method. Chem Ind Chem Eng Q 18: 385
7. Semsarzadeh MA, Ghalei B, Fardi M, Esmaeeli M, Vakili E (2014) The influence of nanoparticles on gas transport properties of mixed matrix membranes: An experimental investigation and modeling. Korean J Chem Eng 31: 841
8. Soleymanipour SF, Saeedi Dehaghani
AH, Pirouzfar V, Alihosseini A(2016) The
morphology and gas-separation performance of membranes comprising multiwalled carbon
nanotubes/polysulfone–Kapton. J Appl Polym Sci 133: 48839-43847
9. Alihosseini A, Dadfar E, Aibod S (2015) Synthesis and characterization of novel poly (Amide-imide) nanocomposite/silicate paricles based on N-pyromellitimido-L-phenyl alanine containing sulfone moieties. J Appl Chem Sci Int 3: 84-92
10. Rahmanian B, Pakizeh M, Mansoori SAA, Abedini R (2011) Application of experimental design approach and artificial neural network (ANN) for the determination of potential micellar-enhanced ultrafiltration process. J Hazard Mater 187: 67-74
11. Hassanajili S, Masoudi E, Karimi G, Khademi MA (2013) Mixed matrix membranes based
on polyetherurethane and polyesterurethane containing silica nanoparticles for separation of
CO2/CH4 gases. Sep Purif Technol 116: 1–12 12. He Z, Pinnau I, Morisato A (2002) Nanostructured
(poly4-methyl-2-pentyne)/silica hybrid membranes for gas separation. Desalination 146: 11-15
13. Abedini R, Omidkhah M, Dorosti F (2014) Highly permeable (poly 4-methyl-1-pentyne)/ NH2-MIL 53 (Al) mixed matrix membrane for CO2/CH4 separation. Int J Hydrogen Energy 4: 36522-36537
14. Abedini R, Omidkhah M, Dorosti F (2015)
Enhanced CO2/CH4 separation properties
of asymmetric mixed matrix membrane by
incorporating nano-porous ZSM-5 and MIL-53 particles into Matrimid® 5218. J Natur Gas Sci Eng 25: 88-102
15. Morisato H, Pinnau I (1996) Synthesis and gas permeation properties of (poly4-methyl-2-pentyne). J Membr Sci 121: 243-250
16. Moghadam F, Omidkhah MR, Vasheghani-Farahani E, Pedram MZ (2011) The effect of TiO2 nanoparticles on gas transport properties of
Matrimid5218-based mixed matrix membranes, Separ Purif Technol 77: 128-136
17. Matteucci S, Kusuma VA, Swinnea S, Freeman BD (2008) Gas transport properties of MgO filled (poly1-trimethylsilyl-1-propyne) nano composites. Polymer Nanocomposites 49: 1659-1675
18. Momeni SM, Pakizeh M (2013) Preparation, characterization and gas permeation study of PSf/MgO nanocomposite membrane. Brazilian J Chem Eng 30: 589-597
19. Ahn J, Chung WJ, Pinnau I, Guiver MD (2008) Polysulfone/silica nanoparticle mixed-matrix membranes for gas separation. J Membrane Sci 314: 123-133
20. Zhao J, Wang Z, Wang J, Wang S (2012) A high performance antioxidative and acid resistant membrane prepared by interfacial polymerization
for CO2 separation from flue gas. J Membr Sci
403-404: 203-215
21. Askari M, Chung T-S (2013) Natural gas purification and olefin/paraffin separation using thermal cross-linkable co-polyimide/ZIF-8 mixed matrix membranes. J Membr Sci 444: 173 183
22. Li Y, Wang S, He G, Wu H, Pan F, Jiang Z (2015)
Facilitated transport of small molecules and ions
for energy-efficient membranes. Chem Soc Rev 44: 103-118
23. Abedini R, Omidkhah.MR, Dorosti F (2014) CO2/
CH4 separation by a mixed matrix membrane of
polymethylpentyne/MIL-53 particles, Iranian J Polym Sci Technol 27: 337-351
24. Zhongde D, Lu B, Karoline NH, Xiangping Z, Suojiang Z, Liyuan D (2014) Pebax®/TSIL
blend thin film composite membranes for CO2
25. Rodenas T, van Dalen M, Serra-Crespo P, Kapteijn F, Gascon (2014) Influence of filler pore
structure and polymer on the performance of
MOF-based mixed-matrix membranes for CO2
capture. J Micropor Mesopor Mater192: 35-42 26. Ge L, Zhou W, Rudolph V, Zhu Z (2013) Mixed matrix membranes incorporated with size-reduced Cu-BTC for improved gas separation. J Mater Chem A 1: 6350-6358
27. Wong KC, Goh PS, Ismail AF (2016) Thin film nanocomposite: the next generation selective
membrane for CO2 removal. J Mater Chem A 41:
130-139
28. Hwang S, Chi WS, Lee SJ, Im SH, Kim JH, Kim (2015) Hollow ZIF-8 nanoparticles improve the permeability of mixed matrix membranes for
CO2/CH4 gas separation. J Membr Sci: 480,
11-19
29. Kılıç A, Atalay-Oral Ç, Sirkecioğlu A, Tantekin-Ersolmaz ŞB, Ahunbay MG (2015) Sod-ZMOF/
Matrimid® mixed matrix membranes for CO2
separation J Membr Sci 489:81-89
30. Nikolaeva D, Azcune I, Sheridan E, Sandru M, Genua A, Tanczyk M, Jaschik M, Warmuzinski K, Jansen JC, Vankelecom I F J (2017) Poly(vinylbenzyl chloride)-based poly(ionic
liquids) as membranes for CO2 capture from flue
gas 37: 121-129
31. Wang S, Tian Z, Feng J, Wu H, Li Y, Liu Y, Li X,
Xin Q, Jiang Z (2015) Enhanced CO2 separation
properties by incorporating poly (ethylene glycol)-containing polymeric sub microspheres into polyimide membrane. J Membr Sci 473: 310-317
32. Li X, Jiang Z, Wu Y, Zhang H, Cheng Y, Guo R, Wu H (2015) High-performance composite membranes incorporated with carboxylic acid
nanogels for CO2 separation. J Membr Sci 495:
72-80
33. Li X, Wang M, Wang S, Li Y, Jiang Z, Guo R, Wu
H, Cao X, Yang J, Wang B (2015) Efficient CO2
capture by functionalized graphene oxide Nano sheets as fillers to fabricate multi-perm selective mixed matrix membranes ACS applied materials & interfaces 7: 5528-5537
34. Shen J, Liu G, Huang K, Li Q, Guan K, Li Y, Jin
W (2016) UiO-66-polyether block amide mixed
matrix membranes for CO2 separation. J Membr
Sci 513: 155-165
35. Mitra T, Bhavsar RS, Adams DJ, Budd PM, Cooper AI (2016) PIM-1 mixed matrix
membranes for gas separations using
cost-effective hypercrosslinked nanoparticle fillers. Chemi Commun 52: 5581-5584
36. Dong L, Chen M, Li J, Shi D, Dong W, Li X, Bai Y(2016) Metal-organic framework-graphene oxide composites: A facile method to highly
improve the CO2 separation performance of
mixed matrix membranes. J Membr Sci 520: 801-811
37. Tien-Binh N, Vinh-Thang H, Chen, XY, Rodrigue D, Kaliaguine S (2016) Metal organic framework based mixed matrix membranes: an overview on filler/polymer interfaces. J Membr Sci 520: 941- 950
38. Gholami M, Mohammadi T, Mosleh S, Hemmati
M (2017) CO2/CH4 separation using mixed matrix
membrane-based polyurethane incorporated