Measuring the Knowledge Economy:
A National and Organizational Perspective
Ramona – Diana LEON
National University of Political Studies and Administration 30A Expozitiei Blvd., Sector 1, 012104, Bucharest, Romania
Abstract. This article aims to analyze how the knowledge economy is measured and how different are the tools developed for this purpose. Since the research focuses on the “how” issues, a qualitative approach is employed. The analysis concentrates on three of the most frequently used tools for measuring a country’s progress towards consolidating itself as a knowledge economy, namely: Knowledge Assessment Methodology, developed by World Bank, Lisbon Scorecard, elaborated by World Economic Forum, and Innovation Union Scoreboard, created by the European Union. Nevertheless, Kensho New Economies Composite Index – the newest instrument developed by Kensho Technologies – is brought forward. The results prove that the three most frequently used tools for measuring countries’ progress towards consolidating themselves as knowledge economies have the same information capability while the newest tool emphasizes what is usually labelled as “intellectual capital”, although it uses the phrase “Knowledge Economy”. On the one hand, these results shed light on policy-makers’ psychological need of measuring the intangible assets, and transforming the intangible into tangible. On the other hand, they highlight the need for redefining the concept of “knowledge economy” and establishing its pillars.
Keywords: education, innovation, knowledge economy, Lisbon Scorecard, Knowledge Assessment Methodology, Romania, European Union.
Introduction
For the last five decades, many researchers and practitioners (Dang & Umemoto, 2009; Drucker, 1993; Lilleoere & Hansen, 2011; Nonaka & Takeuchi, 1995; Suh & Chen, 2007; Zanini & Musante, 2013) concentrated on emphasizing the switch from an industrial economy to a knowledge based one. This transition was supposed to bring forward the importance that knowledge has as a production factor and also the need for being successful in a highly competitive and globalized environment by providing highly value-added goods and/or services. It may be assumed that this target was achieved since concepts like knowledge management, knowledge based organizations, knowledge intensive firms, knowledge economy, and
228 | Ramona – Diana LEON
Measuring the Knowledge Economy: A National and Organizational Perspective
environment in order to highlight the fact that knowledge is a critical organizational and national resource. However, there is still a lot of work to do in this area, due to human’s psychological need for being certain and capable of putting a label / value on everything; this practically fosters the development of various measurement scales, tools, and models.
At the organizational level, several models are developed for measuring firm’s intellectual capital; as Lerro and Schiuma (2013) state some are based on a scorecard-based architecture (Bueno, 2011; Cricelli, Greco & Grimaldi, 2014; Leon, 2016) while others have an index-based architecture (Pulic, 2000; Stewart, 1997). At the national level, the focus is either on evaluating the national intellectual capital (Käpylä, Kujansivu & Lönnqvist, 2012; Labra & Sánchez, 2013; Macerinskiene, Macerinskas & Aleknaviciute, 2016) or the progress made by a country in order to develop itself as a knowledge economy (European Union, 2011, 2016; World Bank, 2012; World Economic Forum, 2010). The latter constitutes a subject of interest for the current article since knowledge economy is the one that uses knowledge as the key engine of economic growth (Suh & Chen, 2007) and its effects are disseminated inside and outside the national boundaries. Besides, although the concept of knowledge economy was coined in the early 1960s by Machlup (1962) and various scholars have analyzed it since (Donlagic, Fazlic & Nuhanovic, 2015; Kowalska, 2016; Shiryaev et al., 2016; Suh & Chen, 2007), there is still no general accepted framework and theory about it and some scholars are keep describing it as a buzzword or theoretical myth (May, 2002; Smith, 2002).
International tools for measuring knowledge economy
Knowledge Assessment Methodology
In 1999, World Bank developed the Knowledge Assessment Methodology (KAM) as part of the Knowledge for Development Program; this aims to facilitate countries transition to consolidating themselves as knowledge economies. Therefore, KAM is designed as “a user-friendly interactive diagnostic and benchmarking tool that is designed to help client countries understand their strengths and weaknesses by comparing themselves with neighbors, competitors, or other countries that they may wish to emulate based on the four knowledge economy pillars” (Chen & Dahlman, 2006, p.9). In other words, it adopts a holistic approach and it brings forward several national competitive advantages. Nevertheless, it facilitates the identification of those threats and opportunities with which a country may be confronted.
230 | Ramona – Diana LEON
Measuring the Knowledge Economy: A National and Organizational Perspective
(1) ( ) (
Nw represents the number of countries that rank lower or below u; )
where: u – the analyzed index;
Data are collected from international databases and normalized on a scale from 0 to 10, based on the following equation (Chen & Dahlman, 2006):
scale of 0 to 10), it can be argued that the EU member states are moving, in
The fact that the European market is highly interconnected, it actually fosters the sustainable development of the new members, candidate countries and developing economies. The leaders serve as a role model for the new comers and they also encourage their followers to continuously increase their efforts into developing each of the four knowledge economy pillars.
Nc signifies the total number of countries.
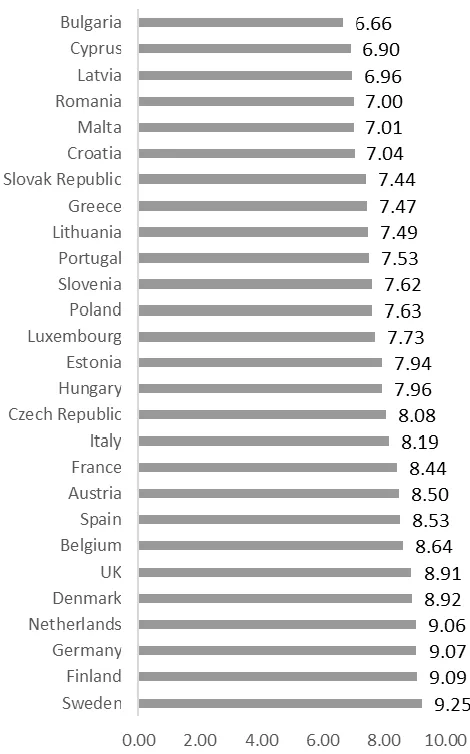
After the normalization procedure, the Knowledge Economy Index is determined as the arithmetic average of the scores obtained at each of the four pillars. The latest results (Figure 1) prove that Sweden, Finland, Germany, and Netherlands are the best performers in terms of consolidating themselves as knowledge economies; the worst performers are represented by Romania, Latvia, Cyprus and Bulgaria. Given the small gap that exists between the best and the worst performer (2.59 points on a
Figure 1. The results obtained by the European Union member states, in 2012, according to the Knowledge Assessment Methodology (World Bank, 2012)
232 | Ramona – Diana LEON
Measuring the Knowledge Economy: A National and Organizational Perspective
Middle East and North Africa (Malouche, Plaza & Salsac, 2016; Rubalcaba, Gago, Ariano & Tripathi, 2016; Tan, Lee, Flynn, Roseth & Nam, 2016).
Lisbon Scorecard
The Lisbon Scorecard is used for the first time in 2004, in a report elaborated by the World Economic Forum, and it analyses eight dimensions which are considered to be crucial for the knowledge based economy. These include: (i) information society; (ii) research, development and innovation; (iii) liberalization; (iv) network industries; (v) financial services; (vi) enterprise environment; (vii) social inclusion; and (viii) sustainable development.
The first dimension – Information society – “measures the extent to which an economy has harnessed information and communication technologies (ICT) for sharing knowledge and enhancing the productivity of its industries” (World Economic Forum, 2010, p.4). It is assumed that that the companies which manage to integrate new technologies into their organizational processes may increase their productivity since they are capable of processing data more efficiently than their competitors, they have a better access to information, and they disseminate their knowledge faster. Furthermore, this assumption proved to be a certainty once the sharing economy started to develop and the successful business models started to be based on ICTs (Habibi, Davidson & Laroche, 2017; Lombardi & Schwabe, 2017).
The second dimension – Research, development and innovation (RDI) – uses “measures such as business investment in research and development, the quality of scientific research institutions, the extent of collaboration in research between universities and industry, patenting per capita, and the protection of intellectual property and innovation stimulation through government procurement” (World Economic Forum, 2010, p.4). Each and every one of these influences the innovation capacity and the economic competitiveness (Leon & Nica, 2011). It basically fosters knowledge creation, dissemination and use at individual, organizational and national level.
incorporated in their products and/or services to a large group of individuals and organizations.
The fourth dimension – Network industries – focuses on evaluating the “actions aimed at liberalizing and building network industries” (World Economic Forum, 2010, p.5). It concentrates on two areas: telecommunications, on the one hand, and utilities and transportation, on the other hand. First of all, these are supposed to provide the needed infrastructure for international communication and collaboration, and for knowledge codification, retrieval and sharing. Second of all, they challenge the current status quo by bringing forward new business models which are more flexible, more interconnected, and more efficient in a globalized market.
The fifth dimension – Financial services – measures the efficiency of the European financial sector based on its capacity to make “capital available for business investment from such sources as credit from a sound banking sector, well-regulated securities exchanges or venture capital” (World Economic Forum, 2010, p.5). It sheds light on the tangible aspects that an individual, organization and nation has to acquire in order to facilitate the development of all the other dimensions. In other words, in order to develop the appropriate infrastructure and to have access to a globalized market, each economic agent has to be capable of accessing the needed capital. Therefore, the financial services must be properly regulated and available.
The sixth dimension – Enterprise environment – underlines the quality of the business environment by emphasizing its ability to “stimulate entrepreneurship by reducing the administrative impediments to doing business in the EU and reducing distortionary or burdensome taxes” (World Economic Forum, 2010, p.5). At this level, the processes of knowledge use are encouraged and supported.
The seventh dimension – Social inclusion – brings forward the fact that “modernizing social protection and dealing directly with issues of social exclusion and poverty are critical to increasing social inclusion” (World Economic Forum, 2010, p.6). Therefore, the implications that knowledge creation, dissemination and use have outside the economic framework are taken into account. The focus is no longer on the economic agents but on the well-being of each individual.
234 | Ramona – Diana LEON
Measuring the Knowledge Economy: A National and Organizational Perspective
life for the present generation proceed steadily and do not come at the expense of future generations” (World Economic Forum, 2010, p.6). It focuses on four areas of interest, namely: climate change, transport, public health and natural resources, and it analyses the environmental legislation, treaties and quality. It is in line with the aforementioned dimension, only this time the perspective changes from the short term to the long term approach.
Thus, it combines various perspectives and it uses both primary and secondary data; in other words, it puts together data collected through survey with statistical data. Due to the fact that they are using different scales of measurement, they are normalized on a scale of 1 to 7, based on a utility function.
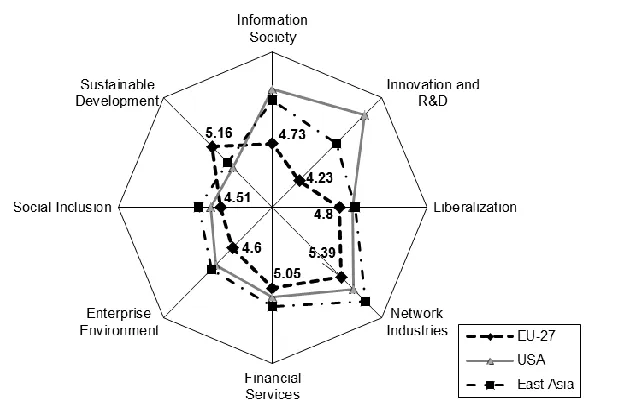
On general level, Lisbon Scorecard is used for comparing the progresses made by the European Union member states towards developing themselves as knowledge economies. Therefore, it serves as a benchmarking tool inside and outside the European Union boundaries. On the one hand, each European Union member state has the possibility to compare its progresses with the ones registered by other members. On the other hand, the European Union member states performance can also be compared with the one registered by USA and the five more competitive economies from East Asia, namely Japan, Hong Kong, Korea, Taiwan, and Singapore.
Figure 2. The results obtained by Romania during 2006 – 2010, according to the Lisbon Scorecard (World Economic Forum, 2010)
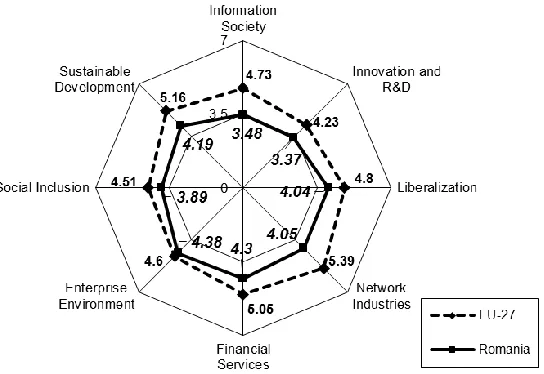
However, as it can be noticed from Figure 3, until 2010, Romania has followed the same pattern as the EU-27 average. In other words, it went with the European flow in developing itself as a knowledge economy; the strategies and policies adopted at the European level were taken into consideration and fostered the national progresses. Still, two elements have to be mentioned, namely: (i) the highest gap appears at the “Network Industries” level (1.34 points on a scale of 0 to 6), and (ii) the smallest one characterizes the “Enterprise Environment” dimension (0.22
points on a scale of 0 to 6).
The former practically concentrates on infrastructure and it highlights the lack of perspective while the latter emphasizes the fact that Romania has done a great work in supporting entrepreneurship and the creation of value-added businesses.
236 | Ramona – Diana LEON
Measuring the Knowledge Economy: A National and Organizational Perspective
Figure 3. Romania’s results compared with the EU-27 average performance, in 2010, according to the Lisbon Scorecard (World Economic Forum, 2010)
Figure 4. EU-27 average performance compared with the one registered by USA and East Asia, in 2010, according to the Lisbon Scorecard
(World Economic Forum, 2010)
Since 2010, the Lisbon Scorecard was reorganized so that it fits the requirements of Europe 2020 Strategy (Tilford & Whyte, 2011). The newest form includes five dimensions instead of eight, namely: (i) innovation; (ii) liberalization; (iii) enterprise; (iv) employment and social inclusion; and (v) sustainable development and the environment. The aspects regarding “Information Society” are included in the “innovation” dimension, while “Network Industries” and “Financial Services” are reunited under the “liberalization” umbrella. Besides, the sources of data have changed; the analysis is now based exclusively on statistical data. Last but not least, EU performance is no longer compared with the one registered by USA and East Asia; the Lisbon Scorecard became kind of an “in-house” benchmarking tool. So far, the best performers remain Austria, Denmark, the Netherlands and Sweden while the villains are represented by Italy, Bulgaria, Romania and Malta.
Innovation Union Scoreboard
238 | Ramona – Diana LEON
Measuring the Knowledge Economy: A National and Organizational Perspective
Scorecard, it can be used as a benchmarking tools inside and outside the EU boundaries.
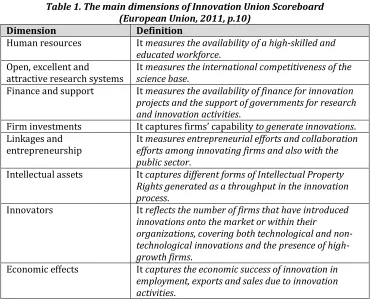
It involves analyzing the evolution of 25 indicators which are assumed to describe the “performance of the national research and innovation systems considered as a whole” (European Union, 2011, p.6). These are organized around three pillars (enablers, firm activities, and outputs) which incorporate eight dimensions, namely: (i) human resources; (ii) open, excellent and attractive research systems; (iii) finance and support; (iv) firm investments; (v) linkages and entrepreneurship; (vi) intellectual assets; (vii) innovators; and (viii) economic effects (Table 1). A special attention should be given to the first dimension which brings forward the knowledge “keepers” and it emphasizes the need for investing in their development. As Hughes and Kitson (2012) state their importance is even higher since highly skilled human resources are needed in order to create new knowledge, to acquire, disseminate and incorporate the old one in innovative goods and services. Thus, they are the “heart” of the knowledge economy.
Table 1. The main dimensions of Innovation Union Scoreboard (European Union, 2011, p.10)
Dimension Definition
Human resources It measures the availability of a high-skilled and educated workforce.
Open, excellent and
attractive research systems It measures the international competitiveness of the science base. Finance and support It measures the availability of finance for innovation
projects and the support of governments for research and innovation activities.
Firm investments It captures firms’ capability to generate innovations. Linkages and
entrepreneurship It measures entrepreneurial efforts and collaboration efforts among innovating firms and also with the public sector.
Intellectual assets It captures different forms of Intellectual Property Rights generated as a throughput in the innovation process.
Innovators It reflects the number of firms that have introduced innovations onto the market or within their
organizations, covering both technological and non-technological innovations and the presence of high-growth firms.
Data are collected from Eurostat and other international databases and then normalized on a scale of 0 to 1, based on the same equation as the one used by Lisbon Scorecard. It other words, the normalization procedure is based on the utility function.
Figure 5. The Innovation Union Scoreboard, in 2010 (European Union, 2011)
240 | Ramona – Diana LEON
Measuring the Knowledge Economy: A National and Organizational Perspective
performers remain the same in 2015, according to the European Innovation Scoreboard – the newest version of the Innovation Union Scoreboard –, not the same can be argued in relation to the worst performers (Figure 6); Croatia switched its place with Lithuania while Romania managed to record the lowest score, switching its place with Latvia.
Figure 6. The European Innovation Scoreboard, in 2015 (European Union, 2016)
performance. The smallest gap is registered at the “Human resources” level (0.183 points on a scale of 0 to 1) while the highest one characterizes the “Leadership & entrepreneurship” dimension (0.428 points on a scale of 0 to 1).
Figure 7. Romania’s results compared with the EU-28 average performance, in 2015, according to the European Innovation Scoreboard
(European Union, 2016)
Comparative analysis
If Knowledge Assessment Methodology, Lisbon Scorecard and Innovation Union Scoreboard are compared the following elements can be remarked: 1. Despite the fact that they use a different approach (Knowledge Assessment Methodology concentrates on four pillars while Lisbon Scorecard focuses on eight dimensions), all of them try to offer a general image on the elements that foster knowledge creation, dissemination and use.
2. All of them concentrate on providing a holistic perspective on the current situation without emphasizing its causes.
3. They focus not only on measuring a country’s performance but also on comparing its result with other economies with which they do not share the same resources or development conditions.
242 | Ramona – Diana LEON
Measuring the Knowledge Economy: A National and Organizational Perspective
5. In all cases, a normalization procedure is employed. Lisbon Scorecard and Innovation Union Scoreboard usethe utility function in order to ensure data normalization while Knowledge Assessment Methodology applies the rank method.
6. The general value provided by each of these tools is based on the arithmetic average of its components although not all the variables included in the analysis have the same importance and impact on the development of a knowledge economy.
7. The elements regarding ICT and social inclusion are omnipresent.
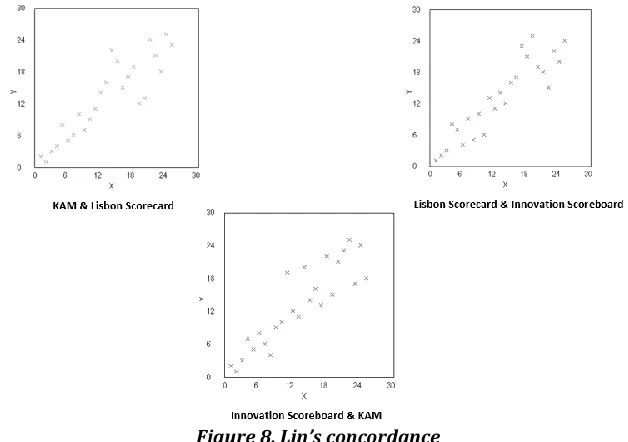
Figure 8. Lin’s concordance
Furthermore, the similarities that exist among the aforementioned international instruments that measure countries progress towards developing themselves as knowledge economies are also highlighted by Lin’s concordance coefficient (McBride, 2005). As it can be noticed from Figure 8, they tend to have the same information capability.
Table 2. Spearman’s rank correlation coefficient
KAM Lisbon Scorecard IUS
KAM 0.89846 0.890769
Lisbon Scorecard 0.913846
IUS
based on Knowledge Assessment Methodology, Lisbon Scorecard and Innovation Union Scoreboard are statistically significant. In other words, their explanatory power is very similar although their structure and the sources of data are different.
Knowledge economy: from international to organizational level
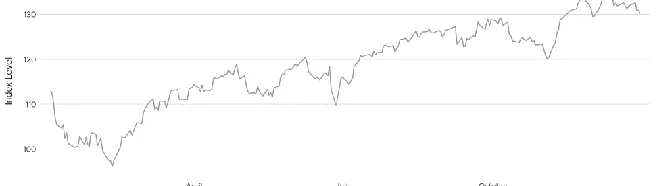
Kensho New Economies Composite Index is used since 2014 and it includes only those companies which are listed on New York Stock Exchange, and meet minimum capitalization (100 million dollars) and a three-month average daily traded value (1 million dollars) thresholds. Its composition is changed with regularity; on the first Friday of June and December new companies are selected. As it can be observed from Figure 9, on a general level, its evolution is ascending; its smallest value was registered at the beginning of the year and the higher one was achieved at the end of 2016.
Figure 9. The evolution of Kensho New Economies Composite Index, in 2016 (Kensho Technologies, 2017)
The true value of this tool resides in the fact that it is able to bring forward those companies which manage to use efficiently their most important organizational resource – knowledge. So, although it currently reunites 251 companies, each of them has a different weight in the total result, a weight which practically reflects their efficiency. The weight of each organization is measured based on the Sharpe Optimization algorithm; therefore, it is determined in accordance with the following equations (Kensho Technologies, 2017):
(2)
, where:
(3) ∑
244 | Ramona – Diana LEON
Measuring the Knowledge Economy: A National and Organizational Perspective
(5) {
( )
Where: ri - average daily return of the index i over the prior 126 days;
- standard deviation of daily return the index over the prior 126 days;
Rf - risk-free rate;
Sharpei,d - Sharpe Ratio of the index i on a given calculation day;
Sharpei - Final Index Sharpe Ratio of the index i.
First of all, according to Table 3, the best performers belong to technology sector; only a few of them come from the aerospace industry and only one is dedicated to manufacturing goods that are not really depending on technology. These results are in line with the general assumption that the knowledge intensive companies are IT-driven firms (Arunprasad, 2016; Collet, Hine & du Plessis, 2015; Levi-Jakšić, Radovanović & Radojičić, 2013). Besides, they bring forward the fast pace of technological progress and the powerful impact that the Internet of Things has it on the development of the current economy.
Table 3. The companies which have the highest importance in Kensho New Economies Composite Index (Kensho Technologies, 2017)
Company Industry Weight
STMicroelectronics N.V. Semiconductor 0.02306546
Boeing Company Aerospace 0.01785202
Lockheed Martin Corp. Aerospace 0.01783726 Northrop Grumman Corp. Global security 0.01724691
Harris Corp. Technology 0.01455631
Honeywell International Inc. Technology 0.01420876
Maxlinear Inc. Hardware 0.01359509
Aerojet Rocketdyne Holdings
Inc. Technology 0.01330721
Abb Ltd. Technology 0.01228700
Tesla Motors Automotive 0.01181976
Acuity Brands Inc. Electronics 0.01123488
Mobileye NV Technology 0.01118415
Heico Corp. Aerospace 0.01111763
Griffon Corp. Materials manufacturing 0.01085243
Irobot Corp. Technology 0.01038931
Raytheon Company Technology 0.01016993
Secondly, what all these companies have in common is powerful sense of reality; they understood what are the most import issues in the knowledge economy and they decided to exploit them. In other words, they are trying to adapt to the current challenges by investing continuously in their human resources and innovating. They value their employees – the only organizational resource capable of transforming all the other resources and adding value, and the “holders” of knowledge – and they developed the necessary organizational processes and tools that support knowledge creation, codification, dissemination and use. Due to these, they are able to challenge the status quo, and to anticipate the needs of their customers. Nevertheless, they promoted the same way of thinking (spiritual and emotional knowledge) and acting (cognitive knowledge) among their suppliers, distributors, collaborators and customers; thus, it may be claimed that, within the framework of a knowledge economy, they foster the dissemination of cognitive, spiritual and emotional knowledge.
Table 4. The firms which have the smallest contribution to the value of Kensho New Economies Composite Index (Kensho Technologies, 2017)
Company Industry Weight
DuPont Engineering 0.00023982
Intrexon Corporation Synthetic biology 0.00023644 Seattle Genetics Biotechnology 0.00023380 Ligand Pharmaceuticals Inc. Biopharmaceutical 0.00022877 Regeneron Pharmaceuticals Biotechnology 0.00021902 United Therapeutics Corp. Biotechnology 0.00021705 Biogen Idec Inc. Biotechnology 0.00020954 Aduro Biotech Inc. Immunotherapy 0.00018533 Amphastar Pharmaceuticals Inc. Pharmaceutical 0.00016242 AquaBounty Techs.WNI. Biotechnology 0.00000163
246 | Ramona – Diana LEON
Measuring the Knowledge Economy: A National and Organizational Perspective
Conclusions and future research directions
Knowledge economy development remains a topic of interest for both practitioners and academics. As aforementioned, some (European Union, 2011, 2016; World Bank, 2012; World Economic Forum, 2010) try to measure it by analyzing what is happening at the national level while others (Kensho Technologies, 2017) concentrate on determining companies’ contribution and reaction to its development. The ones from the first category developed several tools which offer practically the same results; as it has been demonstrated, the three most frequently used tools for measuring countries’ progress towards consolidating themselves as knowledge economies have the same information capability. So, despite the changes that have been made regarding their name and structure, Knowledge Assessment Methodology, Lisbon Scorecard and Innovation Union Scoreboard have the same explanatory power. Their use may be redundant since they provide very similar results after using various variables and sources of data. However, they bring forward the progress made at the national level towards developing a sustainable knowledge economy.
The ones from the second category tend to emphasize what is usually labelled as “intellectual capital”, although they use the phrase “Knowledge Economy”. In other words, they reflect the value of the knowledge assets created and used by an organization (Leon, 2016; Sveiby & Riebling, 1986) and not exactly what is happening at the economic level. Still, its main strength resides in the fact that it emphasizes the high level of connectivity that characterizes the current economy; it manages to analyze not only the current performance of a firm but also the effect it has on its stakeholders. However, its main vulnerability is linked to its selection criteria and it is frequently encountered in the attempts of measuring a firm’s intellectual capital (De Silva, Stratford & Clark, 2014; Leon, 2016; Kehelwalatenna, 2016); it takes into account only those companies which are listed at the New York Stock Exchange and it neglects the performance and importance of all the other ones.
Within this framework, the following research directions can be identified: (i) redefining what a knowledge economy is and establishing its pillars; and (ii) developing a composite index that combines the national and organizational perspective upon the development of a knowledge economy.
References
Arunprasad, P. (2016). Guiding metaphors for knowledge-intensive firms: Strategic HRM practices and knowledge strategies. International Journal of
Organizational Analysis, 24(4), 743-772.
Bratianu, C. (2009). The Frontier of Linearity in the Intellectual Capital Metaphor. Electronic Journal of Knowledge Management, 7(4), 415-424,
Bueno, E. (2011). Modelo Intellectus: Medicion y gestion del capital intelectual. Documentos Intellectus, 9/10(1), 1-79.
Chen, D.H.C., and Dahlman, C.J. (2006). The Knowledge Economy, the KAM Methodology and World Bank Operations. Washington, DC: World Bank. Collet, C., Hine, D., and du Plessis, K. (2015). Employability skills: perspectives from
a knowledge-intensive industry. Education + Training, 57(5), 532-559. Cricelli, L., Greco, M., and Grimaldi, M. (2014). An overall index of intellectual
capital. Management Research Review, 37(10), 880-901.
Dang, D., and Umemoto, K. (2009). Modelling the development toward the knowledge economy: a national capability approach. Journal of Knowledge Management, 13(5), 359-372.
De Silva, T.-A., Stratford, M., and Clark, M. (2014). Intellectual capital reporting: a longitudinal study of New Zealand companies. Journal of Intellectual Capital, 15(1), 157-172.
Donlagic, S., Fazlic, S., and Nuhanovic, A. (2015). Introducing a Framework for Knowledge Economy Development in Transition Countries: The Case of Bosnia and Herzegovina. Ekonomski Vjesnik, 28(1), 257-266.
Drucker, P.F. (1993). Postcapitalist Society. New York: Harper Collins.
European Union (2011). Innovation Union Scoreboard (IUS) 2010. The Innovation Union's performance scoreboard for Research and Innovation. Brussels: PRO INNO Europe.
European Union (2016). The European Innovation Scoreboard. Brussels: PRO INNO Europe.
Habibi, M.R., Davidson, A., and Laroche, M. (2017). What managers should know about the sharing economy. Business Horizons, 60(1), 113-121.
Howell, D.C. (2002). Statistical Methods for Psychology. Pacific Grove, CA: Duxbury. Hughes, A., and Kitson, M. (2012). Pathways to impact and the strategic role of
universities: new evidence on the breadth and depth of university
knowledge exchange in the UK and the factors constraining its development. Cambridge Journal of Economics, 36(3), 723-750.
248 | Ramona – Diana LEON
Measuring the Knowledge Economy: A National and Organizational Perspective
Kehelwalatenna, S. (2016). Intellectual capital performance during financial crises. Measuring Business Excellence, 20(3), 55-78.
Kensho Technologies (2017). Kensho New Economies Composite℠ Index. Retrieved on April 19, 2017 from http://kenshoindices.com/index/KNEX. Kowalska, I. (2016). Sources of Financing Knowledge-Based Economy: the Case of
Formal, Non-Formal and Informal Education in Poland. Oeconomia Copernicana, 7(1), 75-90.
Labra, R., and Sánchez, M.P. (2013). National intellectual capital assessment models: a literature review. Journal of Intellectual Capital, 14(4), 582-607. Landis, J.R., and Koch, G.G. (1977). The measurement of observer agreement for
categorical data. Biometrics, 33(1), 159-174.
Legendre, P. (2005). Species associations: The Kendall coefficient of concordance revisited. Journal of Agricultural, Biological & Environmental Statistics, 10, 226-245.
Leon, R.D. (2016). Intellectual capital – source of competitiveness. International Journal of Learning and Intellectual Capital, 13(2/3), 149-166.
Leon, R.D., and Nica, P. (2011). Europe 2020 strategy – Forecasting the level of achieving its goals by the EU member states. Management & Marketing. Challenges for the Knowledge Society, 6(1), 3-18.
Lerro, A., and Schiuma, G. (2013). Intellectual capital assessment practices: overview and managerial implications. Journal of Intellectual Capital, 14(3), 352-359.
Levi-Jaksic, M., Radovanovic, N., and Radojicic, Z. (2013). Absorptive capacity constituents in knowledge-intensive industries in Serbia. Zbornik Radova Ekonomski Fakultet u Rijeka, 31(2), 253-278.
Lilleoere, A.N., and Hansen, E.H. (2011). Knowledge-sharing enablers and barriers in pharmaceutical research and development. Journal of Knowledge
Management, 15(1), 53-70.
Lombardi, P., and Schwabe, F. (2017). Sharing economy as a new business model for energy storage systems. Applied Energy, 188(C), 485-496.
Macerinskiene, I., Macerinskas, J., and Aleknaviciute, R. (2016). Change of National Intellectual Capital in EU Countries. Montenegrin Journal of Economics, 12(4), 65-75.
Machlup, F. (1962). The Production and Distribution of Knowledge in the United States. Princeton, NJ: Princeton University Press.
Malouche, M.M., Plaza, S., and Salsac, F. (2016). Mobilizing the Middle East and North Africa Diaspora for Economic Integration and Entrepreneurship. Washington, DC: World Bank.
May, C. (2002). The Information Society: A Sceptical View. Cambridge: Polity. McBride, G.B. (2005). Using Statistical Methods for Water Quality Management:
Issues, Problems and Solutions. New York: Wiley.
Nonaka, I., and Takeuchi, H. (1995). The Knowledge Creation Company: How Japanese Companies Create the Dynamics of Innovation. Oxford: Oxford University Press.
Rouis, M., and Tabor, S.R. (2013). Regional Economic Integration in the Middle East and North Africa: Beyond Trade Reform. Directions in development: trade. Washington, DC: World Bank.
Rubalcaba, L., Gago, D., Ariano, M., and Tripathi, A. (2016). Services and Innovation for the Competitiveness of the Ecuadorian Economy. Policy Research Working Paper No.7767. Washington, DC: World Bank.
Shiryaev, D.V., Artemova, E.I., Zelinskaya, M.V., Novoselov, S.N., Galiullina, S.D., and Pismennaya, E.E. (2016). “Knowledge Economy” as a Resource for the Intensification of Socio-Economic Transformation of the Regional Economic Space. International Review of Management and Marketing, 6(S1), 232-237. Smith, K. (2002). What is the knowledge economy? Knowledge-intensive industries
and distributed knowledge bases. UNU/INTECH Discussion Papers. Retrieved on April 20, 2017 from
http://www.intech.unu.edu/publications/discussion-papers/2002-6.pdf. Stewart, T.A. (1997). Intellectual Capital: The New Wealth of Organizations. New
York: Doubleday Dell Publishing Group.
Suh, J., and Chen, D.H.C. (2007). Korea as a Knowledge Economy: Evolutionary Process and Lessons Learned. Washington, DC: World Bank.
Sveiby, K.E., and Riebling, A. (1986). The Know-How Company [Kunskabsföretaget]. Malmo: Liber.
Tan, J.-P., Lee, K.H., Flynn, R., Roseth, V.V., and Nam, Y.-J.J. (2016). Workforce Development in Emerging Economies: Comparative Perspectives on Institutions, Praxis, and Policies. Directions in Development - Human Development. Washington, DC: World Bank.
Tilford, S., and Whyte, P. (2011). The Lisbon Scorecard X: The road to 2020. London: Centre for European Reform.
Utz, A., and Aubert, J.-E. (2013). Transforming Arab Economies: The Knowledge and Innovation Road. Washington, DC: World Bank.
World Bank (2012). Knowledge Economy Index (World Bank), 2012. Retrieved on April 19, 2017 from
https://knoema.com/WBKEI2013/knowledge-economy-index-world-bank-2012.
World Economic Forum (2010). The Lisbon Review 2010. Towards a More Competitive Europe? Geneva: World Economic Forum.
Zanini, M.T., and Musante, M. (2013). Trust in the knowledge economy. Journal of Business & Industrial Marketing, 28(6), 487-493.