journal homepage: http://civiljournal.semnan.ac.ir/
A New Two-Stage Method for Damage Identification
in Linear-Shaped Structures Via Grey System Theory
and Optimization Algorithm
G. Ghodrati Amiri1 *, A. Zare Hosseinzadeh1 and M. Jafarian Abyaneh1 1. Center of Excellence for Fundamental Studies in Structural Engineering, School of Civil Engineering, Iran University of Science & Technology, Tehran, Iran.
*Corresponding author:[email protected]
ARTICLE INFO ABSTRACT
Article history:
Received: 23 November 2015 Accepted: 27 February 2016
The main objective of this paper is concentrated on presenting a new two-stage method for damage localization and quantification in the linear-shaped structures. A linear-shaped structure is defined as a structure in which all elements are arranged only on a straight line. At the first stage, by employing Grey System Theory (GST) and diagonal members of the Generalized Flexibility Matrix (GFM), a new damage index is suggested for damage localization using only the first several modes’ data. It is followed by the second stage which is devoted to damage quantification in the damaged elements by proposing an optimization-based procedure to formulate fault prognosis problem as an inverse problem, and it is solved by the Pattern Search Algorithm (PSA) to reach the optimal solution. The applicability of the presented method is demonstrated by studying different damage patterns on three numerical examples of linear-shaped structures. In addition, the stability of the presented method in the presence of random noises is evaluated. The obtained results reveal good and acceptable performance of the proposed method for detecting damage in linear-shaped structures.
Keywords:
Damage identification, Modal data,
Generalized flexibility matrix, Grey system theory,
Pattern search algorithm.
1. Introduction
Since maintenance concerns influence the decision whether a structure needs rehabilitation or minor repairs, health monitoring of structures has always been of vital importance to the engineers. In this regards, a great deal of attention has been drawn to detect and quantify structural damages. Most of the recently developed
characteristics [1]. For instance, different direct vibration-based methods have been developed for identifying damage locations based on the natural frequencies [2, 3], mode shape vectors [4-8] and/or their derivatives [9-11]. Although these methods can localize damage, most of them cannot estimate damage severity.
One of the well-known strategies for detecting damage severities as well as damage locations is those methods which formulate the problem as an optimization task [12-16]. In these methods, the cost function is defined using analytical model of the damaged structure with unknown damage severities in all elements. Then, an iterative strategy is employed to find optimal solution as damage detection results. Ghodrati Amiri et al. [13] proposed a model-based method for damage prognosis in plates by introducing modal data-based cost function. They solved the optimization problem via pattern search and genetic algorithms. Kang et al. [14] employed an improved version of the particle swarm optimization to detect structural damage and illustrated its efficiency by presenting a comparative study with other evolutionary optimization algorithms. Saada et al. [15] developed an optimization-based strategy for damage identification in beams using finite element model updating and particle swarm optimization. Ghodrati Amiri et al. [17] utilized democratic particle swarm optimization to detect structural damages in engineering structures using a new geometrical-based cost function. Kaveh and Zolghadr [18] suggested an improved version of the charged system search optimization algorithm and used it for damage localization and quantification in truss structures. Recently, Zare Hosseinzadeh et al. [16] identified structural damage by means of
estimated static deflections and cuckoo optimization algorithm.
Despite good performance of the optimization-based approaches in real cases, the complexity of the solution domain (due to the number of unknown damaged elements which is considered equal to the number of elements) and its ill-posed conditions can cause some difficulties in finding global extremums. In addition, researchers prefer approaches which need only a few lower modes’ data for detecting structural damages. This paper presents a new two-stage framework for damage identification in linear-shaped structures. The first stage is related to damage identification using Grey System Theory (GST) and Generalized Flexibility Matrix (GFM). At this stage, a novel damage index is suggested to localize damages by allocating only one parameter to each element of a linear-shaped structure. In the second stage, an optimization-based approach is proposed to quantify damages at the damaged elements. So, the complexity of the solution domain decreases because of decreasing the number of unknown parameters. The Pattern Search Algorithm (PSA), a derivative-free optimization strategy, is used for solving the optimization problem. Finally, the presented method is validated by studying several damage patterns on three numerical examples of linear-shaped structures under different conditions.
2. Proposed method
2.1. Damage localization
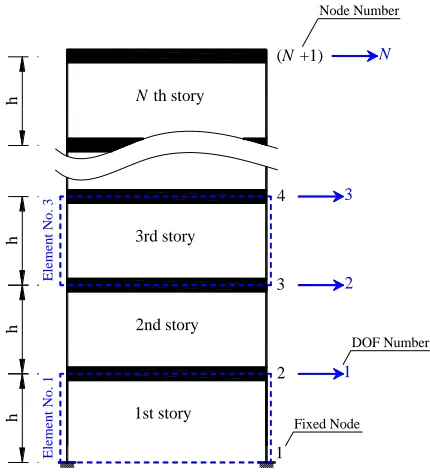
This section presents details of the first stage of the proposed method which is devoted to damage localization in linear-shaped structures. Generally, a linear-shaped structure is defined as a structure in which all elements are arranged only on a straight line. In addition, the structure is fixed by one support (at one end). In other words, each member or each element of a linear-shaped structure is introduced by two nodes and each free node has only one degree of freedom (DOF). Shear frames are the best example of linear-shaped structures. Fig. 1 shows the finite element model of an N story shear frame in which each story can be defined as an element. From this figure, it is obvious that in a shear frame, there are N elements (or DOFs) and (N+1) nodes (= N free nodes + one fixed node).
By considering these conditions, the free vibration problem for a structure with N
DOFs and Ne elements can be presented as below:
, 1, 2,...,
i i i i N
Kφ Mφ (1)
where K and M are global stiffness and mass matrices, respectively. In addition, λi and φi
are the i-th eigenvalue and related mass-normalized eigenvector, respectively.
By utilizing the first m modes’ data (i.e. the first m eigenvalues and related eigenvectors), the flexibility matrix (Fm) can be estimated as
follows:
1 T
m m m m
F Φ λ Φ (2) in which Фm is a matrix which consists of the
first m modes’ mass-normalized eigenvectors and λm is a diagonal matrix of the first m
eigenvalues.
Fig 1. Finite element model of a shear frame
Based on Eq. (2), the flexibility matrix depends inversely on λi. Therefore, the higher modes’ contribution to the flexibility matrix decreases as the number of utilized modes increases. Although an acceptable estimation for inverse of the global stiffness matrix can be achieved by employing only the first m modes’ data, Li et al. [19] presented Generalized Flexibility Matrix (GFM) as an effort to strongly decrease the effects of higher modes’ data on calculating the flexibility matrix. By multiplying of flexibility matrix (Fm) in the expression
(MFm)l, and doing some mathematical
simplifications, the l-th order of GFM using the first m modes’ data is defined as below:
( ) 1
g l l T
m m m m
F Φ λ Φ (3) This paper uses the second-order of the GFM (l=2):
(2) 3
g T
m m m m
F Φ λ Φ (4) Therefore, it can be inferred that the GFM decreases the impacts of the natural
h
2 3 4
(N +1)
2nd story 3rd story
N th story
1
1 2 3
N
El
em
en
t N
o
.
3
Node Number
Fixed Node
DOF Number
El
em
en
t N
o
.
1
h
h
h
frequencies of higher modes, significantly and a suitable estimation of the flexibility matrix can be provided by utilizing only the first lower modes’ data.
As mentioned before, the first stage of the presented method is aimed at proposing a damage localization index based on Grey System Theory (GST). GST is defined as a criterion for measuring amount of correlation between two regular sequences by means of some geometrical-based concepts using differences between baseline and test sequences [20]. Readers can find more details about GST in [21, 22]. Since changes in the diagonal members of the flexibility matrix between damaged and healthy states reveal a good range of sensitivity to damages, it seems that a sensitive damage index could be extracted by applying GST on the diagonal members of the flexibility matrix. Vectors Du and Dd are defined by considering the diagonal members of the calculated GFM for intact structure (Fmg(2),u)
and damaged structure (Fmg(2),d), respectively:
(2), (2),
(2), (2),
{ (1,1) (2, 2) ...
( , ) ... ( , )}
u g u g u
m m
g u g u T
m i i m N N
D F F
F F (5)
(2), (2),
(2), (2),
{ (1,1) (2, 2) ...
( , ) ... ( , )}
d g d g d
m m
g d g d T
m i i m N N
D F F
F F
(6)
If vectors Du and Dd are considered as reference and test sequences, respectively, the Grey Relation Coefficients (GRC) can be calculated as below:
min( ) max( ) ( )
( ) max( )
GRC n
n
β β
β (7)
in which GRC(n) is GRC in the n-th point. α is defined as distinguishable coefficient to adjust the limit of the comparison domain, and is a number between 0 and 1. In the
present study α is selected 0.5. Moreover, β is the grey variant vector defined as follows:
(1) (2) ... (N)
T
β (8)
where;
( ) u( ) d( )
n n n
D D (9)
Using calculated GRCs for all points, the GRC’s vector can be assembled as:
{ (1) (2) ...
( ) ... ( )}T
GRC GRC
GRC i GRC N
GRC
(10)
Generally, GRC(n)>0.9 shows a complete relation for n-th point between the baseline and test sequences [21]. By considering this fact, vector T is proposed as:
.
T 1 0 GRC (11)
in which:
1.0 ( ) , 1, 2,..., i
T GRC i i N (12)
It should be noticed that Ti is considered zero for fixed nodes. So, for a linear-shaped structure (see Fig. 1), T has (N+1) members. The Ti can be normalized as below:
, 1, 2,..., , ( 1) max( )
i i
T
T i N N
T (13)
Finally, for the j-th element, the proposed damage index is defined as:
(j th element) (j 1) j , 1, 2,...,
DI T T j N
(14)
where Tj is the normalized T in the j-th
node.
As mentioned before, this method is applicable to linear-shaped structures. The performance of the proposed damage index
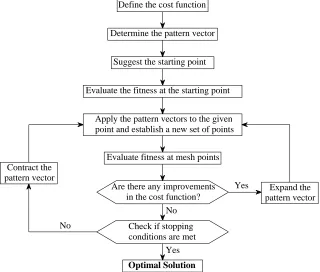
Fig 2. Flowchart of the Pattern Search Algorithm
“Since DI allocates a scalar to each element, the j-th element will be introduced as a damaged element if the calculated DIj is distinguishably bigger than zero.”
2.2. Damage quantification
The second stage of the proposed method is aimed at quantifying damage extents in the damaged elements by defining damage detection problem as an inverse problem. The main strategy in formulating cost function is based on evaluating different possible combination of damage severities in the damaged elements to find an appropriate arrangement of structural properties in the analytical model which can generate the vector Dd of the monitored structure.
The stiffness matrix for the analytical model of the damaged structure is defined as:
1 2
1
( , ,..., ) (1 )
e
e
N
u
N i i
i
x x x x
K K (15)
where Kiu is the stiffness matrix for the i-th
element in the healthy state, and Ne is the number of elements. In addition, xi is the damage severity of the i-th element, which is a number between 0 and 1 for undamaged and fully damaged elements, respectively. Since the undamaged elements are recognized based on the results of the first stage of the presented method, x is equal to zero for undamaged elements, however, it is an unknown parameter for damaged elements. If the second order of GFM for the analytical model and related diagonal members are shown with Fmg(2),x and Dx,
respectively, the proposed cost function can be written as below:
( ) x d
Cost x D D (16) where || || is a sign for showing Euclidean length, and x is the vector of damage severities (with zero or unknown values for healthy or damaged elements) as follows: Define the cost function
Determine the pattern vector
Suggest the starting point
Evaluate the fitness at the starting point
Apply the pattern vectors to the given point and establish a new set of points
Evaluate fitness at mesh points
Are there any improvements in the cost function?
Check if stopping conditions are met
Expand the pattern vector Yes
No
Yes Contract the
pattern vector
No
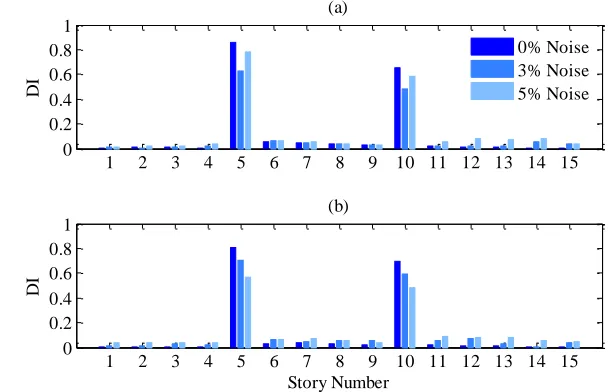
Fig 3. Damage localization results for damage pattern (1) in the fifteen-story shear frame using (a) the first one mode’s data and (b) the first three modes’ data
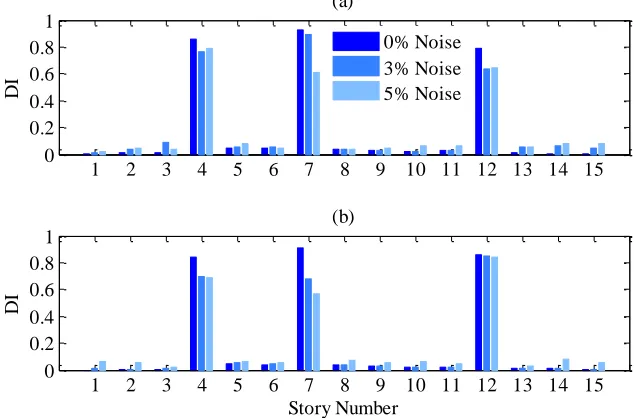
Fig 4. Damage localization results for damage pattern (2) in the fifteen-story shear frame using (a) the first one mode’s data and (b) the first three modes’ data
1 2 ... e
, 0 1.0T
N i
x x x x
x (17)
Finally, the Pattern Search Algorithm (PSA) is employed for solving the presented optimization problem and finding optimal solution. PSA is a derivative-free, subclass of direct search methods [23] which has been utilized by different researchers to find global extremums in optimization problems. The
flowchart of this algorithm is shown in Fig. 2. This method can briefly be described in a way that initiates by establishing set of points called mesh around the given point which could be obtained from the previous iteration or from the first starting point provided by the user. The mesh is generated by adding a scalar multiple set of vectors called a pattern to the current point, afterwards, it explores a 1 2 3 4 5 6 7 8 9 10 11 12 13 14 15
0 0.2 0.4 0.6 0.8 1
DI
(a)
0% Noise 3% Noise 5% Noise
1 2 3 4 5 6 7 8 9 10 11 12 13 14 15 0
0.2 0.4 0.6 0.8 1
DI
Story Number (b)
1 2 3 4 5 6 7 8 9 10 11 12 13 14 15 0
0.2 0.4 0.6 0.8 1
DI
(a)
0% Noise 3% Noise 5% Noise
1 2 3 4 5 6 7 8 9 10 11 12 13 14 15 0
0.2 0.4 0.6 0.8 1
DI
set of points (i.e. mesh) around the current point of parameters to locate a point where cost function has a lower value. When a point with a lower cost function value is identified, the algorithm assigns the point as its current position and the iteration is considered successful. After that, the algorithm continues through the next iteration with extended mesh size. For the PSA, there are different stopping conditions and by occurring each of them, the optimization procedure will be stopped. Reaching the maximum number of iterations, for instance, is one of the stopping conditions for PSA. Readers can find more information about PSA and its stopping conditions in [13, 24].
3. Numerical studies
3.1. Fifteen-story shear frame
The first example is concentrated on damage localization and quantification in a fifteen-story shear frame. Table 1 presents the physical properties of this structure. Three studied damage patterns have been listed in Table 2. The patterns are simulated using presented strategy with Eq. (15). In this example, only the first -one and -three modes’ data are utilized for calculating GFM. The obtained damage localization results for free noise state are shown in Figs. 3-5 for the mentioned damage patterns. It can be seen that the proposed DI is able to identify damage locations efficiently, without any false results. By detecting damage locations, the second stage of the method is employed for damage quantification only at the damaged stories. The selected parameters for PSA are summarized in Table 3. It should be noticed that these parameters are selected by a trial and error scheme. As it is mentioned before, the PSA follow an iterative approach to find global extremums of the problem.
Table 1. Physical properties of fifteen-story shear frame
Story No. Mass (ton) Stiffness (MN/m)
1~6 80 8.0
7~9 50 8.0
10~15 35 5.5
Table 2. Simulated damage patterns in the fifteen-story shear frame
Pattern (1) Pattern (2) Pattern (3)
Story Damage (%)
Story Damage (%)
Story Damage (%)
8 5 5 10 4 10
10 5 7 15
12 20
Table 3. Input parameters for the Pattern Search Algorithm
Bind tolerance 0.001
X tolerance 1E-06
Function tolerance 1E-06
Maximum function evaluations 2000-8000
Maximum number of iteration 200-1200
Initial values zero
Predicted damage severities for the simulated patterns are summarized in Table 4. It is obvious that the presented method can find damage severities with high level of accuracy when free noise data (i.e. ideal input data) are fed.
Despite accurate performance of the presented method for damage identification using ideal input data, investigation its robustness in the presence of random noises is necessary to generalize its reliability for real SHM programs. Here, this issue is addressed by polluting natural frequencies with random noises as below [17]:
(1 )
n
i i zi
in which ωin and ωi are the i-th natural
frequency with and without noise, respectively. In addition, η is the noise level, and zi is a random number between [-1 1]. In this section, natural frequencies are polluted with 3% and 5% of random noises. For the simulated damage patterns, Figs. 3-5 and Table 4 presents obtained results for damage localization and quantification, respectively. Although different levels of noises are added to input data, DIs are considerably bigger than zero for the damaged stories, therefore, judgment about the health of the stories can
be made easily. Moreover, the predicted damage severities in the damaged stories show a good accordance with the simulated damages. This claim can be proved by evaluating amount of comparative errors between predicted and simulated damages. For instance, comparative errors for the third damage pattern (in the noisy states) have been presented in Table 4. These errors are justifiable by considering not only the absolute amount of the predicted damage severities, but also the severity of the simulated faults.
Fig 5. Damage localization results for damage pattern (3) in the fifteen-story shear frame using (a) the first one mode’s data and (b) the first three modes’ data
Table 4. Predicted damage severity (%) in the damaged stories of the fifteen-story shear frame
Damage Pattern
Damaged Story
m=1 m=3
η=0% η=3% η=5% η=0% η=3% η=5%
(1) 8 5.00 5.17 5.40 5.00 6.02 6.38
(2) 5 10.00 9.84 11.62 10.00 10.17 11.70
10 5.00 5.31 6.34 5.00 5.73 5.39
(3)
4 10.00 10.60 (6.0%)* 11.27 (12.7%) 10.00 11.53 (15.3%) 12.13 (21.3%) 7 15.00 15.36 (2.4%) 15.70 (4.7%) 15.00 16.06 (7.1%) 14.91 (-0.6 %) 12 20.00 20.57 (2.8%) 19.17 (-4.1%) 20.00 20.82 (4.1%) 21.35 (6.7%)
m: number of utilized modal data for damage detection.
η: noise level.
*: comparative error [= 100{(predicted damage severity–actual damage severity)/actual damage severity}]
1 2 3 4 5 6 7 8 9 10 11 12 13 14 15
0 0.2 0.4 0.6 0.8 1
DI
(a)
0% Noise 3% Noise 5% Noise
1 2 3 4 5 6 7 8 9 10 11 12 13 14 15
0 0.2 0.4 0.6 0.8 1
DI
In addition, it can be concluded that by increasing the number of utilized modes the impacts of the noise is increased on the predicted damages and some differences may be appeared between simulated and obtained damage severities.
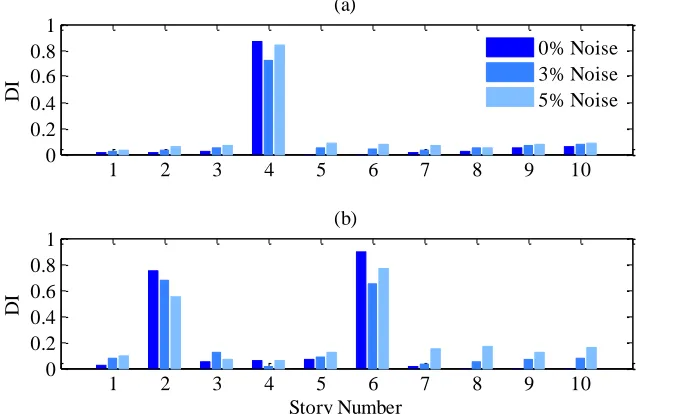
3.2. Asymmetrical ten-story shear frame
The second example is devoted to damage identification in a ten-story shear frame in which there is not any regularity in the material properties. The mass and stiffness for each story of this structure can be found in Table 5. In this example, two different damage patterns which are described in Table 6 are studied to investigate the applicability of the suggested method. Similar to the previous example not only free noise case, but also noisy state is simulated by contaminating natural frequencies with 3% and 5% of random noises. It is assumed that only the first two modes’ data is available for constructing GFM. The obtained results for damage localizations are shown in Fig. 6 for both simulated patterns. By inspecting this figure, it can be concluded that the presented method is able to properly localize damages in the free noise and noisy states. After detecting damaged elements, the second stage of the method is performed to estimate damage severity in the damaged stories. The optimization parameters are similar to those which are listed in Table 3. The obtained results for damage quantification are summarized in Table 7. Although because of using noisy input data some differences can be seen between predicted and simulated damages, all damage severities are estimated with an acceptable accuracy. Therefore, this conclusion can be drawn that the method is able to effectively estimate damage locations as well as damage severities in irregular shear frames.
Table 5. Physical properties of ten-story shear frame
Story No. Mass (ton) Stiffness (MN/m)
1~3 90 7.0
4 50 4.5
5~7 46 8.0
8, 10 80 4.5
9 35 6.0
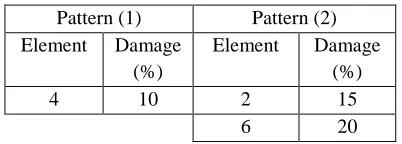
Table 6. Simulated damage patterns in the ten-story shear frame
Pattern (1) Pattern (2) Element Damage
(%)
Element Damage (%)
4 10 2 15
6 20
Table 7. Predicted damage severity (%) in the damaged stories of the ten-story shear frame
Damage Pattern
Damaged Story
m=2
η =0% η =3% η =5% (1) 4 10.00 9.84 10.21
(2) 2 15.00 15.34 16.22 6 19.99 20.49 19.05
m: number of utilized modal data for damage detection. η: noise level.
Fig 6. Damage localization results in the ten-story shear frame using the first two modes’ data for (a) damage pattern (1) and (b) damage pattern (2)
Fig 7. Damage localization results based on MRF [25], in the ten-story shear frame using the first two modes’ data for damage pattern (2)
Here, MRF-based damage index which is proposed by Ge et al. [25] is employed for damage localization in the studied damage pattern (2) using those modal data which were fed in the above mentioned studies. The obtained results are shown in Fig. 7. From this figure, the 1st, 2nd, 5th and 6th DOFs are related to the damaged stories, so, the first, second and sixth stories are reported as damaged stories. As it is obvious, the first story has been detected as damaged story, mistakenly and this is because of the mentioned strategy in the MRF for
considering a story as a damaged one. Therefore, it can be proved that the suggested damage index can be performed better than MRF to identify damage location in linear-shaped structures.
Table 8. Simulated damage patterns in the five-story shear frame
Pattern (1) Pattern (2)
Element Damage (%)
Element Damage (%)
2 10 1 15
4 10
1 2 3 4 5 6 7 8 9 10
0 0.2 0.4 0.6 0.8 1
DI
(a)
0% Noise 3% Noise 5% Noise
1 2 3 4 5 6 7 8 9 10
0 0.2 0.4 0.6 0.8 1
DI
Story Number (b)
1 2 3 4 5 6 7 8 9 10
0 0.2 0.4 0.6 0.8 1
DOF
N
o
rm
a
li
z
e
d
M
R
F
3% Noise 5% Noise
1st story
6th story 2nd
Fig 8. Mean and one standard deviation values of the obtained DIs for damage pattern (1) of the five-story shear frame using (a) the first one mode’s data and (b) the first two modes’ data.
Fig 9. Mean and one standard deviation values of the obtained DIs for damage pattern (2) of the five-story shear frame using (a) the first one mode’s data and (b) the first two modes’ data
3.3. Five-story shear frame
In the previous examples, different studies were carried out to investigate the applicability of the suggested method in detecting simulated damages. Despite acceptable performance of the presented method in the presence of noisy natural frequencies as input data, in the studies of this section, the sensitivity of the method in the presence of random noises in both natural frequencies and mode shape vectors is evaluated using statistical-based concepts to exactly judge on the applicability of the method in real cases. A five-story shear frame is considered. The mass and stiffness for all stories are equal to 50000 kg and 200000 N/m, respectively.
Two different damage patterns which are listed in Table 8 are simulated. To generate noisy input data, the natural frequencies and mode shape vectors are contaminated with 2% and 1% noises, respectively, using the presented approach with Eq. (18). Since in the real programs there is not any regular scheme about noise levels and sources, in the present example the related modal data for each damage pattern is generated three times using different random numbers and then, the presented damage identification approach is applied by utilizing the first -one and -two modes’ data. For the first scenario, the mean and one standard deviation value of the obtained DIs are shown in Fig. 8. Because of feeding noisy input data, DIs are bigger than zero for all elements. However, the
1 2 3 4 5
0 0.2 0.4 0.6 0.8 1
Story Number
DI
(a)
Threshold
1 2 3 4 5
0 0.2 0.4 0.6 0.8 1
Story Number (b)
1 2 3 4 5
0 0.2 0.4 0.6 0.8 1
Story Number
DI
(a)
Threshold
1 2 3 4 5
0 0.2 0.4 0.6 0.8 1
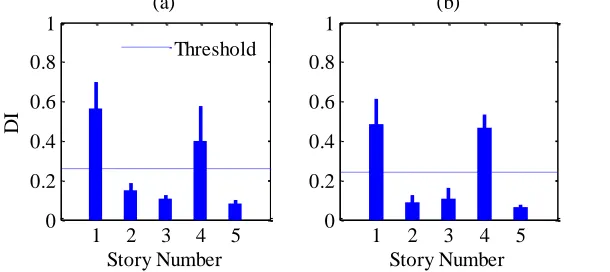
calculated DI is considerably bigger than others for the damaged story, so the damaged story can be detected precisely. In this figure the mean value of all DIs has been shown as
a ‘Threshold’ which can cause more
convenience for finding damaged stories, especially in the real SHM programs. In this scenario, since the DIs are so close to the threshold in undamaged stories, therefore, the healthy elements can be detected easily.
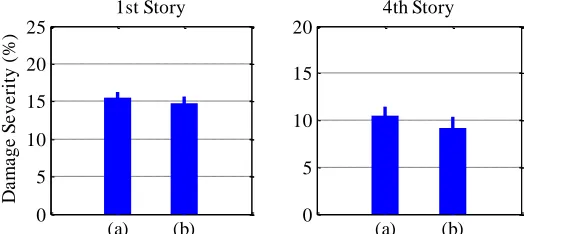
Similar to Fig. 8, Fig. 9 shows the mean and one standard deviation values of the damage localization results for the second damage pattern. In this figure, not only the first and fourth stories’ DIs are considerably bigger than zero, but also they are bigger than the threshold. So, it can be concluded that the first and fourth stories are damaged elements. By identifying damaged stories, the second stage of the method is employed for estimating damage severity. The optimization parameters are same as those which were selected in the previous examples (see Table 3). The mean and one standard deviation value of the obtained damage severities are shown in Figs. 10 and 11 for damage patterns (1) and (2), respectively. The results have a good and acceptable accordance with the actual simulated damages, whether the first one mode’s data is used or the first two modes’ data. Therefore, it can be concluded that the presented method is a viable method for damage localization and quantification in linear-shaped structures.
4. Conclusions
A two-stage approach for damage localization and quantification in linear-shaped structures was presented in this paper. Using Grey System Theory (GST) and diagonal members of the Generalized Flexibility Matrix (GFM), a new damage
index was proposed at the first stage for damage localization. Then, damage severity was estimated by defining an optimization-based procedure using Pattern Search Algorithm (PSA) to quantify damage at those damaged members which are localized at the first stage. The applicability of the suggested method was demonstrated by studying three different examples of shear frames, as common examples of linear-shaped structures, under different damage patterns. Based on the obtained results, some of the main advantages of the proposed method are summarized as below:
• The proposed method can detect damage locations by allocating only one non-zero index to each element, so, it can perform better than those indices which need two non-zero values on the relative nodes to the damaged elements,
• It can detect damages using only the first several lower modes’ data, which can be easily extracted in real SHM programs,
• It reveals high level of sensitivity to damage as well as low level of sensitivity to noisy input data,
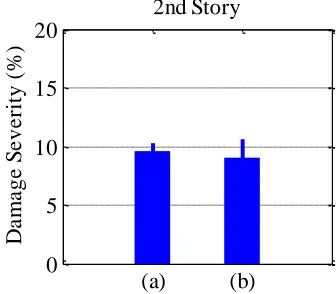
Fig 10. Mean and one standard deviation values of the obtained damage severities in the damaged
story (i.e. the second story) for damage pattern (1) of the five-story shear frame using (a) the first one mode’s data and (b) the first two modes’ data
(a) (b)
0 5 10 15 20
D
a
m
a
g
e
S
e
v
e
ri
ty
(
%
)
Fig 11. Mean and one standard deviation values of the obtained damage severities in the damaged stories (i.e. the first and fourth stories) for damage pattern (2) of the five-story shear frame using (a) the first one
mode’s data and (b) the first two modes’ data
• It can detect single and multiple damage cases with high level of accuracy.
References
[1] Fan, W., Qiao, P. (2011). “Vibration-based damage identification methods: a review and comparative study”. Structural Health Monitoring, Vol. 10, No. 1, pp. 83-111.
[2] Kim, J.T., Stubbs, N. (2003). “Crack detection in beam-type structures using frequency data”. Journal of Sound and Vibration, Vol. 259, No. 1, pp. 145-160. [3] Xia, Y., Hao, H. (2003). “Statistical damage identification of structures with frequency changes”. Journal of Sound and Vibration, Vol. 263, No. 4, pp. 853-870.
[4] Rucka, M., Wilde, K. (2006). “Application of continuous wavelet transform in vibration based damage detection method for beams and plates”. Journal of Sound and Vibration, Vol. 297, No. (3-5), pp. 536-550.
[5] Poudel, U.P., Fu, G.K., Ye, H. (2007). “Wavelet transformation of mode shape difference function for structural damage location identification”. Earthquake Engineering & Structural Dynamics, Vol. 36, No. 8, pp. 1089-1107.
[6] Bagheri, A., Ghodrati Amiri, G., Seyed Razzaghi, S.A. (2009). “Vibration-based damage identification of plate structures via curvelet transform”. Journal of Sound and Vibration, Vol. 327, No. (3-5), pp. 593–603.
[7] Homaei, F., Shojaee, S., Ghodrati Amiri, G. (2014). “A direct damage detection method using multiple damage localization index based on mode shapes criterion”. Structural Engineering and Mechanics, Vol. 49, No. 2, pp. 183-202.
[8] Ghodrati Amiri, G., Jalalinia, M., Zare Hosseinzadeh, A., Nasrollahi, A. (2015). “Multiple crack identification in Euler beams by means of B-spline wavelet”. Archive of Applied Mechanics, Vol. 85, No. 4, pp. 503-515.
[9] Hamey, C.S., Lestari, W., Qiao, P., Song, G. (2004). “Experimental damage identification of carbon/epoxy composite beams using curvature mode shapes”. Structural Health Monitoring, Vol. 3, No. 4, pp. 333-353.
[10] Lestari, W., Qiao, P.Z., Hanagud, S. (2007). “Curvature mode shape-based damage assessment of carbon/epoxy composite beams”. Journal of Intelligent Material Systems and Structures, Vol. 18, No. 3, pp. 189-208.
(a) (b) 0
5 10 15 20 25
D
a
m
a
g
e
S
e
v
e
ri
ty
(
%
)
1st Story
(a) (b) 0
5 10 15 20
[11] Zhu, H., Li, L., He, X.Q. (2011). “Damage detection method for shear buildings using the changes in the first mode shape slopes”. Computers & Structures, Vol. 89, No. (9-10), pp. 733-743.
[12] Perera, R., Fang, S.E., Huerta, C. (2009). “Structural crack detection without updated baseline model by single and multiobjective optimization”. Mechanical Systems and Signal Processing, Vol. 23, No. 3, pp. 752-768.
[13] Ghodrati Amiri, G., Seyed Razzaghi, S.A., Bagheri, A. (2011). “Damage detection in plates based on pattern search and genetic algorithms”. Smart Structures and Systems, Vol. 7, No. 2, pp. 117-132.
[14] Kang, F., Li, J., Qing X. (2012). “Damage detection based on improved particle swarm optimization using vibration data”. Applied Soft Computing, Vol. 12, No. 8, pp. 2329-2335.
[15] Saada, M.M., Arafa, M.H., Nassef, A.O. (2013). “Finite element model updating approach to damage identification in beams using particle swarm optimization”. Engineering Optimization, Vol. 45, No. 6, pp. 677-696.
[16] Zare Hosseinzadeh, A., Ghodrati Amiri, G., Koo, K.Y. (2016). “Optimization-based method for structural damage localization and quantification by means of static displacements computed by flexibility matrix”. Engineering Optimization, Vol. 48, No. 4, pp. 543-561.
[17] Ghodrati Amiri, G., Zare Hosseinzadeh, A., Seyed Razzaghi, S.A. (2015). “Generalized flexibility-based model updating approach via democratic particle swarm optimization algorithm for structural damage”. International Journal of
Optimization in Civil Engineering, Vol. 5, No. 4, pp. 445-464.
[18] Kaveh, A., Zolghadr, A. (2015). “An improved CSS for damage detection of truss structures using changes in natural frequencies and mode shapes”. Advances in Engineering Software, Vol. 80, pp. 93-100.
[19] Li, J., Wu, B., Zheng, Q.C., Lim C.W. (2010). “A generalized flexibility matrix based approach for structural damage detection”. Journal of Sound and Vibration, Vol. 329, No. 22, pp. 4583-4587.
[20] Deng, J.L. (1989). “Introduction to grey system theory”. Journal of Grey System, Vol. 1, No. 1, pp. 1-24.
[21] Fu, C., Zheng, J., Zhao, J., Xu, W. (2001). “Application of grey relational analysis for corrosion failure of oil tubes”. Corrosion Science, Vol. 43, No. 5, pp. 881-889.
[22] Zare Hosseinzadeh, A., Bagheri, A., Ghodrati Amiri, G. (2013). “Two-stage method for damage localization and quantification in high-rise shear frames based on the first mode shape slope”. International Journal of Optimization in Civil Engineering, Vol. 3, No. 4, pp. 653-672.
[23] Box, G.E.P. (1957). “Evolutionary operation: a method for increasing industrial productivity”. Journal of the Royal Statistical Society, Vol. 6, No. 2, pp. 81-101.
[24] Lewis, R.M., Torczon, V. (2002). “A globally convergent augmented Lagrangian pattern search algorithm for optimization with general constraints and simple bounds”. SIAM Journal on Optimization, Vol. 12, No. 4, pp. 1075-1089.