https://doi.org/10.5194/wes-4-527-2019
© Author(s) 2019. This work is distributed under the Creative Commons Attribution 4.0 License.
Performance study of the QuLAF pre-design model for a
10 MW floating wind turbine
Freddy J. Madsen, Antonio Pegalajar-Jurado, and Henrik Bredmose
Department of Wind Energy, Technical University of Denmark, Nils Koppels Allé, Building 403, 2800 Kongens Lyngby, Denmark
Correspondence:Freddy J. Madsen ([email protected])
Received: 29 April 2019 – Discussion started: 14 May 2019
Revised: 9 August 2019 – Accepted: 20 August 2019 – Published: 23 September 2019
Abstract. This paper presents a comparison study of the simplified model QuLAF (Quick Load Analysis of Floating wind turbines) and a FAST model of the Technical University of Denmark (DTU) 10 MW reference wind turbine mounted on the LIFES50+ OO-Star Wind Floater Semi 10 MW floating substructure. The purpose is to investigate how accurate results can be obtained from this simplified model for different load cases. The two models are briefly presented and the limitations of QuLAF are discussed. These are (a) an under-prediction of the wave excitation loads for large sea states; (b) a simplified representation of the rotor-induced forcing and damping; (c) an over-predicted aerodynamic damping for the tower mode motion and (d) restriction to planar motion. All the limitations are linked to approximations applied for achieving the substantial model speedup relative to the state-of-the-art model. The comparative study is based on the planar version of design load cases (DLCs) 1.2, 1.3, 1.6, 2.1 and 6.1, and the overall analysis shows that the simplified model is generally good at estimating the bending moment at the tower base and the floater motions in heave and pitch. The largest tower-base bending moments are slightly predicted, but it is observed that while stronger wind leads to an over-prediction, stronger waves lead to an under-prediction. Thus, in DLC 1.6, where the largest load was obtained at 10.3 m s−1, a good match in tower-base bending moments between the two models is found. The nacelle acceleration, however, is generally under-predicted, which is linked to an over-prediction of the aerodynamic damping on the tower mode. Furthermore, the floater response in large sea states is influenced by the omission of viscous hydrodynamic drag forcing, which leads to an under-prediction of the wave excitation loads. A further investigation of the model limitations confirms these findings with respect to the tower mode damping and viscous drag loads, while the simplified approach to rotor-induced loads is found to provide remarkably accurate forcing results. Although a full design load basis evaluation with a state-of-the-art model must be carried out for the final design, the present results show the potential of applying simplified models in the preliminary design phase.
1 Introduction
The design of floaters for offshore wind turbines usually fol-lows three steps: conceptual design, basic design and detailed design. Within basic design, state-of-the-art models such as FAST, Bladed or HAWC2 are used to calculate time-domain loads under various design load cases. As described in Müller et al. (2018), load cases are an inherent part in the wind
Table 1.Main properties of the DTU 10 MW reference wind turbine.
Rated power (MW) Rated wind speed (m s−1) Wind regime Rotor diameter (m) Hub height (m)
10 11.4 IEC class 1A 178.3 119
the situations leading to critical design loading. Load cases consist of normal operation, extreme events, stand-still con-ditions and transient events such as startup, shutdown and fault conditions.
Conducting a full design load basis (DLB) analysis, con-sisting of all design load cases for a floating wind turbine de-sign for several concepts, is computationally expensive, es-pecially if they are carried out with time-domain numerical tools simulating at real-time CPU speed (i.e. a simulated-to-simulation ratio of 1). Faster models may thus be valuable in the conceptual design phase, where quick answers for re-sponse levels and load levels may affect the design at an early stage. Also the accuracy requirements may be relaxed and al-low for application of al-low-dimensional models enabling the application of optimization methods. Next, when the concept design is more refined, state-of-the-art models can be used in the design validation following current practice; and eventu-ally more advanced models can be used for detailed design tasks. For certification, loads analysis of the full set of design load cases according to recognized standards using state-of-the-art models is required.
The present study concerns the applicability of simplified models in the design of floaters for offshore wind turbines in the 10 MW class, in order to answer the following question: how can accurate results be obtained from simplified models for different load cases? The work is part of the Lifes50+ project where both a state-of-the-art FAST model Jurado et al., 2018b, c) and a simplified model (Pegalajar-Jurado et al., 2018a) have been developed.
The simplified model, QuLAF (Quick Load Analysis of Floating wind turbines), is based on the same principles as the QuLAF model of Schløer et al. (2018) for monopile-type offshore wind turbines. First, in Sect. 2, the wind turbine, controller and the floating substructure are briefly described. Details on the FAST model and the simplified QuLAF model are given in Sect. 3. In Sect. 4, a selection of load cases is pre-sented and the simulation setup described. Results of the sim-ulations are shown in Sect. 5, along with a discussion of the observed trends. In continuation of the main results, Sect. 6 presents an investigation of QuLAF’s limitations, focussing on how they affect the response of the structure. Lastly, some conclusions of the study are presented in Sect. 7.
2 Wind turbine and floating substructure
The floating wind turbine is the Technical University of Den-mark (DTU) 10 MW reference wind turbine (RWT) (Bak et al., 2013) mounted on the OO-Star Wind Floater Semi
10 MW, extensively described in Yu et al. (2018). Some of the main properties of the reference wind turbine are col-lected in Table 1.
The basic DTU wind energy controller is employed (Hansen and Henriksen, 2013), which consists of a controller for the partial load region (i.e. operation below rated wind speed) and one for the full load region (i.e. operation above rated wind speed), and a mechanism that smoothly switches between these around rated wind speed. The pole-placement method, described in Hansen et al. (2005), was used to tune the controller to avoid pitch instability, as detailed in Yu et al. (2018).
The floating substructure, developed by Olav Olsen AS (http://www.olavolsen.no, last access: 29 April 2019) is made of post-tensioned concrete and consists of a central col-umn and three outer colcol-umns mounted on a star-shaped pon-toon with three legs. Each outer column is connected to the seabed by a catenary mooring line with a suspended clump weight. Some of the main properties of the floater configu-ration are stated in Table 2 and further information can be found in Yu et al. (2018).
3 Numerical models
3.1 State-of-the-art model
A FAST (Jonkman and Jonkman, 2016) time-domain model of the DTU 10 MW RWT mounted on the OO-Star Wind Floater Semi 10 MW has been developed in the LIFES50+ and reported in Jurado et al. (2018b) and Pegalajar-Jurado et al. (2018c). A semi-flexible approach has been adapted in the modelling work to capture some of the float-ing substructure flexibility by extendfloat-ing the definition of the tower to still water level (SWL) (Pegalajar-Jurado et al., 2018b). Two tower modes are included in each direction (fore–aft and side–side).
Table 2.Main properties of the OO-Star Semi floating substructure.
Type Material Draft (m) Freeboard (m) Displaced volume (m3) Floating substructure mass (kg)
Semisubmersible Post-tensioned 22.00 11.00 2.351·104 2.171×10⁷ concrete
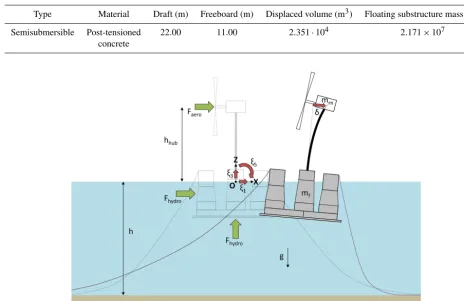
Figure 1.Sketch of the floating wind turbine as seen by the QuLAF model from Pegalajar-Jurado et al. (2018a).
mooring line model that allows the use of multi-segmented mooring lines.
3.2 The simplified model: QuLAF
A simplified model of the floater–turbine configuration was implemented in terms of the QuLAF model. The modelling concept and philosophy are described in Schløer et al. (2018) for bottom-fixed substructures and in Pegalajar-Jurado et al. (2018a) for floating wind turbines; see also Lemmer et al. (2016). The main purpose of QuLAF is to provide quick answers about design loads and natural frequencies in the pre-design phase, where many design variations are tried be-fore the first basic design is chosen. The simplicity and ef-ficiency are obtained by inclusion of only four degrees of freedom (DoF), linearization of the equations of motion, pre-computation of aerodynamic rotor forcing and damping, and solution of the equations of motion in the frequency do-main. As a result of these simplifications, the computational speed in QuLAF is approximately 2000 times faster than real time (after pre-processing of the aerodynamic loads), whereas standard time-domain models have a simulated-to-real-time ratio around 1.
The four degrees of freedom are the platform surge, heave and pitch and the modal amplitude of the first tower mode,
which is illustrated in Fig. 1. Thus, QuLAF solves only a 2-D problem and is restricted to aligned wind and waves. For the load predictions, this means that only the fore–aft moments and forces can be considered. The linear equations of motion in the frequency domain are written in QuLAF as Eq. (1), considering the three in-plane floater degrees of freedom and the flexible tower mode as a fourth degree of freedom.
h
−ω2[Mstr+A(ω)]+iω[Brad(ω)
+Bvisc+Baero+Bstr]+Chyd+Cmoor+Cstrxˆ
= ˆFaero+ ˆFhyd (1)
Here,ωis the angular frequency,x= [ξ1, ξ3, ξ5, δ]T is the
response vector,Mstris the structural mass matrix,Bstris the
structural damping,Cstr is the structural stiffness, andFhyd
is the hydrodynamic loads. The aerodynamic loadsFaeroare
pre-computed with fixed nacelle, rigid blades and active con-trol. The matricesA(ω),Brad(ω) andChyd are the
hydrody-namic added mass, hydrodyhydrody-namic radiation damping and the hydrostatic stiffness, which are obtained from the WAMIT solver. The mooring restoring matrixCmooris extracted from
Bvisc is represented by a linearized damping matrix under
the assumptions of inertia load dominance and small am-plitude motion. More details are given in Pegalajar-Jurado et al. (2018a). It should be noted that damping on the moor-ing lines is not included in QuLAF, but for floaters where this is important, this can be included in the global damping matrix.
A state-of-the-art model, which in this study is the FAST model, is used to provide inputs to QuLAF, such as the sim-plified structural tower modelling, the aerodynamic forcing and damping, and the linearized mooring matrix. This means that QuLAF contains phase information, as time series of pre-computed aerodynamic loads and free-surface elevation are input to the model. As a consequence, time series of the results are available for comparison to time-domain models and for further post-processing, such as rainflow counting.
The linear representation of the aerodynamic damping
Baero is obtained from step tests in steady wind, where the
wind speed goes from the cut-in to the cut-out. This means that for every step to a new wind speed, the structure de-cays to a new equilibrium position. These “dede-cays” allow an equivalent linear damping ratio to be extracted and the prin-ciple is based on the work done by Schløer et al. (2016) and Schløer et al. (2018). Schafhirt and Muskulus (2018) made a detailed analysis of this approach and found that although the aero-elastic damping process is not linear, it can be success-fully modelled by a linear damping model. In QuLAF, the approach is extended to multiple degrees of freedom. These decay tests are carried out in the FAST model in calm water and with the wind turbine controller active, for each degree of freedom with all the other degrees of freedom locked and rigid blades. This allows the floating wind turbine to be a one-degree-of-freedom spring-mass-damper system in each degree of freedom, where the horizontal position of the hub is of interest.
If all sources of hydrodynamic and structural damping are disabled, the aerodynamic damping is the only responsible for the decay of the hub motion, and it can be extracted from the time series. For simplicity, the turbulence intensity was put to zero to limit the number of decay tests.
3.3 Summary of model limitations
QuLAF solves a linear and reduced version of the equations of motion typically solved in a full state-of-the-art model, to allow for the linearization and fast solution in the fquency domain. Prior to the present study, a smaller set of re-sults with the QuLAF model has been presented in Pegalajar-Jurado et al. (2018a). In Pegalajar-Pegalajar-Jurado et al. (2018a) and the present results, the main limitations of QuLAF were sum-marized as follows:
a. The first limitation is an under-prediction of the wave excitation loads for strong sea states due to the omission of viscous hydrodynamic drag forcing. This leads to an
under-prediction of surge, nacelle acceleration and pitch responses for strong sea states.
b. Another limitation is the difficulty to capture the com-plexity of aerodynamic loads around rated wind speed, where the controller switches between the partial-load (torque control; fixed blade pitch) and full-load control regions (varying blade pitch; fixed target shaft speed).
c. The final limitation is an under-predicted nacelle accel-eration due to over-predicted aerodynamic damping for the tower mode motion (at 0.682 Hz). Since the damp-ing of the decay test, used to extract the aerodynamic damping, is based on a clamped tower with rigid blades, the natural frequency of this setup (0.51 Hz) is lower and thus leads to a larger damping than that at the cou-pled tower frequency in QuLAF (0.682 Hz). In compari-son, the full FAST model has a coupled tower frequency of 0.746 Hz when moored and with flexible blades.
4 Load cases
The present study shows the mapping of accuracy be-tween the simplified model, QuLAF (Pegalajar-Jurado et al., 2018a), and the FAST model for a subset of critical load cases, which are selected based on the findings from Müller et al. (2018). The selected load cases included fatigue dur-ing normal operation (DLC 1.2), ultimate loads durdur-ing power production in severe sea states (DLC 1.6) and ultimate loads when the turbine is parked during a 50-year storm event (DLC 6.1). Further, for the present study of analysing the ap-plicability of QuLAF in the design phase, it was decided to add two additional design load cases, namely ultimate loads during power production in extreme turbulence (DLC 1.3) and ultimate loads during a transient event triggered by a loss of electrical network connection (DLC 2.1). DLC 1.3 was considered in order to fully evaluate the results of QuLAF by comparing with the baseline load case (DLC 1.2) and the ex-treme sea state load case (DLC 1.6). DLC 2.1 was included to see how well QuLAF handles a transient event.
Table 3.Selection of design load cases. Note that the comparative study was limited to aligned wind–wave conditions only, due to the restriction of QuLAF to planar motion. Each simulation had a length of 90 min, where the first 30 min were discarded to remove transient response in the time-domain model.
Load case Description Environmental conditions Number of
Wind Waves simulations
DLC 1.2 Power production during normal operation
NTM
Vin< Vhub< Vout
NSS joint prob. Distribution of
Hs, Tp, Vhub
(7 wind speeds)× (3 wave periods)× (6 seeds)
DLC 1.3 Power production during extreme turbulence
ETM
Vin< Vhub< Vout
NSS
Hs=(Hs|Vhub)
(7 wind speeds)× (3 wave periods)× (6 seeds)
DLC 1.6 Power production during severe sea states
NTM
Vin< Vhub< Vout
SSS
Hs=Hs,SSS
(7 wind speeds)× (3 wave periods)× (6 seeds)
DLC 2.1 Power production with grid loss
NTM
Vin< Vhub< Vout
NSS
Hs=(Hs|Vhub)
(7 wind speeds)× (3 wave periods)× (4 seeds)
DLC 6.1 Parked in extreme wind and sea state
EWM
Vhub=Vref,50 yr
ESS
Hs=Hs,50 yr
(1 wind speed)× (3 wave periods)× (6 seeds)
it was decided to use the joint probability distribution (NSS). In agreement with the project design basis (Krieger et al., 2015), each wind speed in each load case had three realiza-tions of the wave spectrum peak period.
Six different wind and wave seeds were simulated for each environmental condition, with the only exception of DLC 2.1 where four seeds were deemed sufficient, as the maximum loads in this case are governed by the transient shutdown event. For each environmental condition, the characteristic value is the mean of the maximum values of the different realizations (seeds) and is used for evaluation. Furthermore, a simulation time of 5400 s with the same length of turbu-lent wind field was used for all the load cases including 1800 s run-in time to remove any transient response in the time-domain model. This run-in time corresponds to approx-imately nine surge periods, which was deemed acceptable for the lowest sea state, where the transient influence is highest.
5 Results
The results involve a fatigue limit state (FLS) analysis and a ULS analysis, each displaying the design load and response values for different parts of the floating wind turbine, i.e. na-celle acceleration, tower-base bending moment, surge, heave and pitch motion of the floater.
In general, the design load and response values for both the QuLAF model and the FAST model are presented as a function of wind speed. Thus, the wave heights and peri-ods were chosen according to the wind speed, as specified in Table 3 and in Krieger et al. (2015). In addition, to better
compare the load prediction of the two models, correspond-ing quantile–quantile (Q–Q) plots are also presented. Fur-thermore, at the end of Sect. 5, box plots of the response peaks are used to describe the spread and median of the ra-tio between the damage-equivalent or maximum values from QuLAF and FAST.
5.1 FLS study
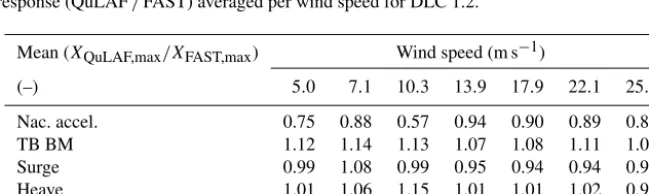
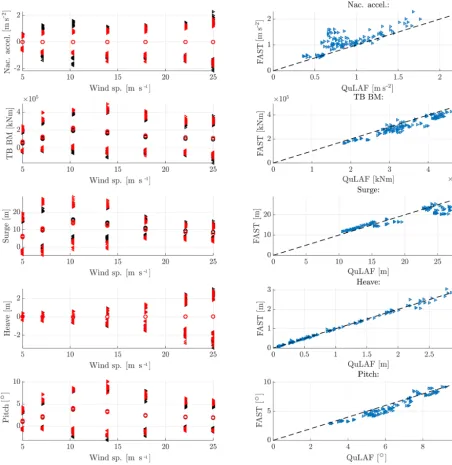
First, we present the results of the fatigue evaluation study. In the analysis, the damage-equivalent loads (DELs) are pre-sented, computed from each load time series by the rainflow counting method. Although the nacelle acceleration is not a load, it was analysed with the rainflow counting method and presented as DEL, since internal loads in the nacelle may be directly related to the nacelle acceleration. The fatigue DEL nacelle acceleration and tower-base bending moment for FAST and QuLAF are shown in Fig. 2 as a function of wind speed, together with the correspondingQ–Qplot.
These results are followed by Table 4 presenting the DEL values, where the weighting of the different wind speeds and wave periods according to the assumed Weibull distribution and probabilities (Krieger et al., 2015) has been taken into account.
Figure 2.Fatigue damage-equivalent nacelle acceleration and bending moment at the tower base for DLC 1.2.
over-estimated aerodynamic damping on the tower vibrations in QuLAF). This may also explain the distinct deviation at 10.3 m s−1, which is highly affected by the controller tran-sition. The largest DEL for both models is observed at the strongest environmental state, i.e. 25 m s−1, but with a 20 % under-prediction in QuLAF. However, the largest DEL con-tribution is associated with rated conditions when the proba-bilities from the Weibull distribution are taken into account.
The tower-base bending moment, on the other hand, shows an overall good agreement between the two models but with a slight under-prediction of QuLAF just above rated condi-tions and at cut-out. A conclusion that can also be observed in Table 4 for the total Weibull-weighted DEL. It is seen that, while a disagreement is seen for the nacelle acceleration DEL (an under-prediction of 26 %), the tower-base bending mo-ment agrees well, with an under-prediction of 5 %.
5.2 ULS study for operational load cases
We now proceed with the ULS simulation study for the op-erational load cases. A total of 126 1 h simulations (7 wind speeds × 3 wave periods× 6 seeds) were carried out for each of the two models. Although DLC 1.2 (power produc-tion in normal condiproduc-tions) is intended for fatigue analysis, we present ULS results from this load case as well, to form a baseline for DLC 1.3 and DLC 1.6 with stronger turbulence and waves, respectively.
Figure 3 shows the nacelle acceleration, tower-base bend-ing moment and floater motion across the various wind speeds for the two models. Overall, there is a good agree-ment between the models, especially for the floater motion
Table 4. FAST and QuLAF probability-weighted DEL results, based on probabilities from the Weibull distribution of NSS (Krieger et al., 2015).
FAST QuLAF Ratio
DEL: nac. accel. (m s−2) 1.86 1.38 0.74 DEL: TB BM (kNm) 2.29×10⁵ 2.18·105 0.95
(5 % mean deviation of the max. values), even at large val-ues of response, and it is seen that all but the heave motion are wind-dominated. Similarly to the FLS study, the nacelle acceleration is under-predicted by QuLAF and the largest value is obtained at 25 m s−1with an 11 % under-prediction, as seen in Table 5. The largest under-prediction is observed around rated conditions and may be linked to limitation B. It is also seen that QuLAF also over-predicts the tower-base bending moment for the largest values obtained around rated conditions by 7 %–13 %.
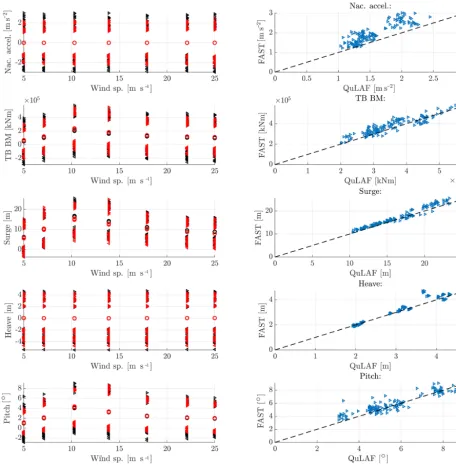
We can now turn to DLC 1.3, which consists of the same number of simulations as DLC 1.2 but now with extreme tur-bulence. In Fig. 4, the nacelle acceleration, tower-base bend-ing moment and planar motions of the floater are shown as a function of mean wind speed together with the corresponding Q–Qplot.
Figure 3.Response to DLC 1.2 for FAST and QuLAF. Left: min., max. and mean values for every realization as a function of wind speed. Right: maximum values for FAST as a function of the corresponding maximum values in QuLAF.
Table 5.Ratio of max. response (QuLAF/FAST) averaged per wind speed for DLC 1.2.
Mean (XQuLAF,max/XFAST,max) Wind speed (m s−1)
(–) 5.0 7.1 10.3 13.9 17.9 22.1 25.0 Nac. accel. 0.75 0.88 0.57 0.94 0.90 0.89 0.89
TB BM 1.12 1.14 1.13 1.07 1.08 1.11 1.00
Surge 0.99 1.08 0.99 0.95 0.94 0.94 0.93
Heave 1.01 1.06 1.15 1.01 1.01 1.02 0.99
Figure 4.Response to DLC 1.3 for FAST and QuLAF. Left: min., max. and mean values for every realization as a function of wind speed. Right: maximum values for FAST as a function of the corresponding maximum values in QuLAF.
turbulence enhances the relative surge and pitch response in QuLAF. This can be seen as a large over-prediction in surge and pitch at 7.1 m s−1of 22 % and 13 %, respectively, while an 44 % under-prediction of the nacelle acceleration is also observed. The largest nacelle acceleration is obtained at rated conditions with a severe under-prediction of 47 %, as seen in Table 6. As for DLC 1.2, the tower-base bending moment shows the largest load at rated conditions, with the same level of over-prediction of 11 %. For the heave motion, the responses from the two models agree very well (mean devia-tion of 3 %) and are largest at cut-out.
Figure 5.Response to DLC1.6 for FAST and QuLAF. Left: min., max. and mean values for every realization as a function of wind speed. Right: maximum values for FAST as a function of the corresponding maximum values in QuLAF.
Table 6.Ratio of max. response (QuLAF/FAST) averaged per wind speed for DLC 1.3.
Mean (XQuLAF,max/XFAST,max) Wind speed (m s−1)
(–) 5.0 7.1 10.3 13.9 17.9 22.1 25.0 Nac. accel. 0.88 0.66 0.53 0.80 0.91 0.93 0.87
TB BM 1.13 1.14 1.11 1.09 1.08 1.14 1.04
Surge 1.10 1.22 1.03 1.07 0.94 0.93 0.92
Heave 1.03 1.10 1.04 0.98 1.01 1.02 1.00
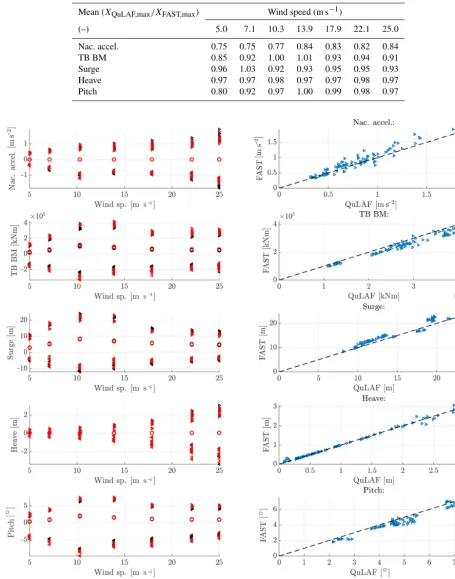
Table 7.Ratio of max. response (QuLAF/FAST) averaged per wind speed for DLC1.6.
Mean (XQuLAF,max/XFAST,max) Wind speed (m s−1)
(–) 5.0 7.1 10.3 13.9 17.9 22.1 25.0 Nac. accel. 0.75 0.75 0.77 0.84 0.83 0.82 0.84
TB BM 0.85 0.92 1.00 1.01 0.93 0.94 0.91
Surge 0.96 1.03 0.92 0.93 0.95 0.95 0.93
Heave 0.97 0.97 0.98 0.97 0.97 0.98 0.97
Pitch 0.80 0.92 0.97 1.00 0.99 0.98 0.97
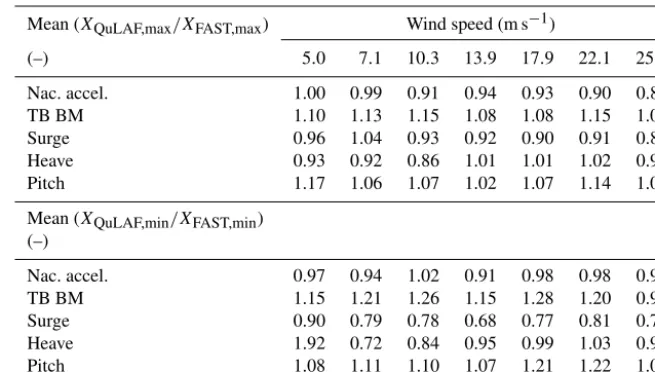
Table 8.Ratio of max. and min. response (QuLAF/FAST) averaged per wind speed for DLC 2.1.
Mean (XQuLAF,max/XFAST,max) Wind speed (m s−1)
(–) 5.0 7.1 10.3 13.9 17.9 22.1 25.0 Nac. accel. 1.00 0.99 0.91 0.94 0.93 0.90 0.88
TB BM 1.10 1.13 1.15 1.08 1.08 1.15 1.06
Surge 0.96 1.04 0.93 0.92 0.90 0.91 0.89
Heave 0.93 0.92 0.86 1.01 1.01 1.02 0.99
Pitch 1.17 1.06 1.07 1.02 1.07 1.14 1.09
Mean (XQuLAF,min/XFAST,min) (–)
Nac. accel. 0.97 0.94 1.02 0.91 0.98 0.98 0.91
TB BM 1.15 1.21 1.26 1.15 1.28 1.20 0.93
Surge 0.90 0.79 0.78 0.68 0.77 0.81 0.77
Heave 1.92 0.72 0.84 0.95 0.99 1.03 0.99
Pitch 1.08 1.11 1.10 1.07 1.21 1.22 1.05
Compared to DLC 1.2, the nacelle acceleration and tower-base bending moment are now more wave-dominated, as the max response values are more uniform over the wind speeds due to the fact that severe waves are the same across all wind speeds. It is seen that nacelle acceleration is generally under-predicted up to 25 %, which may be due to limitations A and C. However, the largest tower-base bending moments, ob-tained at rated wind, are matched very well by QuLAF. This good match is unexpected, given the observed discrepancies for extreme wave and extreme wind situations for the present floater, and it is probably due to a cancellation effect.
The floater motions, with respect to surge and heave, show a good agreement around rated conditions for surge with a 7 %–8 % under-prediction and overall a very good match for heave, where an under-prediction of 3 % is observed. The consistent under-prediction of the surge response by QuLAF, seen in Table 7, is linked to limitation A (omission of the viscous hydrodynamic drag forcing) but could be a mix of A and C (QuLAF over-estimates the aerodynamic damping on the tower vibrations) around rated conditions. Furthermore, it can be observed for the surge motion that the combination of larger waves and under-prediction in DLC 1.2 and DLC 1.3 compensates the deviation between QuLAF and FAST for the largest responses, which might be linked to limitation A.
5.3 ULS study for grid loss and parked conditions
We now proceed with the ULS simulation study for grid loss and parked conditions. This load case is included to demon-strate that, even for a transient event, the frequency-domain approach is applicable. In all simulations, an emergency stop at t=3600 s was simulated during operation with normal turbulence and normal sea state. A total number of 84 simu-lations (7 wind speeds×3 wave periods×4 seeds) are con-sidered, where only four seeds are included as the transient event governs the maximum loads and responses.
The nacelle acceleration, tower-base bending moment and planar motions of the floater are shown in Fig. 6. Overall, we see that QuLAF does a good job in handling the transient load case when compared to the FAST results. Also it can be seen that the load and response variation trends are very similar to DLC 1.2, and from Table 8 the deviation levels on the maximum values are of the same magnitude.
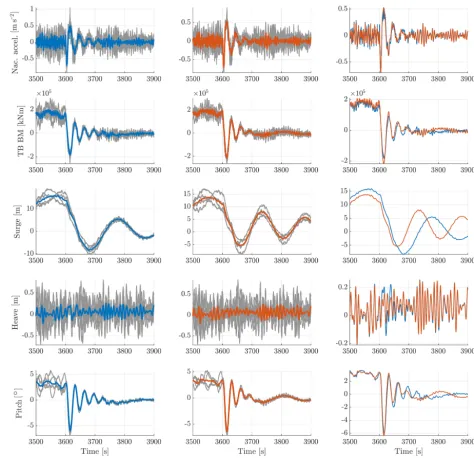
By inspection of the left column of Fig. 6, the negative ex-treme values are of the same importance as the exex-treme pos-itive in this transient load case. Thus, the deviation levels on the minimum values are also included in Table 8. Generally, it is seen that higher deviation levels are obtained for the min-imum response ratios compared to the maxmin-imum. The largest deviations are seen for the surge motion for wind speeds greater than 5 m s−1. This is further investigated by exami-nation of the corresponding time series, as seen in Fig. 7. We chose the case with a mean wind speed of 13.9 m s−1, as it is close to rated wind speed where the largest bending moments occur. At this wind speed, the time series for the 12 simula-tions (3 wave periods×4 seeds) are shown in grey. Further, their average is shown in blue and red for FAST (first col-umn) and QuLAF (second colcol-umn), respectively. The right column shows a direct comparison of the averaged signals.
Figure 7.Zoomed time series of DLC 2.1 with a mean wind speed of 13.9 m s−1for FAST and QuLAF. The average responses are obtained based on the four different wave and wind seeds and three realizations of the peak period.
at that operating point but differs from the stiffness matrix at the equilibrium position. Thus, in QuLAF, the system decays with a stiffer mooring system, which is consistent with the shorter surge natural period observed in Fig. 7. This is an in-herent limitation of frequency-domain models, which do not allow the system properties to change during the simulation. We can now turn to DLC 6.1 which describes the turbine in parked condition with a mean wind speed of 44 m s−1and with extreme sea state. This load case consists of 18 sim-ulations (1 wind speed × 3 wave periods × 6 seeds). In Fig. 8, the nacelle acceleration, tower-base bending moment
Table 9.Ratio of max. response (QuLAF/FAST) averaged per wind speed for DLC 6.1.
Mean (XQuLAF,max/XFAST,max) Wind speed (m s−1)
(–) 44.0
Nac. accel. 0.72
TB BM 0.76
Surge 0.95
Heave 0.97
Figure 8.Response to DLC 6.1 for FAST and QuLAF. Left: min., max. and mean values for every realization as a function of wind speed. Right: maximum values for FAST as a function of the corresponding maximum values in QuLAF.
and planar motions of the floater are shown. Furthermore, Table 9 shows the deviation values of the two models.
Overall, the results are similar to DLC 1.6 at 5 m s−1, since the thrust level is nearly the same for that case and both load cases utilize the extreme sea state. The nacelle acceleration, tower-base bending moment and pitch motion all show an under-prediction by QuLAF which can be explained by limi-tation of A, regarding the missing viscous effects. Surge and heave, on the other hand, are well matched with deviations of 5 % and 3 %, respectively.
5.4 Summary of ULS study
Figure 9.Population of max. values for each of the five load cases.
maximum values for each seed associated with the specific environmental condition.
It can be seen that the ultimate nacelle accelerations are governed by the extreme sea state and thus by DLC 1.6 and DLC 6.1. Both models agree on this conclusion but with an under-prediction of the values in QuLAF due to limitation A. The ultimate tower-base bending moments and pitch motion are obtained in DLC 1.6 and DLC 1.3, respectively, and both models agree well on the values. Similarly, the largest heave motions are generally well matched by QuLAF, since it is al-ways dominated by waves and the hydrostatics are modelled the same way in both models; hence, the largest response is obtained in the extreme sea states. The largest surge motions are obtained in DLC 1.3 with an over-prediction of the re-sponse in QuLAF, likely due to limitations B and C, but with a slight under-prediction in all other load cases.
In order to investigate whether the models predict the same design-driving cases, the rankings of the eight highest
maxi-mum values of the nacelle acceleration, tower-base bending moment and planar motions with their corresponding load case simulation are presented in Fig. 10.
The load levels are generally in good agreement. Looking at the nacelle acceleration, the values are under-predicted by QuLAF but the two models agree on the same governing load cases. For the tower-base bending moment, the two models show a agreement in both maximum values (up to 6 % de-viation) and load cases, where the maximum tower bending moments for both models are obtained in severe sea states around rated wind speed. Generally, both models predict that the highest surge and pitch motions are obtained in extreme turbulence just below rated wind speed but with a slight over-prediction in QuLAF.
Figure 10.Rankings of the eight highest max. values of each signal and corresponding load case simulations for FAST and QuLAF. The text in each box follows the pattern of design load case, mean wind speed and then wave period, i.e.dlc_wsp_tp.
the two models. Differences exist mainly in the viscous loads and mooring stiffness, but the effect of these on heave is less important.
6 Limitation study
Following the main results from the study, the limitations of the QuLAF model (Sect. 3.3) are now investigated further with the purpose to assess their impact on the response.
6.1 Omission of viscous drag forcing
Figure 11.Response to DLC 1.6 (without viscous drag) for FAST and QuLAF. Left: min., max. and mean values for every realization as a function of wind speed. Right: maximum values for FAST as a function of the corresponding maximum values in QuLAF.
radiation damping, which is very low at the heave natural frequency and is therefore not sufficient to avoid unphysi-cal resonant response in heave. In FAST, on the other hand, the dynamic representation of the mooring system introduces both viscous damping and non-linear stiffness that limit the resonant response in heave. Figure 11 shows the results. A good match in the nacelle acceleration, tower-base bending moment and all floater motions is now seen. By compari-son to Fig. 5 (DLC 1.6 with viscous effects in FAST), we clearly see the effect of the omission of viscous drag forcing in QuLAF.
Limitation A is thus confirmed and can explain the under-prediction of the nacelle acceleration, tower-base bending moment and floater motions in QuLAF for the load cases where the waves are dominating, i.e. DLC 1.6 and DLC 6.1.
6.2 Simplified rotor-induced forcing and damping
aero-Figure 12.Free body diagram of the rotor.
dynamic forcing for surge, pitch and tower deflection in the full FAST model setup and the response-locked loads plus damping setup, which is utilized in QuLAF.
We extract the aerodynamic rotor loads from the full FAST computation and compare them to the aerodynamic rotor loads applied in QuLAF. This is done with basis in the shaft loads from FAST, which are the next subtracted iner-tial and gravitational effects. Based on a free body diagram (see Fig. 12) the purely aerodynamic rotor loads in the full FAST computation are calculated as
FAx,full=FSx+Mrhx¨hub, (2)
τA,full=τS+Mrhg|BA|cosθhub+Irhθ¨hub+Mrhx¨hub
|BA|sinθhub+Mrhz¨hub|BA|cosθhub. (3)
Here,A is the point of output for the shaft loads in FAST, B is the position of the rotor centre of gravity, and|BA|is the distance fromA toB. The shaft forceFS is defined in
its own coordinate system and consists of a normal and tan-gential shaft force. Hence, the globalx component is deter-mined from vector transformation. The angleθhubis the sum
of the fixed tilt angle and the instantaneous hub deflection an-gle. The rotor and hub mass and the mass moment of inertia around pointAare denotedMrhandIrh, respectively. Lastly, xhub andzhub are the horizontal and vertical translations of
the hub centre of gravity.
The same equations withx¨hub,z¨hub,θ¨hub=0 were applied
in the original response-locked FAST calculations for the ex-traction of the loads for QuLAF. We will refer to the latter as the simplified method.
In QuLAF, the extracted forcing (for a response-locked na-celle) and damping are applied in the surge, pitch and tower deflection degrees of freedom as described in
Pegalajar-Jurado et al. (2018a):
Fsurge,simple=FAx,simple−B11ξ˙1, (4)
Fpitch,simple=FAx,simplehhub+τA,simple−B55ξ˙5, (5)
Ftower,simple=FAx,simpleφhub+τA,simple ∂φhub
∂z −Btowerα.˙ (6)
Here,hhubis the hub height, the mode shape deflection
eval-uated at the hub isφhub, andB11,B55andBtowerare the
aero-dynamic damping terms for surgeξ1, pitchξ5and tower
de-flectionαdegrees of freedom, respectively.
The loads are applied in the undeflected point (B), which is consistent with the linearization and with further neglect of theFSt|BA|moment correction fromAtoB.
We now compare these to the similar forcing based on the extracted loads from the full FAST computations, which in-clude damping implicitly:
Fsurge,full=FAx,full (7)
Fpitch,full=FAx,fullhhub+τA,full (8)
Ftower,full=FAx,fullφhub+τA,full ∂φhub
∂z . (9)
The combined comparison of both forcing and damping in the simplified approach is needed since the damping cannot be extracted as an isolated component from the full FAST computations. To focus on the loads, the full FAST response results forξ˙1,ξ˙5andδ˙were applied in the calculation of the
damping contribution inFsimple.
Figures 13 and 14 show the extracted aerodynamic forcing applied in the surge, pitch and tower deflection degrees of freedom together with the rotor speed and blade pitch angle for the case of extreme turbulence (DLC 1.3). The two cases are conducted for wind speeds of 10.3 and 13.9 m s−1, just below and above rated wind speed in order to assess the effect of the switching between the control regions.
It is observed that the applied aerodynamic forcing in the surge, pitch and tower deflection degrees of freedom below rated wind speed is matched well. From the blade pitch an-gle in Fig. 13, it can be seen that the response-locked com-putations switch significantly more between the control re-gions compared to the full FAST computations. This is to be expected, as the fixed nacelle configuration will feel larger peaks of the wind speed compared to the full FAST compu-tations. Then, looking at the full FAST computations, a slight over-prediction of the aerodynamic forcing term in surge, pitch and tower is seen, but the maximum values match well with the full FAST computations.
Figure 13.Extracted aerodynamic forcing applied in the surge, pitch and tower deflection degrees of freedom and turbine operational data for DLC 1.3 with 10.3 m s−1mean wind speed. Left: time series outline. Middle: corresponding power density spectrum (PDF). Right: peak values (sorted) for the full FAST computations as a function of the corresponding maximum values in the simplified method.
6.3 Over-predicted tower damping
Finally, limitation C, regarding the extraction of aerodynamic damping, is investigated. Figure 15 shows the aerodynamic damping ratio as a function of the natural frequency of the tower. It is observed that the aerodynamic damping decreases with tower frequency. Since the aerodynamic damping in QuLAF is extracted for a clamped tower with rigid blades, i.e. at a lower natural frequency compared to the full FAST model, the aerodynamic damping for the tower mode motion will be over-predicted, leading to a under-prediction of the tower response and nacelle acceleration in QuLAF. Also the under-predicted tower frequency in QuLAF relative to FAST (0.682 Hz vs. 0.746 Hz) will lead to smaller accelerations for the same motion amplitude.
Limitation C is thus confirmed and can explain the large under-prediction of the nacelle acceleration in the FLS study and in DLC 1.2 and DLC 1.3 of the ULS study.
7 Conclusions
Based on a selected subset of critical load cases, the accu-racy of the simplified model QuLAF for different load cases has been investigated through comparison to a FAST state-of-the-art model. The study was based on the OO-Star Wind Floater Semi 10 MW floater and the DTU 10 MW reference wind turbine. The model accuracy was assessed both in terms of an FLS analysis and a ULS analysis.
Figure 14.Extracted aerodynamic forcing applied in the surge, pitch and tower deflection degrees of freedom and turbine operational data for DLC 1.3 with 13.9 m s−1mean wind speed. Left: time series outline. Middle: corresponding power density spectrum (PDF). Right: peak values (sorted) for the full FAST computations as a function of the corresponding maximum values in the simplified method.
Figure 15.Dependency of aerodynamic damping on tower natural frequency forW=15 m s−1.
stronger waves would lead to an under-prediction. However, the largest load was obtained at 10.3 m s−1in DLC 1.6, and here the effects compensated each other and gave a good match between the two models. Regarding the platform mo-tions, the largest surge responses were observed in DLC 1.3
and DLC 1.6 with a 3 % over-prediction and 11 % under-prediction, respectively. The largest heave motions were gen-erally well matched by the two models and presented highest values in the ESS cases. Further, the ultimate pitch responses were obtained in DLC 1.3 and DLC 1.6 (both at rated con-ditions) and within 4 % deviation. Lastly, for the emergency stop case of DLC 2.1, comparisons at the time series level showed that QuLAF is able to reproduce a transient event.
re-sults at two wind speeds, there seems to be no strong limita-tion in this simple approach to rotor loads, even for a config-uration with multiple degrees of freedom.
Despite its limitations, QuLAF has been found to be a quite accurate load and response prediction tool for the five aligned wind–wave load cases (DLC 1.2, 1.3, 1.6, 2.1 and 6.1), especially for tower-base bending moments, heave and pitch motions. The model can therefore be used as a tool to explore the design space in the preliminary design stages of a floating platform for offshore wind. The model can quickly give an estimate of the main natural frequencies, re-sponse and loads for a wide range of environmental condi-tions, which makes it useful for optimization loops. A full aero-hydro-servo-elastic model is still necessary to assess the performance in a wider range of environmental conditions, including non-linearities, fault conditions and real-time con-trol.
Data availability. The FAST model is publicly available, as de-tailed in Pegalajar-Jurado et al. (2018c) and Pegalajar-Jurado et al. (2018b). The QuLAF source code is not public due to possible com-mercialization in the future. The data used in figures and tables can be obtained by contacting the first author.
Author contributions. FJMA is the main responsible person for developing the comparison study, thus setting up the load cases, carrying out the simulations, analysing the results and preparing the manuscript. APJ and MB provided inputs to the limitations study and to the first and second versions of the manuscript.
Competing interests. The authors declare that they have no con-flict of interest.
Acknowledgements. This work is part of the LIFES50+ project (http://lifes50plus.eu, last access: 29 April 2019) and the research leading to these results has received funding from the European Union’s Horizon 2020 research and innovation programme (grant agreement no. 640741). Further support has been granted by Inno-vation Fund Denmark as part of the FloatStep project (grant no. 8055-00075A). The support and discussions with Frank Lemmer, Kolja Müller, Yu Wei (University of Stuttgart), Denis Martha (Ram-bøll) and Andreas Manjock (DNV-GL) are gratefully acknowl-edged.
Financial support. This research has been supported by the Euro-pean Union’s Horizon 2020 programme (grant no. 640741). Further support has been granted by Innovation Fund Denmark as part of the FloatStep project (grant no. 8055-00075A).
Review statement. This paper was edited by Gerard J. W. van Bussel and reviewed by Tor Anders Nygaard, Maurizio Collu, and one anonymous referee.
References
Bak, C., Zahle, F., Bitsche, R., Kim, T., Yde, A., Henriksen, L., Natarajan, A., and Hansen, M.: Description of the DTU 10 MW reference wind turbine, Tech. rep., No. I-0092, DTU Wind En-ergy, 2013.
Hansen, M. and Henriksen, L.: Basic DTU Wind Energy controller, Tech. rep., No. E-0028, DTU Wind Energy, 2013.
Hansen, M., Hansen, A., Larsen, T., Øye, S., Sørensen, P., and Fuglsang, P.: Control design for a pitch-regulated, variable-speed wind turbine, Tech. rep., No. Risø-R-1500(EN), Risø National Laboratory, 2005.
IEC: 61400-3: Wind turbines – Part 3: Design Requirements for Offshore Wind Turbines, International Electrotechnical Commi-sion, available at: https://webstore.iec.ch/publication/5446 (last access: 29 April 2019), 2009.
Jonkman, J. and Jonkman, B.: NWTC Information Portal (FAST v8), available at: https://nwtc.nrel.gov/FAST8 (last access: 29 April 2019), 2016.
Krieger, A., Ramachandran, G., Vita, L., Gómez-Alonso, G., Berque, J., and Aguirre, G.: LIFES50+ D7.2: Design basis, Tech. rep., DNV-GL, 2015.
Lee, C. and Newman, J.: WAMIT, available at: http://www.wamit. com/ (last access: 29 April 2019), 2016.
Lemmer, F., Müller, K., Pegalajar-Jurado, A., Borg, M., and Bred-mose, H.: LIFES50+ D4.1: Simple numerical models for up-scaled design, Tech. rep., University of Stuttgart, 2016. Müller, K., Faerron-Guzman, R., Borg, M., and Manjock, A.:
LIFES50+ D7.7: Identification of critical environmental condi-tions and design load cases, Tech. rep., University of Stuttgart, 2018.
Pegalajar-Jurado, A., Borg, M., and Bredmose, H.: An effi-cient frequency-domain model for quick load analysis of float-ing offshore wind turbines, Wind Energ. Sci., 3, 693–712, https://doi.org/10.5194/wes-3-693-2018, 2018a.
Pegalajar-Jurado, A., Bredmose, H., Borg, M., Straume, J., Landbø, T., Andersen, H., Yu, W., Müller, K., and Lemmer, F.: State-of-the-art model for the LIFES50+ OO-Star Wind Floater Semi 10 MW floating wind turbine, J. Phys. Conf. Ser., 1104, 012024, https://doi.org/10.1088/1742-6596/1104/1/012024, 2018b. Pegalajar-Jurado, A., Madsen, F., Borg, M., and Bredmose, H.:
LIFES50+ D4.5: State-of-the-art models for the two LIFES50+ 10 MW floater concepts, Tech. rep., Technical University of Den-mark, 2018c.
Schafhirt, S. and Muskulus, M.: Decoupled simulations of offshore wind turbines with reduced rotor loads and aerodynamic damp-ing, Wind Energ. Sci., 3, 25–41, https://doi.org/10.5194/wes-3-25-2018, 2018.
monopile-type offshore wind turbine substructures, Wind Energ. Sci., 3, 57–73, https://doi.org/10.5194/wes-3-57-2018, 2018.