ISSN Online: 2327-509X ISSN Print: 2327-5081
DOI: 10.4236/jbm.2018.612009 Dec. 27, 2018 88 Journal of Biosciences and Medicines
The Effect of a
High-Frequency-Hearing-Threshold Weighted
Value on the Diagnosis of
Occupational-Noise-Induced Deafness
Laijun Xue
1, Yanhong Zhang
2, Aichu Yang
31Department of Occupational Diseases, Qingyuan Municipal Hospital for Occupational Disease Prevention and Treatment,
Qingyuan, China
2Community Health Service Center of Kunlun Road in Karamay District, Karamay, China
3Institute of Occupational Health Surveillance, Guangdong Province Hospital for Occupational Diseases Prevention and
Treatment; Guangdong Provincial Key Laboratory of Occupational Diseases Prevention and Treatment, Guangzhou, China
Abstract
Objective: In order to provide a theoretical basis for the revision of the cur-rent diagnostic criteria for occupational noise-induced deafness (ONID), we evaluated the degree of ONID by analyzing different high-frequency-hearing- threshold-weighted values (HFTWVs). Methods: A retrospective study was conducted to evaluate the diagnosis of patients with ONID from January 2016 to January 2017 in Guangdong province, China. Based on 3 hearing tests (each interval between the tests was greater than 3 days), the minimum thre-shold value of each frequency was obtained using the 2007 edition’s diagnos-tic criteria for ONID. The speech frequency and the HFTWVs were analyzed based on age, noise exposure, and diagnostic classification using SPSS21.0. Results: 168 patients in total were involved in this study, 154 males and 14 females, and the average age was 41.18 ± 6.07. The diagnosis rate was in-creased by the weighted value of the high frequencies and was more than the mean value of the pure speech frequency (MVPSF). The diagnosis rate for the weighted 4 kHz frequency level increased by 13.69% (χ2 = 9.880, P = 0.002),
the weighted 6 kHz level increased by 15.47% (χ2 = 9.985, P = 0.002), and the
weighted 4 kHz + 6 kHz level increased by 15.47% (χ2 = 9.985, P = 0.002).
The differences were all statistically significant. The diagnostic rate of the dif-ferent thresholds showed no obvious difference between the genders. The age groups were divided into less than or equal to 40 years old (group A) and 40 - 50 years old (group B). There were several groups with a high frequency: high
How to cite this paper: Xue, L.J., Zhang, Y.H. and Yang, A.C. (2018) The Effect of a High-Frequency-Hearing-Threshold Weighted Value on the Diagnosis of Occupation-al-Noise-Induced Deafness. Journal of Biosciences and Medicines, 6, 88-99.
https://doi.org/10.4236/jbm.2018.612009
DOI: 10.4236/jbm.2018.612009 89 Journal of Biosciences and Medicines
frequency weighted 4 kHz ( group A χ2 = 3.380, P = 0.050; group B χ2 = 4.054,
P = 0.032), high frequency weighted 6 kHz (group A χ2 = 6.362, P = 0.012;
group B χ2 = 4.054, P = 0.032), weighted 4 kHz + 6 kHz (group A χ2 = 6.362 P
= 0.012; B χ2 = 4.054, P = 0.032) than those of MVPSF in the same group on
ONID diagnosis rate. The differences between the groups were statistically significant. There was no significant difference between the age groups (χ2 =
2.265, P = 0.944). The better ear’s (the smaller hearing threshold weighted value) MVPSF and the weighted values for the different high frequencies were examined in light of the number of working years; the group that was ex-posed to noise for more than 10 years had significantly higher values than those of the average thresholds of each frequency band in the groups with 3 - 5 years of exposure (F = 2.271, P = 0.001) and 6 - 10 years of exposure (F = 1.563, P = 0.046). The differences were statistically significant. The different HFTWVs were higher than those of the MVPSF values, and the high fre-quency weighted 4 kHz + 6 kHz level showed the greatest difference, with an average increase of 2.83 dB. The diagnostic rate that included the weighted high frequency values was higher for the mild, moderate, and severe cases than those patients who were only screened with the pure frequency tests. The results of the comparisons of the diagnosis rates for mild ONID were as follows: the weighted 3 kHz high frequency level (χ2 = 3.117, P = 0.077) had
no significant difference, but the weighted 4 kHz level (χ2 = 10.835, P =
0.001), 6 kHz level (χ2 = 9.985, P = 0.002), 3 kHz + 4 kHz level (χ2 = 6.315, P =
0.012), 3 kHz + 6 kHz level (χ2 = 6.315, P = 0.012), 4 kHz + 6 kHz level (χ2 =
9.985, P = 0.002), and 3 kHz + 4 kHz + 6 kHz level (χ2 = 7.667, P = 0.002)
were significantly higher than the diagnosis rate of the mean value of the PSF. There was no significant difference between the 2 groups for the moderate
and severe grades (P > 0.05). Conclusion: Different HFTWVs increase the
diagnostic rate of ONID. The weighted 4 kHz, 6 kHz, and 4 kHz + 6 kHz high frequency values greatly affected the diagnostic results, and the weighted 4 kHz + 6 kHz high frequency hearing threshold value has the maximum the effect on the ONID diagnosis results.
Keywords
Noise, Occupational Noise Deafness, Noise-Induced Hearing Loss, High Frequency Hearing Threshold Weighted Value, Diagnostic Rate
1. Introduction
DOI:10.4236/jbm.2018.612009 90 Journal of Biosciences and Medicines
most frequent occupational disease in the United States (and probably world-wide) [3]. Researchers [4] have found that repeated exposure to hazardous noise levels might eventually result in a temporary threshold shift (TTS) in hearing, such as tinnitus and “fullness in the head”, and repeated TTSs may cause per-manent shifts. Damage-risk criteria provide the basis for recommending occu-pational noise exposure limits based on noise level and exposure duration, as-suming non-occupational noise levels are low enough to allow the ear to recover. Mutai et al. [5] indicated that hearing loss is one of the most prevalent sensory disorders. Genetic factors are thought to account for more than half of congenit-al and childhood-onset hearing loss and mutations of mitochondricongenit-al DNA are associated with maternally inherited sensorineural hearing loss. The diagnostic criteria for ONID in China were revised 4 times from 1996 (GB16152-1996 Di-agnostic Criteria and Management of Occupational Noise-induced Deafness) [6] to 2014 (GB49-2014 Diagnosis of Occupational Noise-induced Deafness) [7], and the largest difference was included in the 10% 4 kHz HFTWV on the basis of the 90% MVPSF. There is no uniform standard for high frequency hearing thresholds on ONID in the world. Some countries or organizations, such as WHO and ISO [8], emphasize the main frequency, and others, such as Japan [9] and the United States [10], calculate the arithmetic average or weighted value. The purpose of this study was to compare the results and degrees of ONID in light of the different HFTWVs and provide a theoretical basis for the revision of ONID diagnosis standards.
2. Materials and Methods
2.1. Research Subjects
A retrospective study was conducted to investigate the diagnosis of ONID at the Guangdong Provincial Hospital for Occupational Disease Prevention and Treatment from January 2016 to January 2017. The minimum threshold value of each frequency was obtained using the diagnostic criteria of the 2007 standards for ONID [11]. The pure tone audiometry with a binaural high frequency (3 kHz, 4 kHz, and 6 kHz) threshold average value was greater than or equal to 40 dB. Basic patient information was collected, including gender, age, length of ex-posure to noise, cumulative noise exex-posure, posts, and industry. The cases were screened using the inclusion criteria and exclusion criteria. Standard GBZ/T189.8 [12] set a limit of more than 80 dB (A) as the time-weighted average (TWA) for an 8-hour work day/40-hour work week exposure to noise (85 dB (A)). The sub-jects in this study were working in the manufacturing, mining, and transporta-tion industries with exposure to continuous noise at more than 85 dBA (accord-ing to the results of the noise monitor(accord-ing). They did not regularly use hear(accord-ing protection devices.
2.2. Inclusion Criteria
DOI: 10.4236/jbm.2018.612009 91 Journal of Biosciences and Medicines
than 3 years in men aged 18 to 50 years old and women aged 18 to 45 years old. Based on the outcomes of the 3 hearing tests, the results of the pure tone hearing threshold were consistent with the characteristics of pure sensorineural hearing loss (the basic symmetry of the left and right audiometric curves). We obtained the minimum hearing threshold value of each frequency for each test interval when the patient stayed in the hospital longer than 3 days. The object of this study was to investigate cases that were discussed by the occupational disease diagnosis team.
2.3. Exclusion Criteria
The patients included in this study met the following criteria: they had a history of ear disease affecting the pure tone hearing threshold (including drug poison-ing deafness, traumatic deafness, familial deafness, infectious disease-deafness, or sudden deafness), and had been diagnosed as having mixed deafness, conduc-tive deafness, false deafness, or exaggerated hearing loss. The men had to be over 50 years old and the women had to be over 45 years old or younger than 18 years old.
2.4. Research Group
There were 168 cases of eligible cases, which were combined into 8 groups ac-cording to the weighted different high frequency hearing threshold, MVPSF group (Speech Frequency), weighted 3 kHz high frequency group (3 kHz), weighted 4 kHz high frequency group (4 kHz), weighted 4 kHz high frequency group (4 kHz), weighted 6 kHz high frequency group (6 kHz), weighted 3 kHz + 4 kHz high frequency group (3 kHz + 4 kHz), weighted 3 kHz + 6 kHz high fre-quency group (3 kHz + 6 kHz), weighted 4 kHz + 6 kHz high frefre-quency group (4 kHz + 6 kHz), weighted 3 kHz + 4 kHz + 6 kHz high frequency group (3 kHz + 4 kHz + 6 kHz).
2.5. Pure Tone Audiometry
The audiometry tests were performed by an experienced doctor who has been practicing for many years. Hearing was assessed in the range of pure tone thre-sholds from 0.5 to 6 kHz, according to the GB/T16403 standard for Acoustics and Audiometric Test Methods for Basic Pure Tone Air and Bone Conduction Threshold Audiometry. Audiometric tests were performed using a hearing in-strument (Otometrics, Denmark, in the calibration period) in accordance with the requirements of standard GBZ49-2014 (Diagnosis of Occupational Noise-induced Deafness) in a sound-isolated chamber for all subjects. The results of the audi-ometry tests were adjusted by age and sex using standard GB/T7582.
2.6. Auditory Threshold Calculation Method
DOI:10.4236/jbm.2018.612009 92 Journal of Biosciences and Medicines
value multiplied by 0.1of the better ear. Bringing into high frequency included 3 kHz, 4 kHz, 6 kHz, (3 kHz + 4 kHz)/2, (3 kHz + 6 kHz)/2, (4 kHz + 6 kHz)/2, and (3 kHz + 4 kHz + 6 kHz)/3, respectively.
2.7. Classification Basis
The values were judged based on the MVPSF or high frequency weighted value
High frequency
HL0.5Hz HL1kHz HL2kHz 0.9 HL 0.1 26
3 dB
+ × + × ≥
+
of the better ear: 26 dB - 40 dB (HL) was mild deafness, 41 dB - 55 dB (HL) was moderate deafness, and more than 56 dB (HL) was severe deafness.
2.8. Statistical Treatment
Statistical analysis was performed using SPSS software package 21.0. A P-value of <0.05 was used as the statistical significance. The two-factor analysis of the variance was performed using the binaural speech and high frequency values, which needed to conform to a normal distribution or similar normal data. Chi square tests were carried out for the comparison of the categorical data rate by age, sex, length of service, and industry group.
3. Results
3.1. Basic Characteristics of All Subjects
We had a total of 168 cases in this research. The average age of the patients was 41.2 ± 6.1. There were 154 males aged 25 to 50 years old, and their average age was 41.5 ± 6.0. There were 14 females aged 31 to 45 years old, and their average age was 37.2 ± 5.1.All subjects were exposed to noise from 81 to 107 dB (A) for more than 3 years.
3.2. Comparison of the Diagnostic Rates of ONID between the
MVPSF and HFTWVs for the Gender Groups (Table 1)
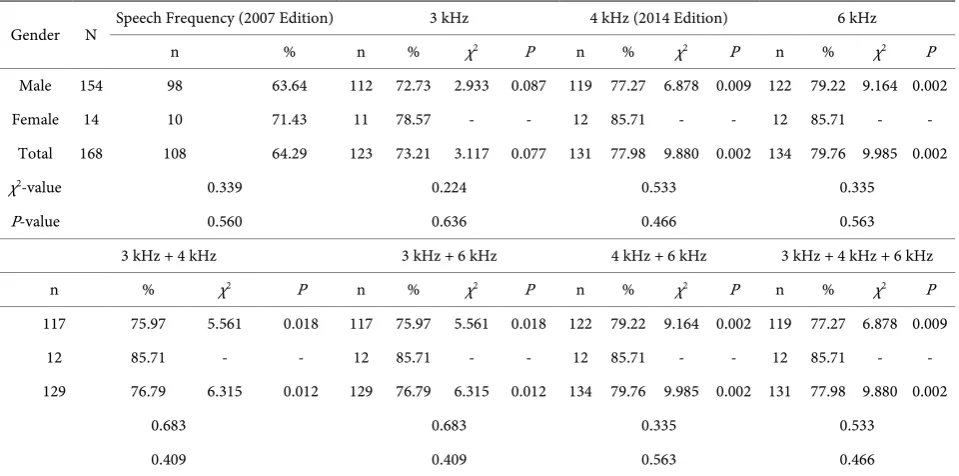
With the standard of the MVPSF (2007 Edition), 108 cases were conforming to noise deafness, accounting for 64.29% of the total number, 98 men and 10 women. The standard for the HFTWV ≥ 26 dB, and we found that the diagnos-tic rate of ONID was greater than that of the MVPSF: it was greater by 8.92% (χ2
= 3.117, P = 0.077) at the weighted 3 kHz level, 8.92% (χ2 = 3.117, P = 0.077) at
the weighted 4 kHz level, 15.47% (χ2 = 9.985, P = 0.002) at the weighted 6 kHz
level, 12.50% (χ2 = 6.315, P = 0.012) at the weighted 3 kHz + 4 kHz level, 12.50%
(χ2 = 6.315, P = 0.012) at the weighted 3 kHz + 6 kHz level, 15.47% (χ2 = 9.985, P
= 0.002) at the weighted 4 kHz + 6 kHz level, and 13.69% (χ2 = 9.880, P = 0.002)
DOI: 10.4236/jbm.2018.612009 93 Journal of Biosciences and Medicines Table 1. Comparison of the diagnostic rates of the gender groups.
Gender N Speech Frequency (2007 Edition) 3 kHz 4 kHz (2014 Edition) 6 kHz
n % n % χ2 P n % χ2 P n % χ2 P
Male 154 98 63.64 112 72.73 2.933 0.087 119 77.27 6.878 0.009 122 79.22 9.164 0.002 Female 14 10 71.43 11 78.57 - - 12 85.71 - - 12 85.71 - -
Total 168 108 64.29 123 73.21 3.117 0.077 131 77.98 9.880 0.002 134 79.76 9.985 0.002
χ2-value 0.339 0.224 0.533 0.335
P-value 0.560 0.636 0.466 0.563
3 kHz + 4 kHz 3 kHz + 6 kHz 4 kHz + 6 kHz 3 kHz + 4 kHz + 6 kHz
n % χ2 P n % χ2 P n % χ2 P n % χ2 P
117 75.97 5.561 0.018 117 75.97 5.561 0.018 122 79.22 9.164 0.002 119 77.27 6.878 0.009 12 85.71 - - 12 85.71 - - 12 85.71 - - 12 85.71 - - 129 76.79 6.315 0.012 129 76.79 6.315 0.012 134 79.76 9.985 0.002 131 77.98 9.880 0.002
0.683 0.683 0.335 0.533
0.409 0.409 0.563 0.466
-There were not enough cases in this analysis, so it was not suitable for the values to be checked by the chi square test.
3.3. Comparison of the Age Group Diagnostic Rates for the MVPSF
(2007 Edition) and HFTWVs (Table 2)
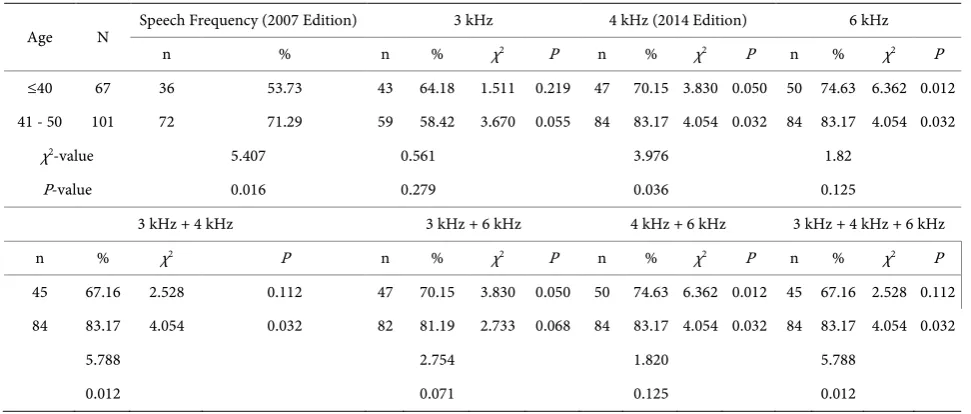
The age groups were divided into patients less than 40 years old (group A) and patients who were 40-50 years old (group B). Compared with the MVPSF, the diagnosis rate was significantly higher (group A: χ2 = 3.380, P = 0.050; group B:
χ2 = 4.054, P = 0.032) at the weighted 4 kHz level (group A: χ2 = 6.362, P = 0.012;
group B: χ2 = 4.054, P = 0.032) and at the weighted 6 kHz level (group A: χ2 =
6.362, P = 0.012; group B: χ2 = 4.054, P = 0.032). At the weighted 4 kHz + 6 kHz
level, the difference between the 2 groups was statistically significant, but the difference for the other levels was not significantly different. There was no sig-nificant difference of totality between the 2 groups (χ2 = 2.265, P = 0.944). A
re-spective comparison between groups A and B at different frequencies found that the diagnosis rate of ONID with weighted different high-frequency in group B was higher than that of group A, in addition to the weighted 3 kHz with the high frequency. The difference in the ages between the 2 groups was significant. At a simple speech frequency (χ2 = 5.407, P = 0.016), we found the following values:
at the weighted 4 kHz level (χ2 = 3.976, P = 0.036), at the weighted 3 kHz + 4
kHz level (χ2 = 5.788, P = 0.012), and at the weighted 3 kHz + 4 kHz + 6 kHz
level (χ2 = 5.788, P = 0.012).
3.4. Comparisons of the Mean between the Speech Frequency and
Different HFTWVs in the Working Years Group (Table 3,
x s±
)
DOI:10.4236/jbm.2018.612009 94 Journal of Biosciences and Medicines Table 2. Comparison of the diagnostic rates of the age groups.
Age N Speech Frequency (2007 Edition) 3 kHz 4 kHz (2014 Edition) 6 kHz
n % n % χ2 P n % χ2 P n % χ2 P
≤40 67 36 53.73 43 64.18 1.511 0.219 47 70.15 3.830 0.050 50 74.63 6.362 0.012 41 - 50 101 72 71.29 59 58.42 3.670 0.055 84 83.17 4.054 0.032 84 83.17 4.054 0.032
χ2-value 5.407 0.561 3.976 1.82
P-value 0.016 0.279 0.036 0.125
3 kHz + 4 kHz 3 kHz + 6 kHz 4 kHz + 6 kHz 3 kHz + 4 kHz + 6 kHz
n % χ2 P n % χ2 P n % χ2 P n % χ2 P
45 67.16 2.528 0.112 47 70.15 3.830 0.050 50 74.63 6.362 0.012 45 67.16 2.528 0.112 84 83.17 4.054 0.032 82 81.19 2.733 0.068 84 83.17 4.054 0.032 84 83.17 4.054 0.032
5.788 2.754 1.820 5.788
0.012 0.071 0.125 0.012
Table 3. Comparison of the different frequency means of the working years groups (x s± ).
Working
years N frequency Speech 3 kHz 4 kHz 6 kHz 3 kHz + 4 kHz 3 kHz + 6 kHz 4 kHz + 6 kHz 4 kHz + 6 kHz 3 kHz + 3 - 5 38 29.78 ± 9.83 31.70 ± 9.78 32.28 ± 9.42 32.32 ± 9.58 32.03 ± 9.58 32.07 ± 9.63 32.33 ± 9.48 32.12 ± 9.55 6 - 10 67 30.49 ± 9.28 32.31 ± 9.17 32.72 ± 8.53 33.39 ± 8.66 32.56 ± 8.83 32.90 ± 8.85 33.09 ± 8.57 32.83 ± 8.72 >10 63 31.90 ± 13.55 33.99 ± 13.04 34.47 ± 12.59 34.73 ± 12.99 34.26 ± 12.81 34.40 ± 12.98 34.74 ± 12.77 34.40 ± 12.85 Total 168 30.74 ± 11.24 32.70 ± 10.98 33.20 ± 10.54* 33.46 ± 10.80* 32.98 ± 10.75 33.13 ± 10.84* 33.57 ± 10.65* 33.14 ± 10.74* Compared with the speech frequency mean, *P < 0.05.
PSF and the weighted values of the different high frequencies in relation to the number of working years for each group were compared. Those who worked more than 10 years had a significantly higher value than that of the average thresholds of each frequency band in the 3 - 5 years group (F = 2.271, p = 0.001) and the 6 - 10 years group (F = 1.563, p = 0.046); the difference was statistically significant. The MVPSF of the better ear was significantly lower than that of the high frequency values for the weighted 4 kHz level (F = 2.464, P = 0.036), 6 kHz level (F = 2.727, P = 0.021), 3 kH + 6 kHz level (F = 2.394, P = 0.042), 4 kHz + 6 kHz level (F = 2.832, P = 0.020), and 3 kHz + 4 kHz + 6 kHz level (F = 2.401, P = 0.041); the difference was statistically significant (P < 0.05). The different HFTWVs were higher than those of the MVPSF values, and the high frequency weighted 4 kHz + 6 kHz level showed the greatest frequency difference, with an average increase of 2.83 dB.
3.5. Effects on the Diagnostic Classification of the Different High
Frequencies (Table 4)
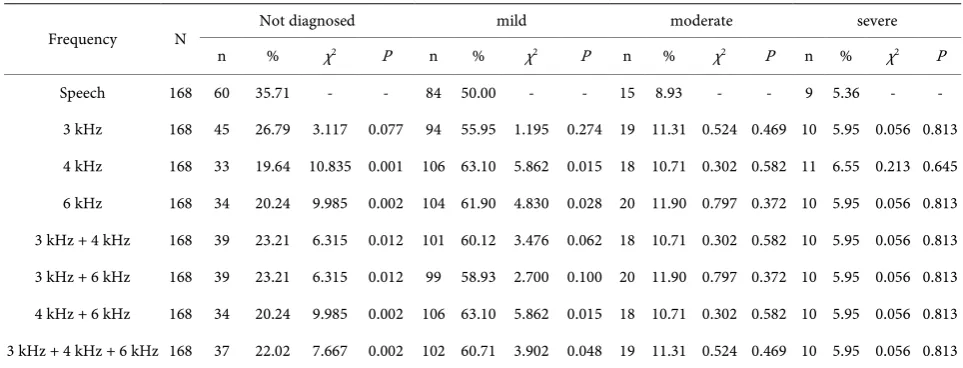
[image:7.595.57.537.327.425.2]DOI: 10.4236/jbm.2018.612009 95 Journal of Biosciences and Medicines Table 4. Comparison of the diagnostic classification between the speech frequency mean value and different high frequency val-ues.
Frequency N Not diagnosed mild moderate severe n % χ2 P n % χ2 P n % χ2 P n % χ2 P
Speech 168 60 35.71 - - 84 50.00 - - 15 8.93 - - 9 5.36 - - 3 kHz 168 45 26.79 3.117 0.077 94 55.95 1.195 0.274 19 11.31 0.524 0.469 10 5.95 0.056 0.813 4 kHz 168 33 19.64 10.835 0.001 106 63.10 5.862 0.015 18 10.71 0.302 0.582 11 6.55 0.213 0.645 6 kHz 168 34 20.24 9.985 0.002 104 61.90 4.830 0.028 20 11.90 0.797 0.372 10 5.95 0.056 0.813 3 kHz + 4 kHz 168 39 23.21 6.315 0.012 101 60.12 3.476 0.062 18 10.71 0.302 0.582 10 5.95 0.056 0.813 3 kHz + 6 kHz 168 39 23.21 6.315 0.012 99 58.93 2.700 0.100 20 11.90 0.797 0.372 10 5.95 0.056 0.813 4 kHz + 6 kHz 168 34 20.24 9.985 0.002 106 63.10 5.862 0.015 18 10.71 0.302 0.582 10 5.95 0.056 0.813 3 kHz + 4 kHz + 6 kHz 168 37 22.02 7.667 0.002 102 60.71 3.902 0.048 19 11.31 0.524 0.469 10 5.95 0.056 0.813
The diagnosis rate of mild ONID with the weighted difference high frequency was higher than that of the MVPSF: at the weighted 3 kHz high frequency level, it increased by 13.10% (χ2 = 10.835, P = 0.001),at the weighted 4 kHz level, it
in-creased by 11.90% (χ2 = 9.985, P = 0.002), at the weighted 6 kHz level, it
in-creased by 10.12% (χ2 = 6.315, P = 0.012), at the weighted 3 kHz + 4 kHz level, it
increased by 8.93% (χ2 = 6.315, P = 0.012), at the weighted 3 kHz + 6 kHz level,
it increased by 13.10% (χ2 = 9.985, P = 0.002), at the weighted 4 kHz + 6 kHz
level, it increased by 10.71% (χ2 = 7.667, P = 0.002), and at the weighted 3 kHz +
4 kHz + 6 kHz level, it increased in addition to the weighted 3 kHz high quency. The diagnosis rate of the moderate and severe ONID with the high fre-quencies was higher than that of the pure frequency, but the difference was not significant (P > 0.05).
4. Discussion
The purpose of this study was to elucidate whether the inclusion of different frequency thresholds had an effect on the ONID diagnosis; there was an attempt to illuminate the extent and magnitude of the impact, eventually providing a theoretical basis for the revision of the diagnostic criteria for ONID. Noise-induced hearing loss is a kind of progressive sensorineural hearing loss that occurs due to the long-term exposure to noise in the workplace. It includes the early loss of high frequency hearing, which is followed by difficulties with language listening. Because noise-induced hearing loss is irreversible, its early diagnosis can help prevent the development of hearing loss, especially for speech frequencies [13].
fac-DOI:10.4236/jbm.2018.612009 96 Journal of Biosciences and Medicines
tors of noise-induced hearing loss. Genetic factors mainly include the gene po-lymorphism of ATP enzymes related to energy metabolism, rs1368402 and rs891969 loci polymorphism, rs4880 single nucleotide polymorphism, hOGG1 Cys/Cys genotype, and the sensitivity of the rs2763979 locus [14] [15]. The sults of twin studies showed that monozygotic pairs were more similar with re-gards to noise sensitivity than dizygotic pairs, and quantitative genetic modeling indicated significant familiality. The best z-fitting genetic model provided an es-timate of heritability at 36% (95% CI = 0.20 - 0.50) and when hearing impaired subjects were excluded from this, it rose to 40% (95% CI = 0.24 - 0.54) [16]. Mehrparvar et al. [17] noted that hearing loss was more common in high-frequency audiometry testing than conventional audiometry testing. High frequency au-diometry tests are more sensitive to detecting noise-induced hearing loss than conventional audiometry tests. The early diagnosis of hearing sensitivity to noise can thus help prevent hearing loss at lower frequencies, especially speech fre-quencies.
The results of this study showed that most of the patients diagnosed over the past year at the hospital with ONID were male (91.7%). The average hearing loss of males was greater than that of females, but there was no significant difference between males and females. The results from a noise exposure survey [18] re-ported that men do most of the noisy jobs and therefore are more likely to suffer from hearing problems. Those most affected by noise (in terms of absolute mag-nitude) are 50-year-old men. Although 40-year-olds have already accrued as much noise-induced permanent threshold shift as any of the older groups (all exposures ended at age 40), they have very little age-related hearing loss, and therefore their impairments (aging and noise combined) are mostly too mild to reach the 25 dB HL threshold for monaural hearing impairment. By age 50, age-related hearing loss is large enough to push many people over the 25 dB threshold.
Our results show that including the high frequency hearing threshold in tests has a significant impact on the diagnosis effect of ONID. For those at the 3 kHz level, the diagnosis rate increased by 8.92% (it increased at other levels, too: 13.69% at the 4 kHz level, 15.47% at the 6 kHz level, 12.50% at the 3 kHz + 4 kHz level, 12.50% at the 3 kHz + 6 kHz level, 15.47% at the 4 kHz + 6 kHz level, and 13.69% at the 3 kHz + 4 kHz + 6 kHz level. The highest increase in diagnosis was at the 4 kHz + 6 kHz level (15.47%). This is consistent with the results of audiograms on occupational noise-induced hearing loss (ONIHL); the maxi-mum hearing loss is usually at a high frequency of 4 kHz. Epidemiologic studies [19] have also reported that the audiometric configuration of noise-induced hearing loss shows symmetrical, mild to moderate sensorineural hearing loss mostly at 3000 and 4000 Hz.
elimi-DOI: 10.4236/jbm.2018.612009 97 Journal of Biosciences and Medicines
nated. The test results of hearing loss were attributed to the noise-induced hear-ing loss. Aghear-ing and noise are generally considered the most common causes of adult hearing loss around the world. Similar studies [20] reported that the rela-tive contributions of aging and noise are difficult to determine for the following reasons: age-related hearing loss (ARHL) and NIHL have similar pure tone au-diometric features, the pure tone audiogram in early NIHL typically demon-strates notching in the 3 to 6 kHz region (8 kHz thresholds are better than those at 3 to 6 kHz), and age-related threshold shifts (typically greatest at 8 kHz) may efface the notch.
In the working years groups, our results showed that exposure to noise for more than 10 years was significantly higher than in the groups with 3 - 5 and 6 - 10 years of exposure; this result is related to the accumulation of the noise expo-sure. Hearing loss may gradually develop over a period of years; this occurs most rapidly during the first 6 - 10 years of exposure to noise and usually starts at high frequencies, mostly at 4000 Hz. Some studies [21] [22] found that individuals who were 30 - 60 years old and who were exposed to noise for 5 - 10 years had an increased risk of hearing loss (0.2% - 0.8%) when exposed to average daily noise levels of 80 dB (A). This risk increased to 1.4% - 4.9% with daily noise ex-posure levels of85 dB (A) and to 5.4% - 15.9% with daily noise exex-posure levels of 90 dB (A). Statistics from Attias’s study in Israel [23] showed that the greatest loss usually occurs at around 4 kHz, and the earliest damage is in the highest frequencies (6 and/or 8 kHz). The average hearing loss is greater at the higher frequency ranges (4 - 8 kHz) than at the lower frequency ranges (0.25 - 2 kHz). Usually, and especially in the early stage of damage, the speech frequency area range (0.25 - 2 kHz) remains intact, with the losses starting at 3 kHz and above. In the classification of occupational noise deafness, the diagnostic rate of ONID for different frequencies for mild, moderate, and severe cases was higher than that of the average frequency. However, there were significant differences in the different high frequency tests only for mild deafness, and no significant differ-ence in the rates for moderate and severe deafness. This result is related to the insufficient sample size. It is necessary to accumulate a greater number of mod-erate and severe occupational noise deafness cases to further analysis.
DOI:10.4236/jbm.2018.612009 98 Journal of Biosciences and Medicines
Acknowledgements
This study was supported by the National Science and Technology Support Pro-gram in the 12th Five-Year Plan, China (No. 2014BAI12B01), National Key Clinical Specialist program, China (No. 2011-09), and the Guangdong Provincial Key Laboratory of Occupational Disease Prevention and Treatment, China (No. 2012A061400007).
Conflicts of Interest
The authors declare no conflicts of interest regarding the publication of this pa-per.
References
[1] Antonioli, C.A., Momensohn-Santos, T.M. and Benaglia, T.A. (2016) High-Frequency Audiometry Hearing on Monitoring of Individuals Exposed to Occupational Noise: A Systematic Review. Int Arch Otorhinolaryngol, 20, 281-289.
[2] Mehrparvar, A.H., Mirmohammadi, S.J., Davari, M.H., Mostaghaci, M., Mollasa-deghi, A., Bahaloo, M., et al. (2014) Conventional Audiometry, Extended High-Frequency Audiometry, and DPOAE for Early Diagnosis of NIHL. Iran Red Crescent Med J, 16, e9628.https://doi.org/10.5812/ircmj.9628
[3] Sha, S.H. and Schacht, J. (2017) Emerging Therapeutic Interventions against Noise-Induced Hearing Loss. Expert Opin Investig Drugs, 26, 85-96.
https://doi.org/10.1080/13543784.2017.1269171
[4] Adams, K.L., Langley, A. and Brazile, W. (2016) Noise Exposure and Temporary Hearing Loss of Indoor Hockey Officials: A Pilot Study. Journal of Environmental Health, 79, 22-26.
[5] Mutai, H., Watabe, T., Kosaki, K., Ogawa, K. and Matsunaga, T. (2017) Mitochon-drial Mutations in Maternally Inherited Hearing Loss. BMC Med Genet, 18, 32. https://doi.org/10.1186/s12881-017-0389-4
[6] Ministry of Health of the PRC (1996) Diagnostic Criteria and Management of Oc-cupational Noise-Induced Deafness: GB16152-1996. People's Medical Publishing House, Beijing.
[7] National Health and Family Planning Commission of the PRC (2014) Diagnosis of Occupational Noise-Induced Deafness: GBZ49-2014. People’s Medical Publishing House, Beijing.
[8] ISO1999 (2013) Acollstics, Estimation of Noise-Induced Hearing Loss. International Organization for Standardization, Geneva.
[9] Miyakita, T. and Miura, H. (1986) A Tentative Proposal for Classification of Audi-ograms in Noise-Induced Deafness: Relationship between Audiogram and Subjec-tive Complaints in Noise-Exposed Workers. Int Arch Occup Environ Health, 57, 173-183.https://doi.org/10.1007/BF00405786
[10] Murphy, W.J. and Franks, J.R. (2002) NIOSH Criteria for a Recommended Stan-dard: Occupational Noise Exposure, Revised Criteria 1998. Journal of the Acoustical Society of America, 111, 2397.https://doi.org/10.1121/1.4778162
DOI: 10.4236/jbm.2018.612009 99 Journal of Biosciences and Medicines GBZ/T189.8 -2007. People's Medical Publishing House, Beijing.
[13] Mehrparvar, A.H., Mirmohammadi, S.J., Ghoreyshi, A., Mollasadeghi, A. and Loukzadeh, Z. (2011) High-Frequency Audiometry: A Means for Early Diagnosis of Noise-Induced Hearing Loss. Noise & Health, 13, 402-406.
https://doi.org/10.4103/1463-1741.90295
[14] Xu, X.R., Wang, J.J., Yang, Q.Y., Jiao, J., He, L.H., Yu, S.F., et al. (2017) The Effect of PCDH15 Gene Variations on the Risk of Noise-Induced Hearing Loss in a Chi-nese Population. Biomedical and Environmental Sciences, 30, 143-146.
[15] Li, Y., Yu, S., Gu, G., Chen, G., Zheng, Y., Jiao, J., et al. (2017) Polymorphisms of Heat Shock Protein 70 Genes (HSPA1A, HSPA1B and HSPA1L) and Susceptibility Of Noise-Induced Hearing Loss in a Chinese Population: A Case-Control Study.
PLoS One, 12, e0171722.https://doi.org/10.1371/journal.pone.0171722
[16] Heinonen-Guzejev, M., Vuorinen, H.S., Mussalo-Rauhamaa, H., Heikkilä, K., Koskenvuo, M. and Kaprio, J. (2005) Genetic Component of Noise Sensitivity. Twin Res HumGenet, 8, 245-249.https://doi.org/10.1375/twin.8.3.245
[17] Mehrparvar, A.H., Mirmohammadi, S.J., Ghoreyshi, A., Mollasadeghi, A. and Loukzadeh, Z. (2011) High-Frequency Audiometry: A Means for Early Diagnosis of Noise-Induced Hearing Loss. Noise Health, 13, 402-406.
https://doi.org/10.4103/1463-1741.90295
[18] Dobie, R.A. (2008) The Burdens of Age-Related and Occupational Noise-Induced Hearing Loss in the United States. Ear Hear, 29, 565-577.
https://doi.org/10.1097/AUD.0b013e31817349ec
[19] Martins, R.H.G., Tavares, E.L.M., Neto, A.C.L. and Fioravanti, M.P. (2007) Occupa-tional Hearing Loss in Teachers: A Probable Diagnosis. Rev Bras Otorrinolaringol, 73, 239-244.https://doi.org/10.1590/S0034-72992007000200015
[20] Dobie, R.A. (2008) The Burdens of Age-Related and Occupational Noise-Induced Hearing Loss in the United States. Ear Hear, 29, 565-577.
https://doi.org/10.1097/AUD.0b013e31817349ec
[21] Yu, S.F., Chen, G.S., Jiao, J., Gu, G.Z., Zhang, H.L., Wang, X.M., et al. (2017) A Co-hort Study on Occupational Noise Induced Hearing Loss in Workers at an Iron and Steel Plant. Zhonghua Yu Fang Yi XueZaZhi, 51, 13-19.
[22] Sriopas, A., Chapman, R.S., Sutammasa, S. and Siriwong, W. (2017) Occupational Noise-Induced Hearing Loss in Auto Part Factory Workers in Welding Units in Thailand. J Occup Health, 59, 55-62.https://doi.org/10.1539/joh.15-0291-OA