ISSN Online: 2152-2219 ISSN Print: 2152-2197
DOI: 10.4236/jep.2019.107054 Jul. 23, 2019 919 Journal of Environmental Protection
Mapping of Radon (
220
Rn and
222
Rn)
Concentration Distribution in a
Microclimate Condition Cellar Using
Nuclear Track Methodology
Guillermo Espinosa
1*, José-Ignacio Golzarri
1, Alfonso M. Román-Sedano
2, Fermín Castillo
21Instituto de Física, Universidad Nacional Autónoma de México, Circuito de la Investigación Científica, Ciudad Universitaria,
Coyoacán, Ciudad de México, México
2Laboratorio de Espectroscopia, Instituto de Ciencias Físicas, Universidad Nacional Autónoma de México, Cuernavaca, México
Abstract
This work presents the results of the Radon (220Rn and 222Rn) measurements
made with 486 chips of CR-39 (Allyl Dyglicol Poly Carbonate) MASL™ bared detectors, in a reticular mode distribution, inside of a cellar with average
in-door radon concentration 862 ± 49 Bq/m3. The exposure time was 3 months,
in microclimate condition of constant temperature, humidity, barometric pressure and no airflow. After these 3 months, all the detectors were chemically etched in KOH 6.25 M solution at 60˚C ± 1˚C for 18 hours, following a very well established protocol for indoor radon survey by the Dosimetry Applica-tions Laboratory of the Physics Institute of the National Autonomous Univer-sity of Mexico, and later read automatically by CADIS (Counting Automatically Digital Image System). The results show that each one of the nine measured planes is not homogeneous presenting important differences of indoor radon
concentration values. Specifically, the Radon (220Rn and 222Rn) concentration
levels vary for each measured point within the cellar. It is a very important ob-servation to consider for the calculation of dose and radiological risk.
Keywords
Indoor Radon, Mapping Radon Distribution, Nuclear Track Methodology, NTM
1. Introduction
It is very well known that radiation exposure originating from radon inhalation How to cite this paper: Espinosa, G.,
Golzarri, J.-I., Román-Sedano, A.M. and Castillo, F. (2019) Mapping of Radon (220Rn
and 222Rn) Concentration Distribution in a
Microclimate Condition Cellar Using Nuc-lear Track Methodology. Journal of Envi-ronmental Protection, 10, 919-928. https://doi.org/10.4236/jep.2019.107054
Received: May 8, 2019 Accepted: July 20, 2019 Published: July 23, 2019
Copyright © 2019 by author(s) and Scientific Research Publishing Inc. This work is licensed under the Creative Commons Attribution International License (CC BY 4.0).
http://creativecommons.org/licenses/by/4.0/
DOI: 10.4236/jep.2019.107054 920 Journal of Environmental Protection
(220Rn, 222Rn, and short-lived decay products or progeny) is almost half of the
natural radiation, and significant indoor radon concentrations can cause lung cancer occurrence; therefore its evaluation deserves particular attention in order
to minimize the radiological risk to the population [1] [2] [3] [4] [5].
The measurement of indoor radon is an art, because the radon distribution in a room depends on many factors, as has been determined in several studies
[6]-[11]. Some of these factors are: location, size and shape or the dwelling, con-struction materials, ventilation system, and ventilation habits, architecture style, environmental temperature and measurement place temperature, humidity, type and distribution of objects or furniture inside a room, among others. All these factors make the radon measurements in each place unique.
Because of the radon concentration, data obtained are the basis for calculation of the dose and risk of cancer and the public health. Therefore, the efforts of the analysis and measurements of radon should be exhaustive and very accurate
[12]. The aim of this study is to measure the radon concentration distribution
inside of a microclimate-controlled condition cellar, using 486 chips of bared CR-39 Nuclear Track Detectors (NTD) distributed in a reticular mode.
Location
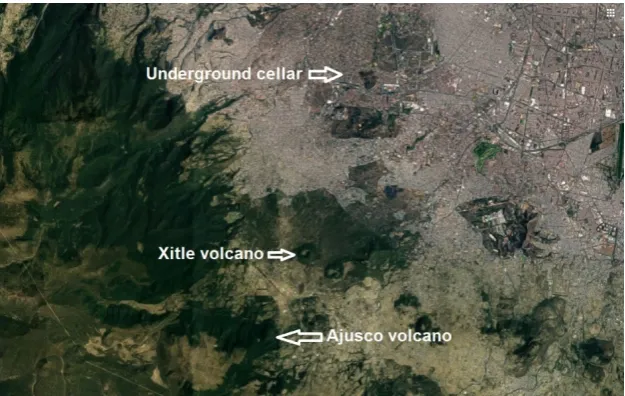
The zone where is located the house and the underground cellar, under study, is
shown in Figure 1. It is a residential area in the south part of Mexico City, with
medium population density (3960 habitants per km2) with in general,
sin-gle-family houses. This zone is close to the volcanic chain called “
Ajus-co-Chichinautzin Sierra”, has a semi-tropical climate, and it is surrounded by
forest and national parks. As complementary information, the National Auto-nomous University of Mexico campus, with more than 349,515 students and
[image:2.595.218.531.497.695.2]40,578 academics [13], is located in this area, too.
DOI: 10.4236/jep.2019.107054 921 Journal of Environmental Protection
The cellar with microclimate conditions studied is underground, inside of the lava of the extinct, 1600 years ago, “Xitle” volcano (from Nahuatl “Xictli” that means “belly button”) with the coordinates 19˚12'N 99˚15''W, and to 2300 me-ters above sea level. This area has and high seismicity activity all the year round.
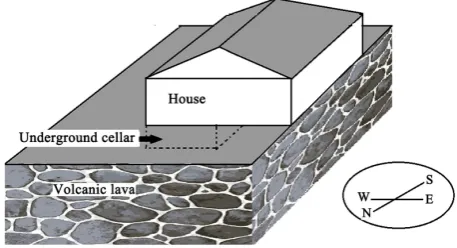
The house and the underground cellar are shown in the plane of Figure 2.
2. Methodology
The measurements of radon concentration inside a cellar, were made with a re-ticular grid, with 9 × 6 detectors in each of the 9 planes, from the top to the
bot-tom of the cellar, as can be observed in Figure 3.
The cellar dimensions are 6.0 × 2.2 × 2.3 meters (length, width and height)
with a total volume of 30.36 m3. The total exposure time to indoor radon and
thoron was 3 months, with a main concentration of 862 Bq/m3 value measured
along a year with two active certified monitors: the AlphaGUARD model D-2000
and the Durridge Rad-7 [14], as is shown in Figure 4. The two times of opening
the door can be observed in the discontinuities in Figure 4. The room is
under-ground, below the house construction, surrounded by volcano rocks (lava) from an extinct volcano in Mexico. The material has high porosity and can keep in radon gas, plus constant radon emanation from the volcanic ground. This room location characteristics made the microclimate conditions of the cellar, as radon
(220Rn and 222Rn) concentration, indoor temperature, relative humidity, and
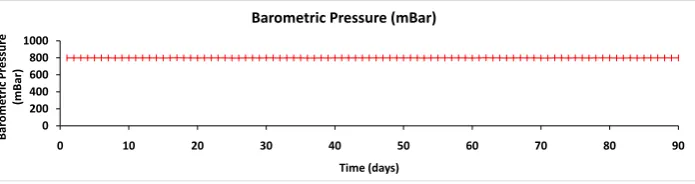
ba-rometric pressure constants. Figure 5 and Figure 6 show the measured data
during 3 months of exposure to radon inside the room. The ventilation is very poor because the room remains closed during this time. The small door at the top was opened only two times in order to review the data and monitor operation.
3. Chemical Etching and Its Readout Process
After the 3 months of exposure time, the detectors were removed and chemically etched, all together, under the same conditions, for 18 hours in a 6.25 M KOH solution at 60˚C ± 1˚C, in a thermo-controlled regulated bath. After the chemi-cal etching, the CR-39 detectors were washed in distilled water and dried,
[image:3.595.258.487.571.695.2]fol-lowing a very well-established protocol in the laboratory [15] [16] [17] [18].
DOI: 10.4236/jep.2019.107054 922 Journal of Environmental Protection
[image:4.595.211.538.232.337.2]Figure 3. Reticular distribution of the 486 passive nuclear track detectors, showing the position of each one.
Figure 4. Indoor radon in the cellar during the experiment, measured with the Alpha-GUARD certificated monitor.
Figure 5. Measured values of temperature and relative humidity (automatic system), With the AlphaGUARD certificated monitor.
Figure 6. Measured values of a barometric pressure (automatic system), With the Alpha-GUARD monitor.
All the detectors with the formed tracks were read on both sides, 10 fields each side with CADIS (Counting Automatic Digital Image System), developed at the PAD-IFUNAM laboratory. The average track density data of each detector, with
0 10 20 30 40 50 60 0 10 20 30 40 50 60
1 3 5 7 9 11131517192123252729313335373941434547495153555759616365676971737577798183858789
Re la tiv e H um id it y (% ) Tem per at ur e ( °C) Time (days)
Temperature (°C) Relative Humidity (%)
0 200 400 600 800 1000
0 10 20 30 40 50 60 70 80 90
Ba ro m et ri c Pre ss ure (mB ar ) Time (days)
[image:4.595.183.537.384.492.2] [image:4.595.189.537.539.631.2]DOI: 10.4236/jep.2019.107054 923 Journal of Environmental Protection
the spatial position in the cellar, was analyzed and plotted with an Origin Pro 8.5.1 software. The radon concentration distribution is reproduced point by point for the 486 detectors, forming the map of the radon distribution inside the cellar.
4. Results and Discussion
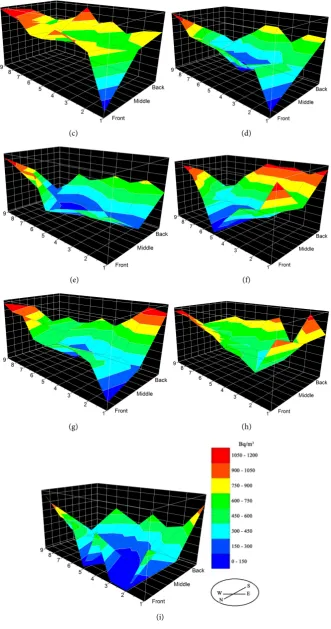
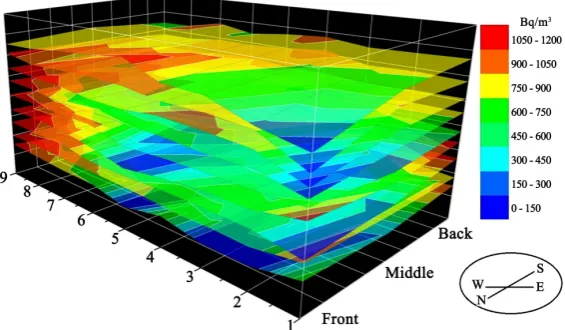
The radon concentration levels obtained are shown in Figure 7. Each figure
represents one level from top to bottom of the cellar. As we can observe, none of the planes shows a uniform radon concentration.
With these experimental results it is shown that the concentration of radon
(220Rn and 222Rn) cannot be considered homogeneous inside a room with
micro-climate and controlled conditions; and of course, there is also no homogeneity in indoor intramural radon concentration when there are variable conditions, as determined by other authors cited in this paper.
So, to do the calculation of radiological dose or risk by radon or personal do-simetry, it is suggested to make the precise measurements inside the room, in the area of interest. These experimental data confirm the results of the mathematical
simulations of the works [6]-[11], where it is determined that radon is not
ho-mogeneous nor regular in its concentration in an interior.
The experimental radon concentration value exhibits variations, ranging from 10% to more than 60% of the average value measured with dynamic, certified and calibrated monitors.
As can be observed in Figure 8, the radon concentration is not uniform in the
total volume of the room, but in each layer, there are variations ranging from 10% to 35%, already having taken in consideration the statistical variation of the measurement method. In addition to that there are also variations in each of the 9 measured layers, giving this a very characteristic and peculiar distribution of radon concentration inside the cellar.
It is also possible to observe the decrease of this one, which is smaller, in the area where the small door is located, and which was opened twice in this period of 3 months of continuous exposition.
These results give us a clear indication that the distribution of radon in a room is not uniform.
DOI: 10.4236/jep.2019.107054 924 Journal of Environmental Protection
(c) (d)
(e) (f)
(g) (h)
[image:6.595.207.539.72.702.2](i)
DOI: 10.4236/jep.2019.107054 925 Journal of Environmental Protection
Figure 8. Radon (220Rn and 222Rn) concentration distribution, in each of the 9
measured planes inside the cellar. (the dynamic of this data can be observed in this link: http://www.fisica.unam.mx/personales/espinosa/investigacion7.php).
5. Previous Results from Other Research Groups and
Relationship with This Work
Zhuo et al. (2001) proposed in the paper entitled “Simulation of the
concentra-tions and distribuconcentra-tions of indoor radon and thoron”; a simulation model, show-ing probable patterns of radon gas circulation as a function of airflow, and three-dimensional radon distribution patterns, based on the radon emanation source and the airflow. The results are very valuable, and the radon pattern
pre-sented helps to understand the experimental results of this work [11].
Later on, Urusevik et al. (2008) published a theoretical study of the indoor
radon distribution and its simulation using a mathematical model. The authors suggest a room with rectangular geometry and “infiltration outlets” of 20 × 20 cm. The results are spectacular and very valuable, showing the spatial distribu-tions of thoron and radon in a series of figures, identifying very well the
influen-cing parameters [9].
Gyorfi and Csige (2011), in the paper “Effect of atmospheric pressure
varia-tions on the 222Rn activity concentration in the air of a wine cellar”, perform the
calculations and mathematical simulation using measurements of radon con-centration variation in an underground cellar room, similar to the “motive” of this work, as function of the barometric variations of atmospheric pressure. The authors found a very peculiar rectangular pattern of distribution of radon inside
of the cellar room, showing a greater concentration in the walls and ceiling [8].
In the same year De With and De Jong (2011) in their proposed “Simulation of thoron and thoron progeny concentrations in the indoor environment”, where the results showed some thoron accumulation on the center, and a
distri-bution on “layers” [10].
DOI: 10.4236/jep.2019.107054 926 Journal of Environmental Protection
of these variations [6].
These published works and many others show the scientific interest and re-levance of the knowledge about the distribution of radon and thoron gases, product of the radioactive disintegration chains of the natural uranium and tho-rium contained in our planet Earth.
6. Conclusions
The distribution of indoor radon concentration inside of an enclosure is not uniform or homogeny; on the contrary, each place specifically presents radon concentrations and peculiar distributions. Because of that, the evaluation of the radon concentration as well as its distribution is a requirement to determine health risks to the population.
The evidence of radon non-homogeneous distribution inside a room is availa-ble, both via simulation and experimental measurements specifically, which con-firm that the indoor radon concentration distribution is very peculiar and local.
It is very important, both from a scientific and health point of view, to
under-stand and know the dynamics of radon gas (220Rn and 222Rn) in different media,
depending on the possible parameters that affect it.
About the dynamics in this case, a small flux of outdoor radon through the concrete and brick walls cellar, and the different density between radon gas and the air in the room, can make this distribution, from the floor to the ceiling in-side the complex.
These variations of indoor radon concentration should be considered in most cases to have real data on indoor radon concentration, areas of greater exposure and areas of lower radiological risk, both for its mitigation and for its control.
All these models and simulations, plus experimental work and measurement, will serve to know and better understand the behavior of the radon gas dynam-ics, depending on the different environmental factors, and thus be able to make a more accurate calculation of doses and the radiological risk in public health by radon.
Acknowledgements
The authors wish to thank to A. Chavarría, P. Carrasco, A. Cortes, M. Cuautle, A. García, N. González, J. Martínez, L. Martínez, L. Novoa and M. Veytia, for their technical help. This work was partially supported by
UNAM-DGAPA-PAPIIT project IN-102819.
Conflicts of Interest
The authors declare no conflicts of interest regarding the publication of this pa-per.
References
DOI: 10.4236/jep.2019.107054 927 Journal of Environmental Protection Indoor Radon Levels in Mexico. Radiation Measurements, 31, 355-358.
[2] Espinosa, G., Golzarri, J.I. Bogard, J., Gaso, I., Ponciano, G., Mena, M. and Segovia, N. (2008) Indoor Radon Measurements in Mexico City. Radiation Measurements, 43, S431-S434. https://doi.org/10.1016/j.radmeas.2008.03.039
[3] Somlai, J., Gorjánácz, Z., Várhegyi, A. and Kovács, T. (2006) Radon Concentration in Houses over a Closed Hungarian Uranium Mine. Science of the Total Environ-ment, 367, 353-365.
[4] Tell, I., Bensryd, I., Rylander, L., Jönsson, G. and Daniel, E. (1994) Geochemistry and Ground Permeability as Determinants of Indoor Radon Concentrations in Southernmost Sweden. AppliedGeochemistry, 9, 647-655.
https://doi.org/10.1016/0883-2927(94)90025-6
[5] Varley, N.R. and Flowers, A.G. (1998) The Influence of Geology on Radon Levels in S.W. England. Radiation Protection Dosimetry, 77, 171-176.
https://doi.org/10.1093/oxfordjournals.rpd.a032307
[6] Akbari, K. and Mahmoudi, J. (1012) Numerical Simulation of Radon Transport and Indoor Air Conditions Effects. International Journal of Scientific & Engineering
Research, 3, 1-9.
[7] Akbari, K. and Mahmoudi, J. (2018) Simulation of Radon Mitigation in Residential Building with Ventilation.
https://pdfs.semanticscholar.org/9b44/fb43cb1719de58a4c01d2565eb58140a86c1.pdf [8] Gyorfi, T. and Csige, I. (2011) Effect of Atmospheric Pressure Variations on the
222Rn Activity Concentration in the Air of a Wine Cellar. Journal of Radioanalytical
and Nuclear Chemistry, 288, 229-232.https://doi.org/10.1007/s10967-010-0947-0
[9] Urosevic, V., Nikezic, D. and Vulovic, S. (2008) A Theoretical Approach to Indoor Radon and Thoron Distribution. Journal of Environmental Radioactivity, 99, 1829-1833. https://doi.org/10.1016/j.jenvrad.2008.07.010
[10] De With, G. and De Jong, P. (2011) Simulation of Thoron and Thoron Progeny Concentrations in the Indoor Environment. Journal of Building Physics, 35, 101-127. https://doi.org/10.1177/1744259111398634
[11] Zhuo, W., Iida, T., Moriizumi, J., Aoyagi, T. and Takahashi, I. (2001) Simulation of the Concentrations and Distributions of Indoor Radon and Thoron. Radiation
Pro-tection Dosimetry, 93, 357-368.https://doi.org/10.1093/oxfordjournals.rpd.a006448
[12] Denman, A.R., Groves-Kirkby, N.P., Groves-Kirkby, C.J., Crockett. R.G.M., Phil-lips, P.S. and Woolridge, A.C. (2007) Health Implications of Radon Distribution in Living Rooms and Bedrooms in U.K. Dwellings—A Case Study in Northampton-shire. Environment International, 33, 999-1011.
https://doi.org/10.1016/j.envint.2007.01.011
[13] Universidad Nacional Autónoma de México (UNAM) (2018) Portal de estadística universitaria. http://www.estadistica.unam.mx/numeralia/
[14] Espinosa, G., Golzarri, J.I., Jaso, I., Mena, M.and Segovia, N. (2013) An Intercom-parison of Indoor Radon Data Using NTD and Different Dynamic Recording Sys-tems. Radiation Measurements, 50, 112-115.
https://doi.org/10.1016/j.radmeas.2012.11.005
[15] Espinosa, G. (1994) Trazas Nucleares en Sólidos. Instituto de Física, Universidad Nacional Autónoma de México.
[16] Espinosa, G. and Gammage, R.B. (2003) A Representative Survey of Indoor Radon in the Sixteen Regions in Mexico City. Radiation Protection Dosimetry, 103, 73-76.
DOI: 10.4236/jep.2019.107054 928 Journal of Environmental Protection [17] Mazur, D., Janik, M., Loskiewicz, J., Olko, P. and Swakon, J. (1999) Measurements of Radon Concentration in Soil Gas by CR-39 Detectors. Radiation Measurements, 31, 295-300. https://doi.org/10.1016/S1350-4487(99)00135-3
[18] Orlando, C., Orlando, P., Patrizii, L., Tommasino, L., Tonnarini, S., Trevisi R. and Viola, P. (2002) A Passive Radon Dosemeter Suitable for Workplaces. Radiation
Protection Dosimetry, 102, 163-168.