Water
Harvesting:
A Source of Livestock
Water
GARY W. FRASIER
Highlight: Water harvesting is a means of supplying stockwater in any area where precipitation is sufficient to grow forage. There are many types of methods and materials which can be used to collect precipitation. Knowledge of the advantages and disadvantages of each treatment is needed to select the method best suited for a given site. Costs of water collected from various treatments range from less than $0.20 per 1,000 gallons to over $6.00 per 1,OOOgallons in a 20-inch precipitation zone.
In many areas of our western rangelands, stockwater can be supplied by a method called water harvesting using structures called trick tanks, rain traps, or cat&rents to collect and store precipitation runoff. Properly designed water harvesting systems are potentially capable of supplying stock drinking water in any area where there is sufficient -precipitation to grow forage. In many places, water harvesting is less costly than alternate means such as hauling or piping.
Water Harvesting Methods
Water harvesting techniques can be divided into five basic methods: (1) vegetation management, (2) natural impervious surfaces, (3) land alteration, (4) chemical treatment of the soil, and (5) ground covers. These methods have a wide range of costs, performance, and durability, which can limit the potential applicability of a treatment (Cooley et al., 1970). Knowledge of the advantages and disadvantages of each method or treatment is needed to select the treatment best suited for a given site.
Vegetation Management
Studies have shown that in some areas, surface runoff can be increased by converting scrub woodland to a grass forage cover (Gifford, 1973). In many places, this method cannot be used as a source of livestock water because of the necessity of constructing major dams or diversion structures in the watershed drainage channel. For some limited locations, it may be possible to collect the runoff water before it reaches the main channel.
Natural Surfaces
The simplest and probably the most durable material for a catchment surface is a large rock outcropping (Fig. 1). Usually all that is necessary to convert the outcropping into a suitable
The author is research hydraulic engineer, U.S. Water Conservation Laboratory, Phoenix, Arizona 85040.
The paper was presented at the 27th Annual Meeting, Society for Range Management, February 3-8, 1974, Tucson, Arizona, under the title “Water Harvesting for Range Management?” by Gary Frasier. Contribution from the Agricultural Research Service, U.S. Department of Agriculture.
Manuscript received September 28, 1974.
cat&n-rent are some small diversion dikes along the lower edge which direct the runoff water into the storage facility. Runoff efficiencies from natural rock surfaces are variable, depending upon the porosity of the base rock and the number and extent of cracks in the surface. Burdass (1975) reported that in Australia, the common practice is to use 45% as the runoff efficiency for rock catchments. On some rock surfaces, the runoff efficiency can be improved by sealing the surface cracks with an asphaltic caulking compound. In some areas, it is possible to compensate for the relatively low runoff efficiency by simply increasing the size of the collection area. Total costs for preparing a rock catchment may be as low as $0.01 per square yard of collecting area (Table 1).
The highways and roads which cross the rangelands can also be used for collecting precipitation (Fig. 2). The full potential of using highways for water harvesting has not been realized because of the concern that the runoff water could be contaminated by oil droppings from the vehicular traffic. Chiarella and Beck (1975) describe a highway catchment system in Arizona used for collecting drinking water for livestock for over 15 years with no observed ill effects. Evans et al. (1975) reported that in Wyoming there are approximately 8 acres of pavement per mile of interstate highway. If we assume a catchment efficiency of 90%, a potential water supply of about 2 million gallons of water is available per mile of highway for every 10 inches of precipitation. The major cost of collecting this water is the expense of a conveyance system from the highway to the storage.
Land Alteration
For the thousands of acres of land where highways or rock outcropping are not available, a livestock water supply can sometimes be developed by simple land alteration treatments which increase the quantity of runoff from the soil surface. Land clearing is the least expensive method of land alteration, but the increase in precipitation runoff is often negligible except for storms of high precipitation intensity and/or long duration. Because the small precipitation events do not always produce satisfactory runoff, it is usually necessary to have relatively large catchment areas and storage structures to provide adequate water to last between the runoff events.
On some soils, the runoff efficiency from land clearing treatments can be effectively increased by additional soil smoothing and/or soil compaction. Land alteration, soil smoothing, and compaction is presently used successfully in Australia in the form of roaded catchments (Frith, 1975). Soil smoothing and compacting treatments are usually more successful on loam or clay loam soils. Care must be taken in the design and construction of this type of treatment to minimize the soil slope and runoff water velocity to reduce any potential soil erosion (Hollick, 1975).
Dedrick, A. R. 1973. Raintrap performance on the Fishlake National Forest. J. Range Manage. 26:9-12.
Dedrick, A. R. 1975. Storage systems for harvested water. In: Proc., Water Harvesting Symp., U.S. Dep. Agr., Agr. Res. Serv. ARS W-22, p. 175-191.
Dutt, G. R., and T. W. McCreary. 1975. Multipurpose salt treated water harvesting system. In: Proc., Water Harvesting Symp., U.S. Dep. Agr.,Agr. Res. Serv. ARS W-22, p. 310-314.
Evans, C. E., D. A. Woolhiser, and F. Rauzi. 1975. Opportunity for harvesting water from and along highways in rangeland areas of Wyoming. In: Proc., Water Harvesting Symp., U.S. Dep. Agr., Agr. Res. Serv. ARS W-22, p. 293-301.
Fink, D. H., K. R. Cooley, and G. W. Frasier. 1973. Wax-treated soils for harvesting water. J. Range Manage. 26:396-398.
Frasier, G. W., and L. E. Myers. 1970. Protective spray coatings for water harvesting catchments. Trans. Amer. Sot. Agr. Eng. 13:292-294.
Frasier, G. W. 1975. Water harvesting for livestock, wildlife, and domestic use. In: Proc., Water Harvesting Symp., U.S. Dep. Agr., Agr. Res. Serv. ARS W-22, p. 4049.
Frith, J. L. 1975. Design and construction of roaded catchments. In: Proc., Water Harvesting Symp., U.S. Dep. Agr., Agr. Res. Serv. ARS W-22, p. 122-127.
Gifford, G. F. 1973. Runoff and sediment yield from runoff plots on chained pinyonjuniper sites in Utah. J. Range Manage. 26:440-443. HoIIick, M. 1975. The design of roaded catchments for maximum runoff. In: Proc., Water Harvesting Symp., U.S. Dep. Agr., Agr. Res. Serv. ARS W-22, p. 201-220.
Lawitzen, C. W. 1967. Raintraps of steel. Utah Science, Sept., p. 79-81. Lauritzen, C. W., and A. A. Thayer. 1966. Raintraps for intercepting
and storing water for livestock. U.S. Dep. Agr., Agr. Res. Serv. Agr. Inform. Bull. 307.
Myers, L. E., and G. W. Frasier. 1969. Creating hydrophobic soil for water harvesting. J. Irrig. and Drain. Div., Amer. Sot. Civil Eng. Proc. 95 (IR 1) :43-54.
Myers, L. E., and G. W. Frasier. 1974. Asphalt-fiberglass for precipitation catchments. J. Range Manage. 27 : 12-l 4.
Reginato, R. J., F. S. Nakayama, and J. B. Miller. 1973. Reducing seepage from stock tanks with uncompacted sodium-treated soils. J. Soil and Water Conserv. 28:214-215.
Cattle
Grazing
and Wood
Production
with
Different
Basal Areas
of Ponderosa
Pine
WARREN I’. CLARY, WILLIAM H. KRUSE, AND
Highlight: Ponderosa pine stands were thinned to various basal areas on the Wild Bill Range near Flagstaff, Arizona, to determine the effects on beef and wood production. Beef gain potential was maximum at zero basal area and was one-third less when ponderosa pine was present at basal areas of 20 ft2/acre. Physical relationships and the 1972 prices suggest that the combined economic value of grazing and saw log production would be maximum in tree stands having a basal area of about 45 to 60 ft2/acre.
Cattle grazing and timber production, two major uses of forested lands, are often competitive. Trees strongly influence livestock production through their effect on forage plants. Although the relationships of forage yields to tree overstory stocking have been documented in many locations (Ffolliott and Clary, 1972), little information is available on the direct relationship of livestock production to wood production or to an index of tree dominance such as tree basal area.
Production economics, which examines relationships among various resource values, provides a useful framework to determine the best use or combination of uses of public lands (Lloyd, 1969; O’Connell and Brown, 1972). Typical production economics procedures utilize production functions and product-product relationships, usually to optimize economic returns. While the primary goal of public land
Authors are with the Forest Service, U.S. Department of Agriculture, with central headquarters maintained at Fort Collins, in cooperation with Colorado State University. Clary, principal plant ecologist; Kruse, range research technician; and Larson, associate silviculturist, are located at the Station’s Research Work Unit at Flagstaff, in cooperation with Northern Arizona University.
Manuscript received December 10, 1974.
FREDERIC R. LARSON
managers is rarely to optimize economic returns, these relationships can help form an effective framework for land management decisions.
Studies of the Wild Bill Range, established in the early 1960’s near Flagstaff, Ariz., provide a basis to determine such product-product relationships. One of the objectives at Wild Bill was to determine the effects on beef production and timber production when tree stands are thinned to different basal area levels. This information should be useful for land managers, economic planners, and others who are interested in managing forested lands more effectively.
Study Area and Methods
The Wild Bill study area is on a ponderosa pine (Pinus ponderosa Laws.)-bunchgrass range (Pearson and Jameson,
1967). Elevation is 7,600 ft, and the land is generally level to moderately sloping with a southwest aspect. Soils are gravelly silt loam, derived from basalt.
This study utilized one clearcut range unit, four thinned range units, and a control range unit. In 1967, approximately two-thirds of the original control unit was consumed by wildfire and another unit was substituted as the control. The principal forage species were Arizona fescue (Festuca arizonica Vasey) and mountain muhly (Muhlenbergia montana (Nutt.) Hitchc.).
Livestock management and forage measurements were described by Pearson (1972). Tree basal area was reduced to predetermined growing stock levels during 1963 and 1964. The tree stands were inventoried in 1971 by point sampling techniques (Grosenbaugh, 1958), the sample trees were bored to determine growth rates, and volumes (Ffolliott et al., 197 1) were computed for the beginning and end of the study. The
Dedrick, A. R. 1973. Raintrap performance on the Fishlake National F&h, J. L. 1975. Design and construction of roaded catchments. In: Forest. J. Range Manage. 26:9-12. Proc., Water Harvesting Symp., U.S. Dep. Agr., Agr. Res. Serv. ARS Dedrick, A. R. 1975. Storage systems for harvested water. In: Proc., W-22, p. 122-127.
Water Harvesting Symp., U.S. Dep. Agr., Agr. Res. Serv. ARS W-22, Gifford, G. F. 1973. Runoff and sediment yield from runoff plots on
p. 175-191. chained pinyonjuniper sites in Utah. J. Range Manage. 26:440443.
Dutt, G. R., and T. W. McCreary. 1975. Multipurpose salt treated water Hollick, M. 1975. The design of roaded catchments for maximum harvesting system. In: Proc., Water Harvesting Symp., U.S. Dep. runoff. In: Proc., Water Harvesting Symp., U.S. Dep. Agr., Agr. Res. Agr.,Agr. Res. Serv. ARS W-22, p. 310-314. Serv. ARS W-22, p. 201-220.
Evans, C. E., D. A. Woolhiser, and F. Rauzi. 1975. Opportunity for Lauritzen, C. W. 1967. Raintraps of steel. Utah Science, Sept., p. 79-81. harvesting water from and along highways in rangeland areas of Lauritzen, C. W., and A. A. Thayer. 1966. Raintraps for intercepting Wyoming. In: Proc., Water Harvesting Symp., U.S. Dep. Agr., Agr. and storing water for livestock. U.S. Dep. Agr., Agr. Res. Serv. Agr.
Res. Serv. ARS W-22, p. 293-301. Inform. Bull. 307.
Fink, D. H., K. R. Cooley, and G. W. Frasier. 1973. Wax-treated soils Myers, L. E., and G. W. Frasier. 1969. Creating hydrophobic soil for for harvesting water. J. Range Manage. 26:396-398. water harvesting. J. Irrig. and Drain. Div., Amer. Sot. Civil Eng. Frasier, G. W., and L. E. Myers. 1970. Protective spray coatings for Proc. 95(IR 1):43-54.
water harvesting catchments. Trans. Amer. Sot. Agr. Eng. Myers, L. E., and G. W. Frasier. 1974. Asphalt-fiberglass for
13:292-294. precipitation catchments. J. Range Manage. 27:12-14.
Frasier, G. W. 1975. Water harvesting for livestock, wildlife, and Reginato, R. J., F. S. Nakayama, and J. B. Miller. 1973. Reducing domestic use. In: Proc., Water Harvesting Symp., U.S. Dep. Agr., seepage from stock tanks with uncompacted sodium-treated soils. J. Agr. Res. Serv. ARS W-22, p. 4049. Soil and Water Conserv. 28:214-215.
Cattle
Grazing
and Wood
Production
with
Different
Basal Areas
of Ponderosa
Pine
WARREN P. CLARY, WILLIAM H. KRUSE, AND FREDERIC R. LARSON
Highlight: Ponderosa pine stands were thinned to various basal areas on the Wild Bill Range near Flagstaff, Arizona, to determine the effects on beef and wood production. Beef gain potential was maximum at zero basal area and was one-third less when ponderosa pine was present at basal areas of 20 ft2/acre. Physical relationships and the 1972 prices suggest that the combined economic value of grazing and saw log production would be maximum in tree stands having a basal area of about 4.5 to 60 ft2/acre.
Cattle grazing and timber production, two major uses of forested lands, are often competitive. Trees strongly influence livestock production through their effect on forage plants. Although the relationships of forage yields to tree overstory stocking have been documented in many locations (Ffolliott and Clary, 1972), little information is available on the direct relationship of livestock production to wood production or to an index of tree dominance such as tree basal area.
Production economics, which examines relationships among various resource values, provides a useful framework to determine the best use or combination of uses of public lands (Lloyd, 1969; O’Connell and Brown, 1972). Typical production economics procedures utilize production functions and product-product relationships, usually to optimize economic returns. While the primary goal of public land
Authors are with the Forest Service, U.S. Department of Agriculture, with central headquarters maintained at Fort Collins, in cooperation with Colorado State University. Clary, principal plant ecologist; Kruse, range research technician; and Larson, associate silviculturist, are located at the Station’s Research Work Unit at Flagstaff, in cooperation with Northern Arizona University.
Manuscript received December 10, 1974.
434
managers is rarely to optimize economic returns, these relationships can help form an effective framework for land management decisions.
Studies of the Wild Bill Range, established in the early 1960’s near Flagstaff, Ariz., provide a basis to determine such product-product relationships. One of the objectives at Wild Bill was to determine the effects on beef production and timber production when tree stands are thinned to different basal area levels. This information should be useful for land managers, economic planners, and others who are interested in managing forested lands more effectively.
Study Area and Methods
The Wild Bill study area is on a ponderosa pine (Pinus ponderosa Laws.)-bunchgrass range (Pearson and Jameson,
1967). Elevation is 7,600 ft, and the land is generally level to moderately sloping with a southwest aspect. Soils are gravelly silt loam, derived from basalt.
This study utilized one clearcut range unit, four thinned range units, and a control range unit. In 1967, approximately two-thirds of the original control unit was consumed by wildfire and another unit was substituted as the control. The principal forage species were Arizona fescue (Festuca arizonica Vasey) and mountain muhly (Muhlenbergia montana (Nutt.) Hitchc.).
Table 1. Characteristics of the Wild Bill Range units-averages for 1965-1971.
Range unit and treatment
Characteristic
2 3
(Clear) (Thin)
4 (Thin)
5 (Thin)
6 (Thin)
7 8
(Control (Control to 1966) from 1967) Tree basal area (ft* /acre)
Tree crown cover (%) Annual bolewood production
Total (ft3/acre) Merchantable (ft3 /acre) Merchantable (bd ft/acre) Annual understory production
Grass (lb/acre) Forb (lb/acre) Shrub (lb/acre) Total (lb/acre) Beef gain (lb/acre/year) Yearling days/acre/year
0 215 1
0 12* 1
0 17* 1
0 18k 3
0 73+ 6
447 485
540 77
2 7
989 + 34 569 + 29 31.8 + 3.5 22.0 + 4.4 22.5 * 3.1 15.8 f 2.7
31* 3 505 4 62+ 6
21+ 3 302 3 33+ 3
31+ 3 29* 2 32~~. 3
31 * 4 24+ 3 31 -k 4 68* 12 88* 11 120 f. 17
374 263 199
87 77 48
2
463 + 63 34: * 50 24; + 33 17.0 f 2.4 12.9 f 1.7 10.6 + 1.7 14.0 + 1.5 10.5 + 1.7 7.6 + 1.3
130+99 1095 8 60 + 5 582 3
- 49 + 5
- 35 + 5
- 50+9
39 149
17 23
0 T
5656 172 f 15
1.450.2 -
2.OkO.l -
average tree diameter was 7% inches although considerable variation was present.
Grazing studies were initiated in 1965 and continued through 1971. Yearling cattle, supplied by forest permittees, grazed the Wild Bill Range from June through September each year.
Product Relationships
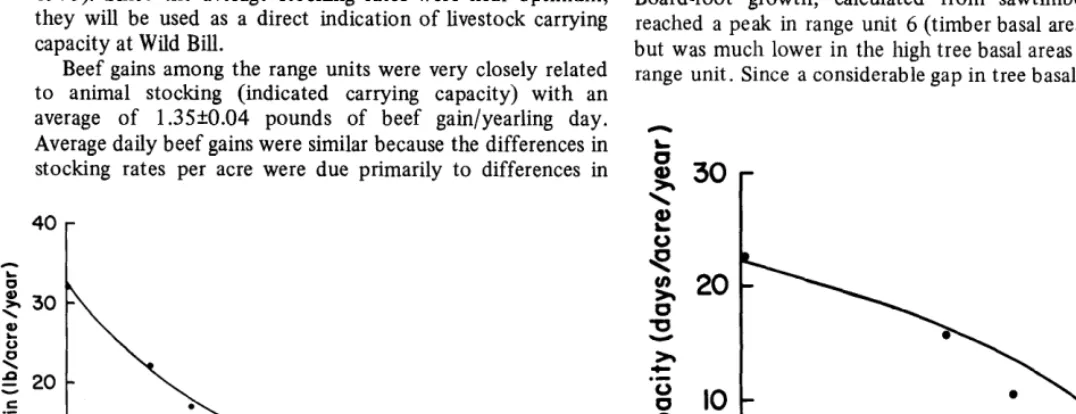
Beef gains on the different range units were closely related to the amount of tree overstory, due to differences in forage production (Table 1). One-third (29 to 34%) of the beef gain potential was lost as the tree basal area increased from 0 to 20 ft2/acre (Fig. 1). This relationship demonstrates the large differences in average annual beef gain potential at different levels of tree basal area.
Animal stocking rates were such that average forage utilization varied from 24 to 33% with an overall mean of 28%--close to rates required for maximum profit (Pearson,
1973). Since the average stocking rates were near optimum, they will be used as a direct indication of livestock carrying capacity at Wild Bill.
Beef gains among the range units were very closely related to animal stocking (indicated carrying capacity) with an average of 1.35kO.04 pounds of beef gain/yearling day. Average daily beef gains were similar because the differences in stocking rates per acre were due primarily to differences in
forage production and not to differences in utilization levels. Livestock carrying capacity was inversely and linearly related to totaZ tree volume growth. A similar relationship has been described for central Arizona (Ffolliott and Clary, 1974). However, when only the increment of volume on
merchantable stems is considered, the function is curvilinear (Fig. 2). The downward curve results from relatively little more merchantable volume growth on range units with greater tree stocking than on those units where tree stocking has been somewhat reduced. Range units with greater stand basal areas had more trees in small nonmerchantable sizes (<6 inches dbh) and a lower average tree diameter. Thinning operations tended to remove these smaller trees, thus increasing the average tree diameter of the residual stand, and merchantable volume growth more nearly equaled total volume growth in the thinned range units.
The relationship of livestock carrying capacity to board-foot volume growth has a quite different form. Board-foot growth, calculated from sawtimber-sized trees, reached a peak in range unit 6 (timber basal area 62 ft2/acre), but was much lower in the high tree basal areas of the control range unit. Since a considerable gap in tree basal area occurred
h
L -
g 30 r
20
IO
1
I I I I I .
L
0’
IO20
30
40
20 40 60 80 100 120
Tree basal area (ft2/acre)
140 0
Timber
volume growth (ft3/acre/yeor)
Fig. 1. Relationship of beef gain to tree basal area. Fig. merchantable timber volume growth. 2. Relationship between livestock carrying capacity and
\
I
-s
L-+I
g
20 60 too 140 180
Basal area (ft*/acre)
Fig. 3. Board-foot production in relation to ponderosa pine basalarea. (Taylor Woods data from Schubert 1974.)
between range unit 6 and the control range unit, the pattern of tree growth was compared to that of nearby Taylor Woods (Schubert, 1974). Results from both areas demonstrate a pronounced peak of board-foot growth at about 60 ft2 of tree basal area per acre (Fig. 3). Because average beef gain and livestock carrying capacity are closely correlated with tree basal area, and because the peak of board-foot growth appears to be fairly assured at about 60 ft2 of tree basal area, we have fitted a curve to the data comparing livestock carrying capacity and board-foot growth (Fig. 4). The fit of the calculated relationship is not tight, but it is logical and is supported by the results described above.
At higher tree basal areas, the relationship between livestock carrying capacity and sawtimber growth is complementary (O’Connell and Brown, 1972) because production of both can be increased with a partial reduction in tree basal area. After a certain point, continued reductions in basal area reduce sawtimber growth, and grazing and timber production become competitive (Fig. 4).
Economic Relationships
The shapes of these curves are important in determining economic optimum product mixes. In relationships where the two products substitute for one another at a constant rate, the best economic solution is usually to specialize in production of either one product or the other (Lloyd, 1969). In relationships of the type illustrated in Figs. 2 and 4, where the relationships are nonlinear and convex outward, the rates of substitution are variable. In such cases an economic optimum can usually be obtained only by producing some of both products.
Determining the true net economic values of different products having different cost inputs, such as livestock pasturage (which is used annually) and cubic feet of wood (which is produced annually, but harvested periodically), requires careful consideration. When considering public lands, the inputs of public monies should also be considered for each level of management.
The rental value of livestock carrying capacity (or pasturage), which excludes the additional cost of labor and capital to produce beef, is more easily determined and evaluated than is the net value of beef gain as such. Therefore, livestock carrying capacity was the range measure selected for comparison with wood production to ascertain which
I(0 ft2BA)
40 60 80
Growth (bf/acre/year)
Fig. 4. Relationship between livestock carrying capacity and board-foot timber volume growth.
combination of these two forest outputs yield the greatest dollar value. The primary wood product from southwestern national forests is sawtimber; therefore board-foot volume growth was the wood product measure selected for the economic evaluation. Product values in 1972 were $99.55/Mbf for saw log stumpage and $5.82/animal unit month for grazing (O’Connell and Boster, 1974). Corresponding unit values are 10 cents/board-foot of timber and 12 cents/yearling-day.
Assuming all points on the curve in Figure 4 represent equal costs to management over a planning horizon, the maximum economic output would be at 100 bd ft of timber/acre/year and 10.5 yearling-days of grazing/acre/year (point C). At this point the marginal rate of substitution of the two products is tangent with the ratio of the two product values. Animal carrying capacity is maximum at point D and sawtimber production is maximum at point B. Point A represents untreated conditions, or no tree removals. As more trees are removed in the initial treatment (moving up the curve from point A toward point D) more initial costs are incurred. The cost of completely converting a ponderosa pine stand to grass (point D) is $30 to $4O/acre more expensive (Turner and Larson, 1974) than managing the stand at point C. When variations in costs for initial stand improvement are included, the economic optimum level of management moves to some point between points C and B, or between, say, about 45l and 60 ft2 of tree basal area.
It does not appear that this economic optimum range of basal area is likely to change much over time. The point of optimum product-product yield will not occur at tree basal areas greater than that at point B (for conditions similar to Wild Bill) because it represents maximum timber yields. On the other hand, the value of animal products would have to increase substantially in relation to timber products in order to lower the economic optimum tree basal area level below that at point C, because of increasing costs to further reduce basal area levels. Therefore, it appears that the basal area range of approximately 45 to 60 ft2 which was the economic optimum in 1972 may hold generally true for some time to come.
’ Estimated from the carrying capacity-tree basal area relationship.
Summary
The presence of ponderosa pine in any density will probably decrease the beef gain potential or livestock carrying capacity. In fact, about one-third of the maximum beef gain potential on Wild Bill was lost as tree stands approached 20 ft2 basal area/acre. Conversely, thinning dense tree stands can improve the livestock potential while at the same time maintaining or improving wood yields on merchantable stems. The economic optimum combination between animal production and wood production will vary according to whether the wood production is considered in all size classes
or whether it is considered only in larger size classes.
The physical product-product relationship together with the 1972 unit prices suggest that the combination of product values would have peaked at approximately 45 to 60 ft2 of tree basal area when managing for both livestock carrying capacity and board-foot yield in trees averaging 5 to 10 inches diameter.
Literature Cited
Ffolliott, Peter F., Frederic R. Larson, and Roland L. Barger. 1971. Predicting scaled volume recoverable from cutover southwestern ponderosa pine stands. U.S. Dep. Agr. Forest Serv. Res. Note RM-195. Rocky Mountain Forest and Range Exp. Sta., Fort Collins, Colo. 8 p.
Ffolliott, Peter F., and Warren P. Clary. 1972. A selected and annotated bibliography of understory-overstory vegetation relationships. Ariz. Agr. Exp. Sta. Tech Bull. 198. 33 p.
Ffoflio& Peter F., and Warren P. Clary. 1974. Predicting herbage production from forest growth in Arizona ponderosa pine. Prog. Agr. Ariz. 26(3):3-5.
Grosenbaugh, L. R. 1958. Point-sampling and line sampling: probability theory, geometric implications, synthesis. U.S. Dep. Agr. Forest Serv., South. Forest Exp. Sta., Occas. Pap. 160. New Orleans, La. 34 p.
Lloyd, R. Duane. 1969. Economics of multiple-use. Conf. on Multiple-Use of Southern Forests Proc. 1969:45-54.
O’Connell, Paul F., and Ron S. Baster. 1974. Demands on national forests require coordinated planning. Ariz. Rev. 23(2):1-7.
O’Connell, Paul F., and Harry E. Brown. 1972. Use of production functions to evaluate multiple use treatments on forested watersheds. Water Resour. Res. 8: 1188-l 198.
Pearson, Henry A. 1972. Estimating cattle gains from consumption of digestible forage on ponderosa pine range. J. Range Manage. 25 : 18-20.
Pearson, Henry A. 1973. Calculating grazing intensity for maximum profit on ponderosa pine range in northern Arizona. J. Range Manage. 26:277-278.
Pearson, {Henry A., and Donald A. Jameson. 1967. Relationship between timber and cattle production on ponderosa pine range: The Wild Bill Range. Rocky Mountain Forest and Range Exp. Sta., Fort Collins, Colo. 10 p.
Schubert, Gilbert H. 1974. Silviculture of southwestern ponderosa pine: The status of our knowledge. U.S. Dep. Agr. Forest Serv. Res. Pap. RM-123. Rocky Mountain Forest and Range Exp. Sta., Fort Collins, Colo. 71 p.
Turner, James M., and Frederic R. Larson. 1974. Cost analysis of experimental treatments on ponderosa pine watersheds. U.S. Dep. Agr. Forest Serv. Res. Pap. RM-116. Rocky Mountain Forest and Range Exp. Sta., Fort Collins, Colo. 12 p.
EEEI
.
Cost and Returns
from
Reseeding
Plains
Ranges
in Wyoming
W. GORDON KEARL AND ROBERT V. CORDINGLY
Highlight: Variable costs of reseeding 64 range sites totaling over 10,000 acres of plains type range in Wyoming averaged $14.26 per acre, and total costs averaged $16.31 per acre at 1972 cost levels. Information obtained from the ranch operators, together with experimental information from various sources and budgeting methods over time, were used to estimate a flow of returns. Investment costs of the reseeding occur immediately, as do costs for deferment. In the third year after reseeding, some beneficial effects are achieved. Full benefits of reseeding, including a higher percentage calf crop and a larger number of heavier yearlings available for sale, are not achieved until the fifth year. Allowing for the lag in response, the rate of return on reseeding Wyoming plains ranges is estimated at approximately 21.5% at 1972 cost and price levels.
Over 80% of Wyoming’s 62.4 million acres are classified as range and pasture land. Although the primary use of range in Wyoming is grazing, much of the land is not producing forage at its potential economic or physical level.
Authors are professor of agricultural economics, University of Wyoming, Laramie; formerly graduate assistant, Division of Agricultural Economics, University of Wyoming, Laramie.
Manusciipt received February 3, 1975.
JOURNAL OF RANGE MANAGEMENT 28(6), November 1975
The objectives of this study were to determine practices and inputs used, costs, and returns from reseeding ranges. Information was obtained from ranchers and farmers in the eastern or Great Plains counties of Wyoming through personal interviews. Usable responses were obtained from 30 ranch operators who had reseeded 64 range sites totaling about 10,000 acres prior to 1973.
The following criteria by C. W. Cook (1966) represent suggestions when converting sagebrush range into seeded grassland :
1) Annual precipitation should be at least 11 inches and 13- 14 inches for best results.
2) Soils should be 24 inches deep to allow roots to become properly established.
It should be noted many of the sites where range reseeding was done on ranches in Wyoming met the precipitation requirement, but would be considered marginal with respect to these soil criteria.
Inputs Required and Costs
Data were obtained on methods of seedbed preparation and planting, physical inputs used, and costs at the time reseeding was done. Costs were then calculated at 1972 price levels to
Summary
The presence of ponderosa pine in any density will probably decrease the beef gain potential or livestock carrying capacity. In fact, about one-third of the maximum beef gain potential on Wild Bill was lost as tree stands approached 20 ft2 basal area/acre. Conversely, thinning dense tree stands can improve the livestock potential while at the same time maintaining or improving wood yields on merchantable stems. The economic optimum combination between animal production and wood production will vary according to whether the wood production is considered in all size classes or whether it is considered only in larger size classes.
The physical product-product relationship together with the 1972 unit prices suggest that the combination of product values would have peaked at approximately 45 to 60 ft2 of tree basal area when managing for both livestock carrying capacity and board-foot yield in trees averaging 5 to 10 inches diameter.
Literature Cited
Ffolliott, Peter F., Frederic R. Larson, and Roland L. Barger. 1971. Predicting scaled volume recoverable from cutover southwestern ponderosa pine stands. U.S. Dep. Agr. Forest Serv. Res. Note RM-195. Rocky Mountain Forest and Range Exp. Sta., Fort Collins, Colo. 8 p.
Ffolliott, Peter F., and Warren P. Clary. 1972. A selected and annotated bibliography of understory-overstory vegetation relationships. Ariz. Agr. Exp. Sta. Tech Bull. 198. 33 p.
Ffollio& Peter F., and Warren P. Clary. 1974. Predicting herbage production from forest growth in Arizona ponderosa pine. Prog. Agr. Ariz. 26(3):3-5.
Grosenbaugh, L. R. 1958. Point-sampling and line sampling: probability
theory, geometric implications, synthesis. U.S. Dep. Agr. Forest Serv., South. Forest Exp. Sta., Occas. Pap. 160. New Orleans, La. 34 p.
Lloyd, R. Duane. 1969. Economics of multiple-use. Conf. on Multiple-Use of Southern Forests Proc. 1969:45-54.
O’Connell, Paul F., and Ron S. Boster. 1974. Demands on national forests require coordinated planning. Ariz. Rev. 23(2) : l-7. O’Connell, Paul F., and Harry E. Brown. 1972. Use of production
functions to evaluate multiple use treatments on forested watersheds. Water Resour. Res. 8:1188-l 198.
Pearson, Henry A. 1972. Estimating cattle gains from consumption of digestible forage on ponderosa pine range. J. Range Manage. 25:18-20.
Pearson, Henry A. 1973. Calculating grazing intensity for maximum profit on ponderosa pine range in northern Arizona. J. Range Manage. 26:277-278.
Pearson, Henry A., and Donald A. Jameson. 1967. Relationship between timber and cattle production on ponderosa pine range: The Wild Bill Range. Rocky Mountain Forest and Range Exp. Sta., Fort Collins, Colo. 10 p.
Schubert, Gilbert H. 1974. Silviculture of southwestern ponderosa pine: The status of our knowledge. U.S. Dep. Agr. Forest Serv. Res. Pap. RM-123. Rocky Mountain Forest and Range Exp. Sta., Fort Collins, Colo. 71 p.
Turner, James M., and Frederic R. Larson. 1974. Cost analysis of experimental treatments on ponderosa pine watersheds. U.S. Dep. Agr. Forest Serv. Res. Pap. RM-116. Rocky Mountain Forest and Range Exp. Sta., Fort Collins, Colo. 12 p.
WIG)
,
Cost and Returns
from
Reseeding
Plains
Ranges
in Wyoming
W. GORDON KEARL AND ROBERT V. CORDINGLY
Highlight: Variable costs of reseeding 64 range sites totaling over 10,000 acres of plains type range in Wyoming averaged $14.26 per acre, and total costs averaged $16.31 per acre at 1972 cost levels. Information obtained from the ranch operators, together with experimental information from various sources and budgeting methods over time, were used to estimate a flow of returns. Investment costs of the reseeding occur immediately, as do costs for deferment. In the third year after reseeding, some beneficial effects are achieved. Full benefits of reseeding, including a higher percentage calf crop and a larger number of heavier yearlings available for sale, are not achieved until the fifth year. Allowing for the lag in response, the rate of return on reseeding Wyoming plains ranges is estimated at approximately 21.5% at 1972 cost and price levels.
Over 80% of Wyoming’s 62.4 million acres are classified as range and pasture land. Although the primary use of range in Wyoming is grazing, much of the land is not producing forage at its potential economic or physical level.
Authors are professor of agricultural economics, UniVerSitY Of
Wyoming, Laramie; formerly graduate assistant, Division of Agricultural Economics, University of Wyoming, Laramie.
Manuscript received February 3, 1975.
JOURNAL OF RANGE MANAGEMENT 28(6), November 1975
The objectives of this study were to determine practices and inputs used, costs, and returns from reseeding ranges. Information was obtained from ranchers and farmers in the eastern or Great Plains counties of Wyoming through personal interviews. Usable responses were obtained from 30 ranch operators who had reseeded 64 range sites totaling about 10,000 acres prior to 1973.
The following criteria by C. W. Cook (1966) represent suggestions when converting sagebrush range into seeded grassland :
1) Annual precipitation should be at least 11 inches and 13- 14 inches for best results.
2) Soils should be 24 inches deep to allow roots to become properly established.
It should be noted many of the sites where range reseeding was done on ranches in Wyoming met the precipitation requirement, but would be considered marginal with respect to these soil criteria.
Inputs Required and Costs
Data were obtained on methods of seedbed preparation and planting, physical inputs used, and costs at the time reseeding was done. Costs were then calculated at 1972 price levels to
Table 1. Input requirements and costs of range reseeding.
Moldboard Disk Offset
Item plow plow disk
Operators 9 7 6
Reseedings 25 12 17
Acres
Total 1,207 1,850 5,695
Average 48 154 335
Man-hours, average per acre’
Primary tillage .96 .64 .64
Other tihage 1.10 .30 .25
Planting .37 .33 .26
Cost per acre
Labor $6.22 $3.22 $2.93
Fuel 1.92 .91 1.11
Repairs 3.23 1.67 2.54
Seed 5.00 5.16 4.64
Other .23 3.80 .60
Sub-total 16.60 14.76 11.82
Fixed costs 2.98 1.28 1.55
Total costs 19.58 16.04 13.37
Range
From 12.80 11.10 9.44
To 29.70 22.13 17.73
’ Tractor and implement time are about 10% less than man-hours.
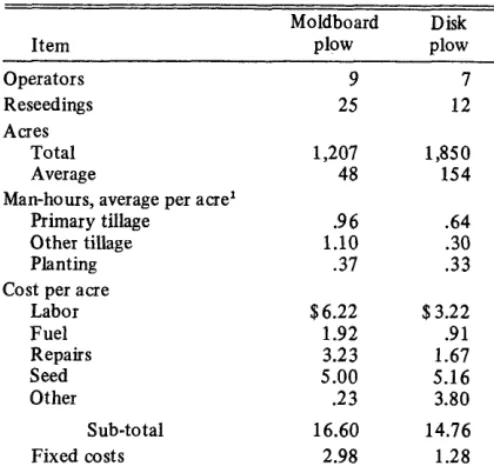
give a standard base for reference and comparisons. Fixed costs, including depreciation, interest on machinery investment, and taxes, were prorated between machinery use for reseeding and other uses for the machine on the ranch. Most of the machinery was used for other purposes also, reducing the fixed costs chargeable to reseeding.
Five tillage methods-moldboard plowing, disk plowing, chiseling, offset disking, and tandem disking-were used and data for three methods used by 22 operators were presented in Table 1. Two operators reseeded 190 acres using tandem disking as the primary tillage method at a total cost of $12.17/acre. Four operators reseeded 595 acres using a chisel for tillage at a cost of $13.09/acre. Two other operators used combinations of custom work and noncustom work. Elimination of competition through complete tillage and good seedbed preparation was important to successful reseeding. Any of the tillage methods which accomplished these things would be satisfactory from a biological standpoint.
Crested wheatgrass (Agropyron desertorum or Agropyron cristatum) was used on about 75% of the acreage. Other wheatgrasses were also seeded, as was Russian wildrye (Elymus junceus). Alfalfa and clovers (Medicago media, Medicago sativa, Melilotus officinales, or Trifolium hybridurn) were seeded on 27 of the range sites and about 30% of the acreage. The average planting rate of grass and legumes seeded on the 64 sites surveyed was about 11 lb/acre. That amount of seed insured rapid establishment and productive stands.
A small grain nurse or cover crop was planted on seven of the reseeding sites to reduce wind or water erosion and protect sandy textured soils. The nurse crop was pastured or harvested as hay or grain, depending on the specific climatic and growing conditions.
Effects on Forage and Livestock
Forage Production
Estimates of forage production and carrying capacities before and after reseeding were also obtained. Percentage
Table 2. Effect of reseeding on forage production.’
Moldboard Disk Offset
Item plow plow Chisel disk
Operators 10 7 5 6
Reseedings 26 12 7 17
Acres 1,337 1,850 1,235 5,695
Production-AUMs/acre
Before .29 .20 .37 .29
After .76 .81 1.00 .69
Percentage change
After/before 262% 405% 270% 238%
Increase 162% 305% 170% 138%
’ Includes results of the chisel method done on a custom basis and one moldboard plow method which was excluded from the cost summary because it was a combination of custom and operator performance.
increases in forage according to reseeding method varied from 138% to 305%. The average carrying capacities of native range before reseeding varied from .20 to .37 AI-M/acre. Average carrying capacities of reseeded range varied from .69 to 1 .O AUM/acre (Table 2).
The increased forage production results were consistent with results found in many experiments and other studies of reseeding (Barnes and Nelson, 1950; Bedell, 1973; Campbell, 1963; Cook, 1966; Cook et al., 1967; Frischknecht and Harris, 1968; Houston and Urick, 1972; Hull, 1972a, 1972b; Hull and Klomp, 1966; Jeffries et al., 1967; Pingrey and Dortignac,
1959; Rauzi et al., 1971; Rumsey, 1961). Forage production results from a few of those studies are summarized in Table 3. Crested wheatgrass compared very favorably with other wheatgrasses or Russian wildrye in any of these studies where comparisons were made.
Reseeding was very successful, as only two seedings totaling 90 acres, or less than 1% of the 10,000 reseeded acres, failed. Both failures, one caused by a very heavy rain and one unexplained, were successfully established by replanting. Annual weed infestations the first year after seeding were a problem on some sites and were treated by spraying or mowing.
Table 3. Summary of forage production results of selected crested wheatgrass range reseedings in the northern plains and Intermountain areas.
Location and Native
time of experiment Unit of measure range Reseeded Utah, 1956-64l
Eureka lb/acre, air dry 190 1,148
Benmore lb/acre, air dry 199 965
Miles City, 1964-682 lb/acre, air dry 410 1,680
Idaho, 1955-643
Blackfoot lb/acre, air dry - 1,187
Raft River Ib/acre, air dry - 1,169
Wyoming
Archer, 1942-4g4 ewe and Iamb days 60 143
Gillette, 1959-62’ cow and calf days 8 16
Wheatland, 19716 lb/acre, air dry - 701
Archer, 197 1-72’j Ib/acre, air dry - 1,177
Archer, 1965-69’ lb/acre, air dry - 762
Gillette, 1965-69’ lb/acre, air dry - 513
‘Cook, 1966.
2 Houston and Urick, 1972. Crested wheatgrass-alfalfa mixture. 3 Hull and Klomp, 1966.
4 Barnes and Nelson, 1950. 5 Jeffries et al., 1967. 6Bedell, 1973. ‘Rauzi et al., 1971.
Table 4. Summary of cattle performance (lb/head, avg daily gain) factors for early spring grazing on selected range reseedings in the northern plains and Intermountain areas.
~~
Location, dates, and kind of animal
Native
range Reseeded
Benmore, Utah, 1956-64l cows
Calves
Cebolla Mesa, N. Mex., 1953-572 cows
Calves No Agua, N. Mex.2
Yearlings
1.02 1.73
1.37 2.02
1.21 3.23
1.16 2.18
1.50 2.15
Sources: 1 Cook, 19 66. 2 Springfield, 19 63.
Ranch operators generally did not give specific information on the amounts livestock gained and the percentage increases in calf crop due to grazing reseeded range. They did give general impressions that increased weight gains and increased calf crops were livestock benefits resulting from grazing reseeded ranges, which were consistent with experimental results.
Experimental results have shown calves and yearlings increased gains about 20 lb/season or more through grazing reseeded ranges from 4 to 6 weeks in the spring (Cook, 1966; Frischknecht and Harris, 1968; Springfield, 1963). The same studies showed large advantages in producing gains on cows between calving and breeding seasons (Table 4). That would suggest a flushing effect. A grazing trial at Fort Robinson, Nebr., did indicate beneficial effects (Anonymous, 1964). Higher percentages of 3-year-old cows were in heat within 50, 70, or 90 days after calving when grazing crested wheatgrass than when grazing native ranges (Table 5). Such performance should allow advancing calving dates and closer bunching of calf crop.
Grazing comparisons of reseeded and native ranges in southeastern Montana found that breeding herds grazing reseeded ranges in the spring weaned about 10% more calves than breeding herds grazing native spring ranges (Houston and Urick, 1972).
Other Benefits or Problems
A number of operators reported the grazing season was lengthened because of earlier grazing of the reseeding before the native species were ready. Increased spring pasture forage reduced the winter feed requirements on some operations. Special use calving and breeding pastures were often developed through range reseeding programs.
Deferment of grazing on reseeded sites, a recommended practice, was generally used, and varied from 1 to 3 years.
Table 5. Percent of 3-yearald cows returning in heat within different periods after calving, Fort Robinson, Nebr.
Post-calving pasture
Days after calving Crested wheatgrass Native range
50 32 16
70 64 41
80 77 57
90 70
1;;
79
92 95
Source: Fort Robinson Beef Cattle Research Station, Field Day Report, April 30, 1964.
JOURNAL OF RANGE MANAGEMENT 28(6), November 1975 439
Accommodating the livestock inventory during reseeding and deferment caused some management and feed problems. Reducing livestock numbers, grazing other range more intensively, buying hay, or renting pasture are methods of providing for the effects of nonuse on the reseeded area. The latter two methods were considered in making the evaluations, and the results using purchased hay, the more costly alternative, are presented here. Deferment was accomplished without additional fencing or water development.
Grass tetany, an often feared cause of death loss sometimes associated with grazing reseeded pastures, was reported by only one of the operators. Perhaps fear of grass tetany is exaggerated.
Legume species were mixed with grass species on some reseeded sites to increase forage production. Bloat problems were not reported, although some operators expressed concern about the possibility. Also, legume mixtures on reseeded sites inhibit control of broad-leaf weeds by chemicals.
Economics of Reseeding
Hypothetical ranch models based on northern plains cattle ranch studies were used to show forage and livestock effects and changes in net returns before, during, and after reseeding. A ranch model using a cow-yearling operation with 125 acres of crested wheatgrass pasture was compared to the same ranch model with an additional 951 acres of reseeded range to allow 35 days use between calving and breeding seasons. Reseeding was assumed to cost $16.31 per acre, the average cost for 64
sites, and about 15% more than the average cost for the disk plow, chisel, and offset disk methods. Reseeded range was assumed to produce feed at .7 AUM/acre while native range produced at .29 AUM/acre. Other assumptions, data items, and conclusions stemming from the analysis are summarized in Table 6.
The critical assumptions with respect to increased calf crop and gains of calves and yearlings are well supported by research. The other data and results flow logically from them. Calf crop is based on calves weaned as a percent of cows in the herd at calving time.
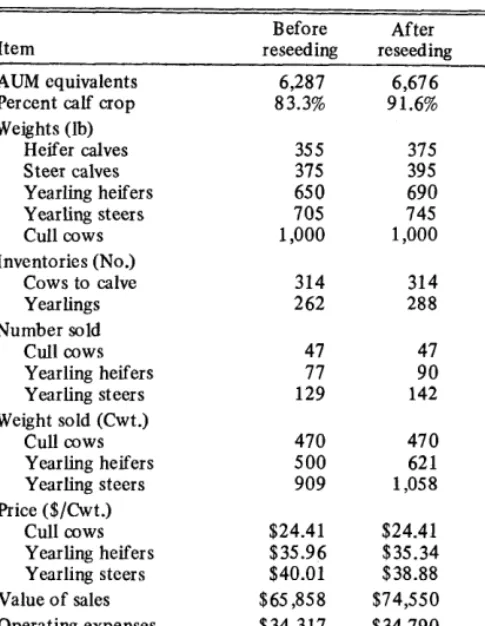
Comparisons Before and After Reseeding
Increasing a calf crop from 83.3% to 91.6% constitutes an 8% increase in calf crop. This assumption may seem optimistic but calf crop weaned in the northern plains and intermountain areas has been averaging under 80% and an 8% increase from 70%, 75%, or 80% would seem within reach and produce about the same results. Since requirements for replacements remain about the same, the number of heifers available for sale is increased by about 17% and the number of steers by about
10%. The weight of animals, regardless of age, is increased about 6%. The net effect of all changes is to increase gross incomes by 130/o, even after allowing for slight reductions in price per pound for heavier animals. Since costs do not increase greatly, excluding the investment for the reseeding, the effect is to increase net ranch income by 26% and return to land by 64%.
The Return Flow
Table 6. Assumptions and results of analysis of range reseeding- comparisons of before and after situations.
Item
Before After Percent
reseeding reseeding change AUM equivalents
Percent calf crop Weights (lb)
Heifer calves Steer calves Yearling heifers Yearling steers Cull cows Inventories (No.)
Cows to calve Yearlings Number sold Cull cows Yearling heifers Yearling steers Weight sold (Cwt.)
cull cows Yearling heifers Yearling steers Price ($/Cwt.)
Cull cows Yearling heifers Yearling steers Value of sales Operating expenses Net ranch income Operator’s allowances’ Return to land
Return to land per AUM
6,287 6,676 6.2
83.3% 91.6% 8.3
355 375
375 395
650 690
705 745
1,000 1,000
314 314
262 288
47 47
77 90
129 142
470 470
500 621
909 1,058
$24.41 $24.41 -
$35.96 $35.34 -1.5
$40.01 $38.88 -2.8
$65,858 $74,550 13.2
$34,317 $34,790 1.4
$31341 $39,760 26.1
$19,947 $20,761 4.2
$11,594 $18,999 63.9
$1.84 $2.86 55.4
5.6 5.3 6.2 5.7 10.0 16.9 10.0 24.2 16.4
’ Includes $6,000 for labor, 5% of gross receipts for management, and 6% interest on working capital.
Year-to-year changes for a hypothetical reseeding situation involve the following steps:
Year Actions and Effects
-1 Normal operation the year before reseeding. 0 Reseeding year-951 acres are reseeded, $13,56 1 variable cost is incurred for reseeding and $2,324 for buying hay, because of deferment. There is no effect on output or gross receipts.
1 The year after reseeding and the second year of deferment. There are costs for buying hay, but no effect on output or gross receipts. 2 Very moderate grazing allowed. Costs and
returns are as in the normal operation.
3 The first full-use year. There are beneficial effects on conception, and calf and yearling weights increased by 20 lb each. There are slight increases in gross receipts and net income as heavier yearlings are sold.
4 Calf crop increases to 91.6%. Yearling sale weights reach maximum, because increased gains were realized on calves in the previous year and on yearlings in the 2nd year.
5 Full benefits of increased calf crop, heavier yearling sale weights, and larger number of yearlings sold are achieved.
Full productivity on the reseeded ranch situation was reached in 5 years after reseeding and was assumed to continue over 25- or 40-year life spans. Studies of seedings in Idaho in the 1930-40 era indicate this length of life is a reasonable
Table 7. Flow of sales, expenses, net ranch income, return to capital and change in return to capital as a result of reseeding on the hypothetical ranch models over 25 and 40 year life spans.
Change Total Total Net ranch Return in return sales expenses income to capital to capital
Year ($) ($) 0) 0) ($)
-1’ 65,858 34,317 31,541 22,248 -
0 65,858 50,2022 15,656 6,363 -15,885
1 65,858 36,6413 29,217 19,924 - 2,324
2 65,858 34,317 31,541 22,248
3 66,75 1 34,405 32,346 23,008 76;
4 67,615 34,588 33,027 23,646 1,398
54 74,550 34,790 39,760 30,032 7,784
6 74,550 34,790 39,760 30,032 7,784
7-25 74,550 34,790 39,760 30,032 7,784
7-40 74,550 34,790 39,760 30,032 7,784
’ Basic ranch model situation.
2 Includes $34,317, operating expenses of basic ranch; $13,561 total variable costs of reseeding 951 acres; and $2,324, cost of purchasing extra hay.
3 Includes $34,317 operating expenses and $2,324 cost of extra hay. 4Stable condition was reached in year 5 and continued to provide the
same annual return to the end of the time period.
expectation (Hull, 1972a). Effects on receipts, costs, and returns during the reseeding, deferment, and transition years are shown in Table 7. Changes in return to capital of the model ranches during these years are also shown.
The present value of return to capital was discounted at 8% in order to account for uncertainty and time lapses between income expenditure and receipts resulting from the reseeding improvement practice (Table 8). The present value of the flow of returns was positive at the end of the 8th year after reseeding, indicating that the reseeding investment, costs, and an interest of 8% had been paid in full by that time. The true or internal rate of return was about 21.5% for the 25- or 40-year life.
A Stepwise Approach to Range Reseeding.
The previous analysis assumes reseeding of 951 acres in a single year. The average size of reseeding as indicated by Table 1 was 156 acres, including the moldboard plow method, and 260 acres for the other two methods. It may be necessary or desirable to spread a reseeding as large as 951 acres over several years.
Requirements for AUM’s and acreage for a stepwise
Table 8. Changes in return ($) to capital due to reseeding, undis- counted and discounted at 8% interest for 25 and 40 year periods.
Present value of returns Undiscounted discounted at 8%
Year returns Annual Cumulated
0 -15,885 -15,885 -15,885
1 - 2,324 - 2,152 -18,037
2 - -18,037
3 760 603 -17,434
4 1,398 1,028 -16,406
5 7,784 5,298 -11,108
6 7,784 4,905 - 6,203
7 7,784 4,542 - 1,661
8 7,784 4,205 + 2,544
9-25 7,784 38,3611 40,905
Total 147,413 -
9-40 7,784 48,089l 50,633
Total 264,173 -
‘Discounted annual returns cumulated for the 9 through 25 or 9 through 40 year time periods.
approach to range reseeding are indicated in Table 9. One-half the total yearling heifer inventory for the
hypothetical ranch
operation used in the previous evaluation would require ‘74 acres of reseeded range for breeding pasture for 1.2 months of grazing. Two-year-old heifers to be rebred would require 10’7 acres. That 18 1 acres of reseeded range would likely return considerably more than 20% on investment.The balance of the cow herd would require 560 acres of additional reseeded range, about 4% of the ranch rangeland, and produce a return at around 20% indicated in this analysis.
Steers and heifers to be sold would produce lower rate of return to reseeding investment, since the gain advantage on yearling steers and heifers is much less than the combined advantage of increased percent calf crop, and increased weight of calves expected from the cow herd and yearling heifers.
It is quite possible that a good level of returns would be realized on reseedings adequate to carry the livestock inventory for 1.6 to 1.7 months, instead of 1.2 months used in this analysis. If more reseeded range is provided, it will merely increase the ranch carrying capacity without further enhancing the livestock reproductive efficiency or rate of gain. Returns to such additional reseedings would likely be much less than a 20% return estimated by this analysis.
The stepwise approach to range reseeding for this hypothetical ranch would allow seeding over a period of 4 years with around 150 to 300 acres seeded each year. That would reduce the labor, machinery, and capital requirements in any 1 year, tend to reduce the risk of complete failure, reduce problems, and perhaps costs associated with deferment, allow for some learning experience in 1 year’s seeding to be applied in subsequent years, and result in high rate of return to the range reseeding.
Summary and Conclusions
Based upon the foregoing analysis, range reseeding appears to be a very profitable undertaking. The assumptions made in connection with the evaluation are consistent and well supported by research. Their application to actual ranch operations is quite plausible also.
Some economic evaluations of range reseeding done in the past have been based upon evaluating the effect of an increased carrying capacity without making any allowance for increased livestock gains or reproductive efficiency. When potential increases in reproductive efficiency or livestock gains are ignored, then evaluations have suggested that range reseeding is marginal from an economic point of view. This analysis would suggest that when those factors are considered and evaluated on a reasonable or perhaps even a conservative basis, then range reseeding appears to be highly profitable.
Anonymous. > 1964.
Research Station .
Literature Cited
Field Day Report. Fort Robinson Beef Cattle April.
Table 9. Reseeded acreage required for various classes of stock.
No. of
Per cent Reseeded of
Kind cattle’ AUMs’ acres’ range Returns expected Yearling heifers
to breed 72 52 74 0.5 Much above 20%
Two-year-old heifers to re- breed Cows with calves Market steers and heifers Extend grazing from 1.Z to 1.7 months
50 75 107 0.8 Much above 20%
260 391 560 4.0 About 20%
216 147 210 1.5 Below 20%
.
396 2.8 Below 20%
Extend grazing Any
season further amount Below 20%
1 Allows for death loss through the calving season. 2 Allows also for bulls and nursing calves.
Barnes, 0. K., and A. L. Nelson. 1950. Dryland pastures for the Great Plains. Wyo. Agr. Exp. Sta. Bull. 302.
Bedell, Thomas E. 1973. Prevent grass tetany. Wyoming range roundup. Wyo. Agr. Ext. Serv. No. 14.
Campbell, J. B. 1963. Grass-alfalfa versus grass-alone pastures grazed in a repeated-seasonal pattern. J. Range Manage. 16:78-81.
Cook, C. Wayne. 1966. Development and use of foothill ranges in Utah. Utah Agr. Exp. Sta. Bull. 461.
Cook, C. Wayne, L. A. Stoddart, and Phillip L. Sims. 1967. Effect of season, spacing and intensity of seeding on the development of foothill range grass stands. Utah Agr. Exp. Sta. Bull. 467.
Frischknecht, Neil C., and Lorin E. Harris. 1968. Grazing intensities and systems on crested wheatgrass in central Utah: Response of vegetation and cattle. U.S. Dep. Agr. Tech. Bull. 1388.
Houston, W. R., and J. J. Urick. 1972. Improved spring pastures, cow-calf production, and stocking rate carry over in the Northern Great Plains. U.S. Dep. Agr. Tech. Bull. 145 1.
Hull, A. C., Jr. 1972a. Growth characteristics of crested and fairway wheatgrasses in southern Idaho. J. Range Manage. 25:123-125. Hull, A. C., Jr. 1972b. Seeding rates and row spacing for rangelands in
southeastern Idaho and northern Utah. J. Range Manage. 25:50-52. Hull, A. C., Jr., and G. J. Klomp. 1966. Longevity of crested wheatgrass in sagebrush-grass type in southern Idaho. J. Range Manage. 19:5-l 1.
Jeffries, N. W., R. L. Lang, M. May, and L. Landers. 1967. Cow-calf production on seeded and native range. Wyo. Agr. Exp. Sta. Bull. 472.
Pingrey, H. B., and E. J. Dortignac. 1959. Economic evaluation of seeding crested wheatgrass on northern New Mexico rangeland. New Mexico Agr. Exp. Sta. Bull. 433.
Rauzi, Frank, Leland Landers, and Alan Herold. 1971. Renovating crested wheatgrass stands. Wyo. Agr. Exp. Sta. Res. J. 52.
Rumsey, Walter B. 1971. Range seedings versus climax vegetation on three sites in Idaho. J. Range Manage. 24:447450.
Springfield, H. W. 1963. Cattle gains and plant responses from spring grazing on crested wheatgrass in northern New Mexico. U.S. Dep. Agr. Prod. Res. Rep. No. 74.