Phone vs. Tangible in museums: A comparative study
PETRELLI, Daniela <http://orcid.org/0000-0003-4103-3565> and O'BRIEN,
Sinead
Available from Sheffield Hallam University Research Archive (SHURA) at:
http://shura.shu.ac.uk/18219/
This document is the author deposited version. You are advised to consult the
publisher's version if you wish to cite from it.
Published version
PETRELLI, Daniela and O'BRIEN, Sinead (2018). Phone vs. Tangible in museums: A
comparative study. In: CHI '18 Proceedings of the 2018 CHI Conference on Human
Factors in Computing Systems. ACM.
Copyright and re-use policy
See http://shura.shu.ac.uk/information.html
Phone vs. Tangible in Museums: A Comparative Study
Daniela Petrelli
Sheffield Hallam University
Sheffield, UK
[email protected]
Sinead O’Brien
University of Sheffield
Sheffield, UK
[email protected]
ABSTRACT
Despite years of HCI research on digital technology in museums, it is still unclear how different interactions impact on visitors’. A comparative evaluation of smart replicas, phone app and smart cards looked at the personal preferences, behavioural change, and the appeal of mobiles in museums. 76 participants used all three interaction modes and gave their opinions in a questionnaire; participants interaction was also observed. The results show the phone is the most disliked interaction mode while tangible interaction (smart card and replica combined) is the most liked. Preference for the phone favour mobility to the detriment of engagement with the exhibition. Different behaviours when interacting with the phone or the tangibles where observed. The personal visiting style appeared to be only marginally affected by the device. Visitors also expect museums to provide the phones against the current trend of developing apps in a “bring your own device” approach. Author Keywords
Museum, tangible interaction, mobile phone, comparison. ACM Classification Keywords
H.5.m. Information interfaces and presentation (e.g., HCI): Miscellaneous.
INTRODUCTION
Much work has been done in HCI on ways in which digital technology could be used in museums, exhibitions and heritage sites to engage visitors. The range of research is broad: apps to deliver information, to deliver music or to play games (e.g. [4][8][11][14]); interactive and embodied experiences (e.g. [7] [36]); and bespoke tangible installations (e.g. [32] [3]). Although applied to the same context, the purpose of these works is very different and so is the response of visitors. These studies combine some form of content delivery (soundscape vs. plain information) with a digital device (bespoke vs. off-the-shelf). The intertwined design makes it difficult to decouple the effect of the content from that of the technology and it is therefore
difficult to draw lessons from across the spectrum of studies in the literature.
To shed some light on the effect different technological means have on visitors, a comparative evaluation of a phone app vs. a tangible way to control and activate multimedia content in an exhibition was set up. While the content stayed the same, the way in which the content was triggered and delivered changed. We compared an app on a mobile phone against smart cards and smart replicas. The cards and the replicas activate the content in the same way, via tangible manipulation, which is different from finger interaction on the phone (different functionality). The difference between cards and replicas is purely aesthetic: the cards have the sole purpose of activating the content, while the replicas add an aesthetic value to the same NFC mechanisms as the cards. This experiment then allowed us to unpack and better understand the role of both function and aesthetics. In particular, we aimed to answer questions such as: does the means of activating and delivering content impact on the visiting experience? If so, in what way? Are there differences between visitors? What are their expectations? What lessons can be learnt for the design of technology for museum and exhibition? Does aesthetics play a role or is functionality dominating?
A comparative within-subject study was set up and data collected from 76 participants. The context was an exhibition in which smart replicas were used to control the delivery of multimedia content [20]. Participants were observed during the use of the three different modes, i.e. the phone, the card and the replica, and questioned about their like and dislike. In addition, expectations or reservations when a museum offers an app were also investigated.
The paper is organised as follows. Technology to support museum visitors is reviewed firstly, followed by a description of the exhibition. Then the comparative evaluation is discussed with regard to its setting, data collection and analysis. A thorough discussion of the implication for the design of interactive technology for museums concludes the paper.
RELATED WORK
Digital technology has been used in museums since the early 90s [29]. Indeed museums have been considered an ideal place to experiment with the newest technology (e.g. multi-touch tabletops [15]), sometimes trying devices that later failed in the market, e.g. Apple MessagePad [21] or Google Glass [1] [31]. Given this wide range, we limit our
PASTE THE APPROPRIATE COPYRIGHT/LICENSE STATEMENT HERE. ACM NOW SUPPORTS THREE DIFFERENT PUBLICATION OPTIONS:
• ACM copyright: ACM holds the copyright on the work. This is the
historical approach.
• License: The author(s) retain copyright, but ACM receives an exclusive publication license.
• Open Access: The author(s) wish to pay for the work to be open
access. The additional fee must be paid to ACM.
This text field is large enough to hold the appropriate release statement assuming it is single-spaced in Times New Roman 8-point font. Please do not change or modify the size of this text box.
review to work relevant for comparing mobile applications and tangible interaction in museums looking at both academic research and museum practice. Therefore, research on the use of mobiles outdoors (e.g. memories in a folk park [4], artist’s talk [10] and music [14] in a sculpture park, seasonal content on an island [19]) or indoor navigation (e.g. responsive display of floor maps [35]) and social media (e.g. Instagram to record the visit [38] or other sharing platforms [8] [12]) is not reviewed as not relevant in the context of this paper of indoor content delivery. Apps for Information, Play, Feelings and More
From the early experiments of the 90s on delivering content adapted to the specific visiting context [21], the use of mobile technology in museums has become, in the late 00s, more common [8] and it is now expected [21]. Today museum apps deliver multiple layers of multimedia content to visitors who can dig into specific artworks, offer games to amuse both children and adult, use augmented reality to provide content in context, and offer a range of additional information services such as visiting planners and interactive maps [8].
While mobile devices made available by the museum are still common, there is an ongoing shift toward developing apps and take advantage of a Bring Your Own Device approach (BYOD) by which visitors use their own smart devices to access services provided by the museum. Started as an art project that produced podcast to download before the visit and then fostered by the advent of the iPhone and the App Store [28], BYOD in museums offers opportunities and poses challenges. From the museum perspective, BYOD decreases the costs related to buying/renting and managing devices (e.g. audio guides) although other onsite services should be offered such as free WiFi and good coverage of the exhibition space, charging points, and headphones for sale. From a visitors perspective BYOD offers familiarity of use and hygiene [18].
The development of apps for smartphones is also seen as a way to reach a younger audience that does not use audio guides and does not take tours, although what could appeal to them is an open question [18]. A BYOD approach can also build upon more mature visitors (that form the largest museum audience) as market penetration of smartphones is now well over 80% in Europe with the 55+ as the fastest growing user group in 2016 [6].
Early explorations of BYOD potential to augment the visiting experience [18] [28] indicate recording and participating (e.g. taking pictures for oneself or social media) as well as information access and search as main drivers. However, while the use of phones on the exhibition floor is acknowledged as being of value by visitors in some museums, in others it is commented as disruptive of the experience [18]. This points to a potential tension between providing mobile services for some visitors while offering tranquillity for others, possibly pushing museums towards differentiation by time or place (e.g. to offer different
content such as music) or to support the development of a new etiquette [18].
Finally, while the development of apps is well underway, how to evaluate the impact of digital technology in museums is still considered a difficult challenge [21]. There are well-established ways to measure if an exhibition reaches its aims, but there are currently no metrics or processes to evaluate the impact of technology in museums, if it reaches its aim and how it fits with the overall museum mission [21].
In summary, a few topics relevant for this research emerge. Museums have now embraced the use of mobiles, are aware of the services that they need to provide, but are less certain on the type of apps to offer besides practical information. There is the assumption young people can be better reached via their own mobile, although there is no evidence this is preferred over other means or that the older generation prefers more traditional guided tours. The evaluation of how technology relates to the exhibition is still an open issue (does it enhance the experience as many expect [18] or does it hinder it as some research seems to show [34] [27]?)
Tangible Interactions in Museums: Early Explorations Networked objects and the Internet of Things are seen by musuems professionals as long term [21] and tangible interaction has been tested in musuems only as part of research projects. Previous work on tangible in museums has taken different forms and explored different settings. In Kurio, tangibles were a component of a more articulated interactive expecience designed to support a playful social interaction within family groups: tangibles to listen, point, and read are used toghether with mobiles and a table top to accomply three missions [37]. Tangibles have also been used to materialise experiences and enable interaction with soundscapes. The ec(h)o cube was used to select topics of audio presentations delivered via headphones [36] in a 3D adaptive soundscape, while replicas of historical cups told their stories when handled [7]. The cups were replicas of original exhibtis in the musuem; they were placed in a soundscape room that reacted to the visitor’s movements and actions delivering, via headphones, ambient sound if the visitor was oving or stories if the visitor was handling the cups. The story heard and their historical sources were then accessible online to extend the experience [7]. The physical connection between the handling of the cup and the content was a missing element in ec(h)o that favoured abstraction: the plain cube had no recognizable connection with the natural science musuem it was used in or with the topic it selected leaving at times the visitor confused about why content was relevant for that exhibit [36].
into the interactive cauldron that reacted with different sounds (e.g. burps) and lights depending on the object thrown in [32]. Spells on display, e.g. from Shakespeare’s Machbeth, inspired children to invent their own and engaged them at length. Another example of tangible interactive installation is a pair of small scale replicas of the statue of Augustus and the Ara Pacis in Rome augmented with mini buttons that, when pressed, triggered multimedia content on a display positioned nearby [3]. Although no formal evaluation has been carried out, the authros claim the augmented replicas increase engagment because of both the tactile interaction and the personal choice.
In summary, tangible interactions in musuems seems to be highly evocative and able to engage visitors in a deeper and more intense way. However the physical element is not enough and a direct connection between what the visitor touches and the context is important. Previous reseach shows that it can be implemented as a single interactive piece or in a more pervasive way with equal success.
EXHIBITION DESIGN AND DIGITAL INTERVENTION Digital Technology to Create Meaningful Experiences This research is part of a larger project that investigated the effect of tangible interaction in museums and heritage sites. meSch [22] aimed at bridging the gap between physical and digital cultural assets by means of bespoke interventions to engage visitors at a deeper level. Through participatory activities [4, 23], meSch gained a thorough understanding of the challenges cultural heritage face in presenting their collection to a contemporary audience. Questions of how to engage the audience and create personal connections, how to provoke reflection rather than teaching facts, and how to convey multiple aspects of a complex story emerged as key design challenges when setting up an exhibition.
In exhibition design, digital technology is now seen as a “must have”. However, it is often an “add on” (e.g. more information or a different experience) rather than an integrated element of a complex and multi-channel communication between the cultural institution and the public. In our research, we use co-design and co-creation with curators to design interactive installations that are fully integrated with the exhibition [23]. This approach generated crafted bespoke interactive experiences that fit the curatorial intent and the exhibition design. Via tangible interaction we created installations that are sympathetic with the ethos of the exhibition and engaging for visitors on both a physical and cognitive level. This same holistic approach was used in the design of the Atlantic Wall exhibition which is the context of this comparative study. The Exhibition
“The Hague and the Atlantic Wall: War in the City of peace” was a temporary exhibition at MUSEON in The Hague (The Netherlands) that attracted about 40.000 visitors. The intent of the curatorial team was for an exhibition that explored the impact of the Atlantic Wall
structure on the city of The Hague and the people living there, and what it meant for the identity of the city after the war. The Atlantic Wall was a defensive system built by the Nazi in WWII along the north coast of continental Europe to defend it against possible attacks by the Allies. During the German occupation, a third of the city of The Hague was demolished to make space for the Wall and the Nazi headquarters. People were evacuated and displaced, their houses demolished; deep trenches, walls and checkpoints were built. After the war the defensive structure was dismantled and the Peace Quarter that hosts a number of UN institutions as well as the International Court of Justice was built in its place.
[image:4.612.321.554.418.519.2]A three-parties design process took place: the curatorial team provided the vision, the objects and the interpretation; an exhibition design firm looked after the overall layout, the information panels and the displays; the research team designed and built the interactive experience. The exhibition concept was implemented as an open plan with eleven distinct areas mapping the different quarters of the city affected by the Wall. Like on a city map, white lines on the floor symbolised the streets connecting stations/quarters (Fig. 1); each station focussed on a topic related to the quarter, i.e. how the beach became a mined field, why the Peace Quarter was built there. Objects on display, labels and panels provided specific content while an 8-min introductory film gave an overview; a few multimedia stations offered a quiz game and videos-on-demand. Finally, a wall-size carousel of historical photos provided the background and atmosphere for the exhibition.
Figure 1. The Atlantikwall exhibition (see videofigure).
complement the more curatorial tone of the exhibition, the interactive offered the personal perspectives of those involved: how the German soldiers believed they were defending the Dutch population from the Allays; how the civilians were displaced, resisted and resented the occupation; and how the civil servants dealt with doing the bid of the German occupiers against their fellow citizens.
While the physical exhibition recounted the historical facts, digital technology offered multiple personal points of view as themes running across the whole exhibition. At each station / city-quarter, visitors could listen to one or all of the three perspectives presented as personal stories (e.g. excerpts from diaries), newspaper and radio material (e.g. German propaganda), satirical songs or video archival material. Each point of view was represented by a replica of an object used in everyday life in WWII (Fig. 2). The crafted replicas were augmented with an NFC tags. Two sets of smart replicas were made, three for the Dutch language and three for the English language. The manufacturing quality was very high, to the point of recreating a Nazi stamp to validate the passes: the intent was that of increasing the aesthetic value of the replicas.
Figure 2. The smart replicas, three for Dutch language (the beer mug for the soldier, the surrogate-tea bag for the civilian, the paper pass for the civil servant), and three for English language (the German-Dutch dictionary for the soldier, the surrogate-sugar box for the civilian, the armband for the civil servant)
At the entrance, visitors choose a replica to be used during the visit thus determining their preferred language and the perspective they want to follow. When at a station, visitors place the replica on a glowing spot (that covers an NFC reader) to play the multimedia for that station in the language and from the perspective represented by the replica. Sound played in the earpiece and a carousel of historical photos or videos was projected on the glass of the case (Fig. 3). The system logged the visitor interactions to print a personalised postcard and to generate a personalised website for online exploration and visitors’ contribution of personal memories. The postcard and the online personalised experience are not discussed here as they are
[image:5.612.318.553.89.268.2]not part of the comparative study, interested readers could refer to [25].
Figure 3. Interaction at a display station. The armband that represents the perspective of the civil servant is placed on a light-pulsating ring; this action plays multimedia content.
COMPARATIVE STUDY Evaluation Aims
The comparative study that forms the major contribution of this paper was designed to better understand the impact of different interaction modes on the visit. We aimed to ascertain both the visitors’ preference for a specific mode as well as to determine if and how they change visitors’ behaviour. Finally we aimed to find out if visitors are ready for the BYOD approach favoured by museums or if the use of mobiles in museums comes with the expectation for devices to be provided. For each of the three research topics, we collected specific data via questionnaires and observations as described below.
Interaction Modes: Smart Replica, Phone and Smart Card
The smart replicas were the way visitors interacted within the exhibition. To assess the impact of different interaction modes on the visit, a mobile app was developed. Museum apps with high user reviews and similar content delivery were inspected and used as guidelines. In particular, in order to replicate with the mobile phone the same freedom allowed by the interaction with the replica, we only considered apps that allowed visitors to create their own tour, as opposed to following tours proposed in the app.
[image:5.612.57.297.332.485.2]information for the content being played, the perspective chosen and the current station. ‘Back’ takes the visitor to the list of destinations for another selection. The app was developed for Android and Alcatel phones were used.
Figure 4. The app screens: start, perspectives, list of places, and play (the language selection step is not shown).
The replicas and the app capture two very different interaction modes: tangible interaction to trigger content in situ vs. mobile interaction to deliver content on device. A third mode was introduced in the experimental design to distinguish a further factor within the tangible interaction, specifically to find out if the aesthetic of the replicas played a role or if instead the functional aspect (to have an object in one's hand that starts the audio-visual material) was the reason for preference or dislike. To test the aesthetic value of the replica we prepared a set of NFC smart cards that worked exactly as the replicas, but lacked the craft and beauty of the objects (Fig. 5).
Figure 5. The smart replicas for the Dutch language (the beer mug for the soldier, the pass for the civil servant, the surrogate-tea bag for the civilian), and the smart cards.
The experimental design then compared three modes: the phone, the replica, and the card. We asked participants to score each mode against the same set of questions based on the dimensions of tangible interaction [26] plus questions on “usefulness” and “ease of use”. The questions captured tangible aspects that are not in standard questionnaires for graphical interfaces but that could apply to the phone mode such as “comfortable” (as one has to carry the phone and wear the headphones), or “special” (as the app delivering multimedia is different from the normal use of the phone). The same questionnaire was used across the modes to
enable the comparison of the data collected. We also invited a direct comparison by asking which mode was the most preferred and why and which the least preferred and why.
Visiting Behaviour
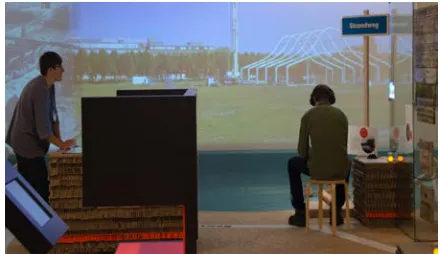
[image:6.612.327.548.359.486.2]The limited research looking into mobile technology in museums suggests that such devices affect visitors’ behaviour, e.g. visitors look at the device and do not get close or observe the objects on display [34] [27]. However, evidence collected so far has not been systematic, that is to say the behaviour of using a mobile platform has not been compared against other interaction modes. To shed some further light on how the use of the phone affects the visit, each participant was observed while using each of the interaction modes. The comparative evaluation enabled us to see if a shift of behaviour occurred within the same person. This therefore allowed us to determine with some accuracy if the choice of whether or not to approach the objects on display is induced by the device, or if instead it is a personal preference. In the experiment, a researcher observed each of the participants (Fig. 6) and noted if the visitors looked at the objects on display, if they watched the content (whether on the phone or on the display case), if they looked at nearby information or at the exhibition in general. They also observed if the visitor sat down, stood up, moved around the cases or walked the exhibition.
Figure 6. Observation: the phone grabs attention and the visitor ignores the objects in the case at his right.
Acceptability of Mobile Phones in Museum
For museums and exhibitions to provide apps instead of other in-situ technology seems advantageous: as most visitors own a smartphone they can use their own device to access content provided by the museum thus reducing the costs of personnel (no one to hand-out/collect devices) and device maintenance (cleaning and charging, repair and upgrade). There is some understanding among professionals on what a BYOD policy means to museums [28] and visitors [18].As part of the study we questioned participants on their attitude and expectations when visitors’ mobile phones were used by museums to deliver content. Paired with the result of the study on tangible, this set of questions gives us a broader picture of acceptability beyond BYOD. Experimental setup and procedure
[image:6.612.56.296.402.545.2]three interaction modes: the phone, the replicas, and the cards. To avoid any possible bias, a Latin-Square was used to counterbalance the interaction modes and the stations, i.e. all participants used all three modes, listened to all three perspectives at nine stations but in different combinations and orders. Participants were recruited by the museum via their mailing lists and were given a €20 museum shop voucher as a thank you for taking part. At arrival participants were welcomed by a researcher who explained the experiment, asked consent and showed a short video on how to use each of the three interaction modes. The evaluation was individual. The researcher assigned one of the three modes (phone, replica or card) while the participant chose the perspective. The researcher then showed the participant to the first of the three stations (as determined by the Latin-square) and retreated to observe. Notes were taken on where the participant stayed with respect to the display, where they looked and how they moved (Fig. 6). When the sequence of three stations was done, the researcher collected the phone / card / replica and asked the participants to fill in the 7-points likert-scale questionnaire before moving onto the next interaction mode using the next perspective to visit the next three stations. When all three modes had been used, participants filled the comparative session of the questionnaire choosing the most and least preferred interaction mode and explaining why. The final 5 questions focussed on the use of phones for content delivery in museums.
No time limit was given and participants were instructed to use the interactive mode as part of a normal visit: they were free to sit down or stand up, move, look at the exhibits, read the labels and panels. The observed visitors’ behaviour was recorded in the researches’ notes. Multiple data sources were collected including: quantitative data (likert-scales), qualitative data (open questions on like-dislike), multiple choice (mobile in museums), and researchers’ notes. Statistics were applied to the likert-scale, thematic analysis [2] was used to classify the motivations of like / dislike. Direct observations were coded and used to complement, compare, contrast or confirm other findings.
RESULTS AND DISCUSSION
Overall 76 participants took part in the experiment; 62% female and 38% male. The age range was very wide, spanning from teenagers (5 participants) to octogenarians (3 participants).
The experiment was carried out during the museum opening hours, therefore the participants were in a naturalistic situation and had to negotiate their movements with other visitors; however only rarely did participants have to wait for a station to be free. During the days the experiment was carried out a few school classes visited increasing the background noise and the chances for another visitor to be at a desired station. Class visits were noted and taken into account in the analysis, if relevant, e.g. when a participant preferred the phone because of the surrounding noise.
The vast majority of participants went through the experiment with only limited pauses for reading labels and panels, completing the visit in about 30-40 minutes; some read the panels extensively and looked at the exhibits in a longer visit of about 1 hour. A visit of 30-40 minutes is consistent with the museum’s own assessment of the exhibition that recorded a similar average visiting time.
Preferred Interaction Mode
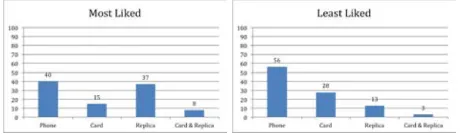
[image:7.612.323.553.372.439.2]We first look at the most and least preferred interaction modes and the difference between tangible vs. mobile interaction. The most notable result is that the Phone1 was the most disliked interaction mode by far (56%) followed by the Card (28%) (Fig.7, right). The most liked mode appears, marginally, to be the Phone (40%). That said, 8% of participants did not pick just one mode but instead choose both Replica and Card as most liked. Therefore, if these participants are added to the 37% that preferred the Replica, then the Replica becomes the most preferred interaction mode with 45% (Fig. 7, left). Quite surprisingly 15% of participants preferred the Card, showing they favour functionality. If this result is added to the 8% who feel Replica and Card to be the same, a group of people that are indifferent to the aesthetic of the replica seem to emerge (23%). If the preferences are split by functionality only, Tangible vs. Phone, then the result is a clear preference for tangible (60%) over mobile (40%).
Figure 7. Percentages of most / least liked interaction mode.
Given the large age difference across the sample, preferences were tested against the participant’s age so as to ascertain if any age group had a dominant preference, thus testing the hypothesis:
Are younger more likely to prefer the phone than elderly?
To maintain a good granularity of the independent variable (age group) and to conform to the Chi-square minimum expected cell frequency constraint (expected frequency above 5), the dependent variable (interaction mode) had to be limited to two categories while age groups had to be split as follows: under 40 (19 participants, 25%); 40-50 (21, 28%); 50-70 (22, 29%), over 70 (14, 18%). The Chi-square test was applied to the categories, Phone vs. Tangible, over 4 different age groups (4x2 table). The results for most liked mode (χ2(3) = 4.25, p = .235) as well as least liked mode (χ2(3) = 4.10, p = .250) show that preference and
dislike for a specific mode does not depend on the age of
1 When capitalised Phone, Replica, Card and Tangible refer to
the participant. Therefore, we can conclude that opinions are consistent across different age groups. In other words, preference or dislike for the Phone does not depend on the age group.
A thematic analysis of the motivations given for preferring or disliking an interaction mode where analysed. Those who preferred the phone said that: (i) it allows free movement while listening, (ii) the headphone cancels the background noise (vs. the earpiece for replicas and cards covers one hear only), and (iii) there was no need to wait / queue for an interactive station. Motivations for disliking the Phone were: (i) it isolates the visitor and (ii) distracts from the exhibition. Observations showed that the 6 participants who visited at the same time as a school class all preferred the Phone: classes were noisy and competed for the same stations. However, all the 6 participants displayed a Fish attitude (explained below) even when interacting with the Tangible, that is to say they did not show a deep engagement with the content and the objects. Therefore their preference for the Phone can be explained by their personal visiting style.
The motivations for preferring the Replica were: (i) simple, easy to use, (ii) playful, and (iii) physically engaging. That 15% of the participants liked the Card best of all was an unexpected result. Motivations were: (i) it is practical (it fits in the pocket) and (ii) it says which perspective it holds. This is in contrast to the replica that had no indication of the perspective being played (while it is shown on the Phone, Fig. 4). The experimental setting could be the cause: participants were asked to pick a different perspective for each mode; this frequent swap may have created confusion on which perspective they were following at each point in time. The naturalistic evaluation of the exhibition showed visitors picked the replica based on their personal interest [20], leaving no doubt on what they were listening to. Therefore the preference for the Card should be taken with caution: if the Replica had displayed the perspective, results might have been different.
The motivation given for disliking the Replica was mainly that it tied the visitor to the earpiece while the Card was judged to be “boring”.
Participants’ Perception of Different Modes
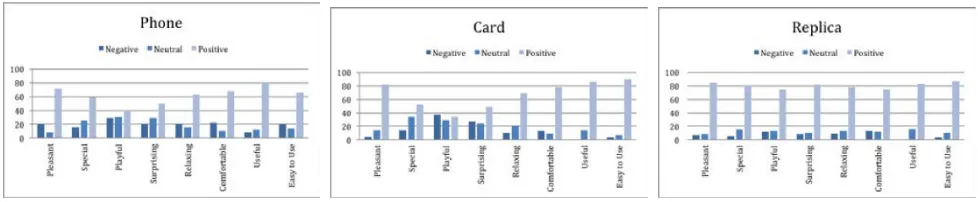
After each mode was used, participants filled in eight 7-points Likert-scale questions to ascertain their impressions.
The questions combined six of those proposed by [26] for the evaluation of tangible interaction (namely: pleasant, special, playful, surprising relaxing and comfortable) and two addressing usefulness and ease of use. The data from the 7-points Likert-scale was aggregated to represent negative (1-3), neutral (4) and positive (5-7) opinions. Figure 8 shows the aggregated values for each dimension for each mode. The Replica consistently scored higher than the Phone across all of the dimensions, while the Card scored higher than the Replica for Comfortable and Ease of Use. Although it scored very high (66%), the Phone was not as usable as the Card or the Replica. Observation showed some people had difficulties in understanding how to operate the smartphone, possibly because they do not own one (see below); others were observed sliding instead of tapping showing possible differences in gesture recognition between iPhone and Android. We also observed participants rotating the phone horizontally to enlarge the size of the historical photo slide show, all in black and white; however, even in its larger version, the video on the phone screen was about a quarter of the case projection. Do Different Modes Affect Visiting Behaviour?
To discover if the mode of interaction affects visitors’ behaviour, researchers took notes if the behaviour was consistent across the three cases for the same interaction mode. The observer’s note pack distinguished two dimensions, focus of attention and body posture, as follows:
focus of attention pertained (1) what the participant looked at while listening to the story (at the phone/projection; objects on display; information nearby; exhibition as a whole/looking far); (2) if they concentrated on one or two elements (e.g. screen / projection and objects) or if they shifted their attention much (from screen/projection to objects to information panels to glancing around the exhibition); and (3) how often (constantly looking at the screen/projection vs. frequently shifting attention);
body posture encompassed (1) how the visitor positioned themselves with respect to the exhibit case (sitting/standing close by; standing away) or the phone (just holding it vs. looking at it); (2) if they moved (still/minimal movement; clear change of position/walk), and (3) how often they moved.
[image:8.612.62.551.595.696.2]
Two types of behaviour were observed that map Veron and Lavasseur’s categories of Fish and Ant [33]. In an ethnographic study, they observed that visitors display four different behaviours: the Ant follows a linear path, gets close to the exhibits and spend time observing them; the Fish moves most of the time around the centre of the room and very rarely approaches an exhibit to observe details; the Butterfly does not follow a path but stops frequently although not for a long time; and the Grasshopper displays very specific interests for some exhibits spending a lot of time there while ignoring the rest.
Given the setup of the experiment that requested participants to stop at all the stations, we could not observe Butterfly or Grasshopper behaviours although some participants interrupted earlier the listening in some stations indicating aspects of strong personal interest. An extended quantitative study of visitors’ behaviour [39] confirmed this classification and showed that a Grasshopper is closer to an Ant than a Fish and a Butterfly’s behaviour is closer to a Fish than an Ant. Therefore, a classification based on the two categories Ant and Fish captures the two distinct behaviours that we could observe in the study when participants had to visit the whole exhibition. We can broadly describe those two behaviours as gaining an overview of the exhibition (a Fish) vs. a deep engagement with the content (an Ant).
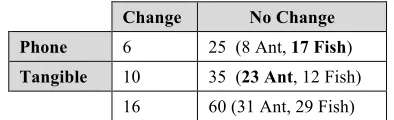
The classification into Ant or Fish was determined by the attitude demonstrated in focus and posture: participants who only looked at the screen/projection and objects, stayed close to the case, and barely moved were classified as Ant while those who looked around, stayed away and moved much more where classified as Fish. For the few cases that displayed a combination of the two we looked at frequency of behaviour, i.e. rare shift of attention or movement where classified as Ant while an initial focus followed by a sequence of shifts was classified as Fish. This classification was done for each participant and for each mode, therefore we could identify those who displayed a different behaviour depending on the interaction mode. A Fish showed well when using the Phone as they walked around the exhibition, sometimes quite far from the station, looking around and not really focussing on anything in particular. With Tangible, Fish tended to stand and look around, walk around the case as much as the earpiece cord allowed them to, they did not observe anything for long and they only glanced at additional material on display. An Ant instead stayed still (standing or sitting), kept focus and concentration on the case and its objects, watched the video on the phone screen or case projection, often read the labels and panels before or after the multimedia content was played. To find out if visiting behaviour was influenced by the interaction mode, observed behaviours were further classified respect to a clear change of attitude vs. preferred mode (Table 1).
Change No Change Phone 6 25 (8 Ant, 17 Fish)
Tangible 10 35 (23 Ant, 12 Fish)
[image:9.612.340.537.61.121.2]16 60 (31 Ant, 29 Fish)
Table 1 Behaviour displayed by participants classified respect to observed behavioural change (columns) and preferred
interaction mode (rows).
Table 1 shows that most participants (60) did not change their behaviour when changing interaction mode: they showed a personal visiting style that was not affected by Phone or Tangible. The number of participants that displayed an Ant (31) or Fish (29) attitude is close. As it could be expected, Fish prefers the Phone while Ant prefers the Tangible. Indeed, by constraining movements the Tangible interaction, as implemented here, invites to pause and pay attention, a typical trait of the Ant. This does not mean the Fish were not interested, more that their attitude to wonder would make them more likely to miss references to the objects on display while Ant would be quick to respond and look at the object or the screen / projection thus displaying a higher engagement with the overall exhibition design.
The participants (16) who displayed a different behaviour depending on the interaction mode showed a Fish attitude with the Phone and an Ant attitude with the Tangible. Of these, 6 preferred the Phone possibly indicating frustration when constrained by the limited mobility of the Tangible. Overall, the behaviour observed in literature [34] [27] that mobiles absorb visitors’ attention seems due to personal attitude more than to the influence of the device itself. However, our observations also show that an interaction based on Tangible and designed around a focus, i.e. an exhibit, is more effective in engaging visitors’ attention. Indeed, participants interested in the content (Ant) stay fixed on the phone screen (Fig. 6), while they split their attention between image slide show and the objects on display when using Tangible. In other words, the content is better integrated in the context of the exhibition with Tangible than Phone and visitors respond and appreciate it. Implications of a “Bring Your Own Device” Approach A set of five final questions in the questionnaire was aimed at unpacking the use of mobile phones, and participants own personal smartphones being used as the device to deliver content provided by the museum through an app. This section questioned the use of phone if no alternative was on offer. The first question asked: “If the museum had phones with audio-visual material, would you use it?” A very high majority (75%, N=76) would indeed use a mobile phone. Clearly many of the participants who preferred the replicas would be happy to use a mobile phone if it were the only option available.
“Would you expect the museum to provide the phone?” and “Would you be happy to download a free app on your phone?” aimed at ascertaining the attitude toward a BYOD approach. Half of the respondents (50%, N=56) would expect the museum to provide the phone and 66% (N=56) would be willing to download an app on their mobile. To test the ground for BYOD we asked: “Have you downloaded museums app before?”. Only a small percentage of our participants (20%, N=56) had actually already gone through the process of downloading and using museum apps. When considered over the whole sample the number of visitors who downloaded an app reduces to 17% (N=76). These results suggest that providing an app does not guarantee visitors will use it and museums may need to hand-out devices if they want to reach out to a larger number of visitors. This may be only a phase as figures for the use of smart phones continue to increase [6].
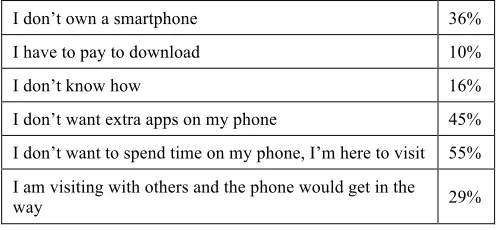
The last question asked participants who did not want to download the app why this was the case. Six options with multiple choices were given, as shown in Table 2, four focussed on the phone itself and two on its use within the exhibition. The 36% of participants who does not own a smartphone should be taken with caution as statistics of smartphone use in The Netherlands show 87% penetration [6], so well above what we recorded. The high percentage of non-users in the study is partially explained by the two extreme of teenagers and elderly, two opposite groups who do not own a smartphone for very different reasons, i.e. high costs vs. limited needs.
I don’t own a smartphone 36%
I have to pay to download 10%
I don’t know how 16%
I don’t want extra apps on my phone 45%
I don’t want to spend time on my phone, I’m here to visit 55%
I am visiting with others and the phone would get in the
[image:10.612.51.299.413.528.2]way 29%
Table 2. Reply to “why you would not download an app?”
It is quite remarkable that the highest percentage of participants that prefer not to use mobile apps explain this is because the use of the phone gets in the way of the enjoyment of attending the exhibition (55%, N=31) or the visiting with others (29%, N=31). This echoes some of the reasons stated for disliking the phone: “With the headphones I feel closed off from the outside”, “It distracts me from the exhibition”, “with the phone I cannot see anything of the exhibition”, “It makes you look at the phone and you will miss the objects”, “the phone cuts you off from your environment”. This challenges the use of phones in museums altogether and invites to think of different ways in which technology can augment the visit.
DISCUSSION AND CONCLUSIONS
The data we collected in this study allows us to go beyond the simple comparison of smartphone app against tangible interaction to activate multimedia content. We then split the discussion of the results in: (i) the impact of digital technology on visitors; (ii) the implications for museums; and (iii) the potential for interaction design for museum. How do visitors respond to technology in museums? The comparative evaluation showed visitors prefer tangible interaction to mobiles and this is consistent across different age groups. Therefore, the argument that the younger generation can be better reached via apps [18] is not confirmed in our study. Disliking the replica because “it makes me feel like a little girl playing with the dollhouse” is an example of strong opinions among the elderly and is inline with our major finding that preference is due to personal visiting style. In other words, the preference for an interaction mode over another (e.g. Phone vs. Tangible) is due to personal attitude toward the exhibition (and likely to visiting museums more in general) rather than to the influence of the interaction mode itself. This is a strong result that explains finding in the literature [27] not in terms of the effect of the device, but on personal attitude, when usability issues can be excluded [34]. Indeed our results extend to digital technology the findings in the museum studies literature that the motivation for the visit changes the visiting behaviour [9]. We also found that an interaction mode preferred by a specific visiting style can amplify its effect. More specifically, visitors who displayed a preference for the phone were very mobile and sought to gain an overview of the exhibition while those who were interested in the details preferred tangible interaction as it supported focus and reflection. This may suggest consideration should be given to offering different design concepts for different visiting styles.
of the fact that its effect may by much more limited than it is currently expected. The novelty of tangible interaction sets the experience in the museum apart from the everyday, whilst this does not occur with the use of ones own phone. Museums should think more of the “poetic” experience which a bespoke digital intervention can have on visitors rather than to the “utilitarian” goal of giving out content. This means to design digital interaction in synergy with the rest of the exhibition (as we did when tangible interaction was crafted with evocative content) and not as an add-on,. Museums are constantly surveying their visitors in order to better understand their audience and provide a better service [18]. However, surveys provide a limited understanding respect to hindsight gained by trying solutions on the exhibition floor. Our study shows that age is not relevant, device is not relevant, personal attitude is. Museums should embrace experimentation and take the partnership with HCI research as a means to better understand the role of technology in their own museum and use it to drive their digital strategy. This requires a shift in their role: from recipients of digital solutions and advance tester toward leading innovation and active participation in co-design and co-creation. It can be a radical change for a sector that traditionally does not go through design iterations nor evaluates the impact of an exhibition post-opening [30]. It can be the mission of interaction designers to change this culture and make museums less fascinated by the latest technology (e.g. [29] [1] [16] [31]) and more experimental in creating better visitors’ experiences.
Designing holistic interactions for and with museums Our research has provided designers with evidence for pursuing different solutions respect to BYOD apps. We showed how tangible interaction engages visitors at a deeper level then phones, but we also showed how appreciation for a specific interaction mode is subjective and dependent on the individual visiting style. This opens up opportunities to design “suits” of digital interventions consistent across the exhibition but targeted to different visiting styles [33] [39] [9]. Our findings suggest a phone app is best for an overview while a tangible for deeper engagement. Other options could be explored, what we think is important is for designers to keep in mind that different visiting styles exist and affect visitors’ behaviour as well as visitors’ appreciation.
We showed that the co-design and co-creation process of the Atlantic Wall exhibition seamlessly integrated digital technology, via tangible interaction, with content and the rest of the exhibition (exhibition design). Our design pushed visitors to look more closely at objects and the video content complemented the story and the display, albeit the engagement effect was more prominent in those visitors with an attitude for details. Tangible interaction in museums is still in its infancy and more research is needed to understand how the different elements play together or affect each other. A relevant exploration in this direction is
the prayer-nut tangible experience that combined the touch of a replica with multimedia, smell and action (blowing) [17]: a lab experiment showed some visitors were happy to explore while others were in need of more guidance (this could be an indication of a different visiting style). When taken out of the lab and placed in a real exhibition context, this very rich sensorial experience may be overwhelming and begs the question if there is a risk of overdesigning multisensory experiences when introducing additional elements. In our experiment we found that not everyone is sensitive to aesthetics suggesting that crafted replicas (or other tangibles) may not be worth the cost. However, this is a factor that can be considered in the design phase: our solution purposefully implemented replicas that the museum themselves could fabricate at a very limited cost making it affordable even if it is a marginal feature [23]. Indeed tangible may come with extra costs attached in the same way as phones are. For example, installations such as the Magic Cauldron needed a facilitator for the visitors to get the most out of the interaction as well as to continuously monitor if the technology was responsive and adjust it [32]. The holistic design was matched by a holistic evaluation that considered simultaneously all aspects of the interaction. The creation of an app for the purpose of the evaluation also shows the value of a comparative study in revealing important elements that would not be evident with ‘one-interaction’ evaluation. Overall the cost of implementing the app was limited as all the content and the graphics were already available and the interaction steps already defined by the exhibition design. The limited additional cost for creating an app could be welcome by the museums if the outcome is a wider offer for visitors. Moreover innovation could be tried out in a limited way opening up to more experimental solutions, e.g. an experimental setup [30]. One still untapped opportunity is to consider the multiple touch-points museums offer to visitors and to design for a transmedia visiting experiences that extend the onsite visit online [7][25]. Aspects of service design, exhibition design, interaction design, and web design need then to be considered simultaneously.
ACKNOWLEDGEMENTS
meSch, Material Encounters with Digital Cultural Heritage, (2013-2017) was funded by the European Community’s Seventh Framework Programme, “ICT for access to cultural resources” (ICT Call 9: FP7-ICT-2011-9) under the Grant Agreement 600851.
REFERENCES
1. Archeomatica 2016 Museo Glass Beacon: indagine sul gradimento della visita in realtá aumentata ai Mercati di Traiano https://www.archeomatica.it/musei/museo- glass-beacon-indagine-gradimento-della-visita-realta-aumentata-mercati-di-traiano (accessed 15.9.2017) 2. Virginia Braun and Victoria Clarke. 2006. Using
thematic analysis in psychology. Qualitative research
in psychology, 3(2), 77-101.
3. Carlotta Capurro, Dries Nollet and Daniel Pletinkx 2015. Tangible interfaces for digital museum
applications The Virtex and Virtex Light systems in the Keys to Rome exhibition. Proc of Digital Heritage, Granada, IEEE, 271-276.
4. Luigina Ciolfi, Gabriela Avram, Laura Maye, Nicholas Dulake, Mark T. Marshall, Dick van Dijk, D. and Fiona McDermott. 2016. Articulating Co-Design in Museums: Reflection on Two Participatory Processes, Proceedings of CSCW 2016, New York: ACM, 13-25.
5. Luigina Ciolfi and Marc McLoughlin. 2012. Of Turf Fires, Fine Linen and Porter Cake: Design for Living History, ACM Interactions, XIX.5 September + October, 18-21.
6. Deloitte Global Mobile Consumer Survey 2016, NL edition.https://www2.deloitte.com/content/dam/Deloitt
e/nl/Documents/technology-media- telecommunications/deloitte-nl-tmt-global-mobile-consumer-survey-2016.pdf (accessed 14.9.2017)
7. Lotte de Reus, Jouke Verlinden, Maaike Roozenburg.
2013 Nonlinear stories told by cups and saucers: Smart Replicas with responsive 3D audio. Ar[t] Magazine, 3, 34-39.
8. Maria Economou and E. Meintani. 2011. Promising beginning? Evaluating museum mobile phone apps. Proc. of Rethinking Technology in Museums 2011: Emerging experiences, Limerick, Ireland, 26-27 May 2011.
9. John Falk. 2009 Identity and the Museum Visitor
Experience, Left Coast Press.
10. Kieran Ferris, Liam Bannon, Luigina Ciolfi, Paul Gallagher, Tony Hall, and Marilyn Lennon. 2004. Shaping experiences in the hunt museum: a design case study. In Proceedings of the 5th conference on
Designing interactive systems: processes, practices, methods, and techniques (DIS '04). ACM, , 205-214.
11. Lesley Fosh, Steve Benford, Stuart Reeves, Boriana Koleva and Patrick Brundell. 2013. ‘See Me, Feel Me, Touch Me, Hear Me’: Trajectories and Interpretations in a Sculpture Garden. In Proceedings of SIGCHI Conference on Human Factors in Computing Systems
(CHI '13), 149-158.
12. Gallery One, Cleveland Museum of Art. 2013. Video. (7 March 2013.). Retrieved September 22, 2015 from
https://www.youtube.com/watch?v=qWJqd6lyJ-E
(accessed 15.9.2017)
13. Kerry Hannon. 2016 Museums, the New Social Media Darlings. The New York Times, 28 October
https://www.nytimes.com/2016/10/30/arts/design/muse ums-the-new-social-media-darlings.html?mcubz=1
(accessed 15.9.2017)
14. Adrian Hazzard, Steve Benford and Gary Burnett. 2015 Sculpting a mobile music soundtrack. In Proc. of the SIGCHI Conference on Human Factors in Computing Systems (CHI '15), 387-396.
15. Uta Hinrichs and Sheelagh Carpendale 2011. Gestures in the Wild: Studying Multi-touch Gesture Sequences on Interactive Tabletop Exhibit. InProc. of SIGCHI Conference on Human Factors in Computing Systems
(CHI '11), 3023-3032.
16. Eva Hornecker. 2008. “I don’t understand it either but it’s cool” – Visitor Interactions with a Multi-touch Table in a Museum. In Proceedings of IEEE Tabletop, 121-128.
17. Jean Ho Chu, Daniel Harley, Jamie Kwan, Melanie McBride, and Ali Mazalek. 2016. Sensing History: Contextualizing Artifacts with Sensory Interactions and Narrative Design. In Proceedings of the 2016 ACM Conference on Designing Interactive Systems (DIS '16). ACM, 1294-1302.
18. Andrew Lewis 2013. What do visitors say about using mobile devices in Museums? V&A – Victoria and Albert Museum
http://www.vam.ac.uk/blog/digital-media/museum-visitors-using-mobile (accessed
15.9.2017)
19. David McGookin, Koray Tahiroălu, Tuomas Vaittinen, Mikko Kytö, Beatrice Monastero, and Juan Carlos Vasquez. 2017. Exploring Seasonality in Mobile Cultural Heritage. In Proceedings of the 2017 CHI Conference on Human Factors in Computing Systems (CHI '17). ACM, 6101-6105.
21. NMC Horizon Museum Edition 2016
http://cdn.nmc.org/media/2016-nmc-horizon-report-museum-EN.pdf (accessed 15.9.2017)
22. Daniela Petrelli, Luigina Ciolfi, Dick van Dijk, Eva Hornecker, Elena Not, Albrecht Schmidt. 2013. Integrating material and digital: a new way for cultural heritage. ACM Interactions, 20(4), 58-63.
23. Daniela Petrelli, Nicholas Dulake, Mark T. Marshall, Hub Kockelkorn, Anna Pisetti. 2016. Do it together: The effect of curators, designers, and technologists sharing the making of new interactive visitors’ experiences. Proc. of Museums and the Web 2016
(MW2016)
http://mw2016.museumsandtheweb.com/paper/do-it- together-the-effect-of-curators-designers-and- technologists-sharing-the-making-of-new-interactive-visitors-experiences/ (accessed 11.12.2017)
24. Daniela Petrelli and Elena Not. 2005. User-centred design of flexible hypermedia for a mobile guide: reflections on the HyperAudio experience. UMUAI - User Modeling and User-Adapted Interaction 15(3–4), 303–338
25. Daniela Petrelli, Mark T. Marshall, Sinead O’Brien, Patrick McEntaggart, Ian Gwilt. 2016. Tangible data souvenirs as a bridge between a physical museum visit and online digital experience. Personal and Ubiquitous Computing, 1-15.
26. Daniela Petrelli, Alessandro Soranzo, Luigina Ciolfi and John Reidy. 2016. Exploring the aesthetics of tangible interaction: experiments on the perception of hybrid objects. In Proc. Tangible, Embedded and Embodied InteractionTEI 2016. ACM Press. 27. Margaret H. Szymanski, Paul M. Aoki, Rebecca E.
Grinter, Amy Hurst, James Thornton, and Alison Woodruff. 2007. Sotto Voce: Facilitating Social Learning in a Historic House. Computer Supported Cooperative Work, 17: 5-34.
28. Scott Sayre. 2015 Bring it on: Ensuring the success of BYOD programming in the musuem environment. Proc. Of Museums and the Web.
http://mw2015.museumsandtheweb.com/paper/bring-
it-on-ensuring-the-success-of-byod-programming-in-the-museum-environment/ (accessed 15.9.2017)
29. Beverly Serrell and Britt Raphling. 1992 Computers on the Exhibit Floor. Curator – The Museum Journal, 35, 3: 181-189.
30. Smithsonian Institution. 2002. The Making of Exhibitions: Purpose, Structure, Role, and Process.
http://www.si.edu/content/opanda/docs/rpts2002/02.10. makingexhibitions.final.pdf (accessed 15.9.2017) 31. Neal Stimler. 2013 Seeing the Met through Glass.
http://www.metmuseum.org/blogs/digital-underground/posts/2013/seeing-the-met-through-glass
(accessed 15.9.2017)
32. Robyn Taylor, John Bowers, Bettina Nissen, Gavin Wood, Qasim Chaudhry, Peter Wright, Lindsey Bruce, Sarah Glynn, Helen Mallinson, and Roy Bearpark. 2015. Making Magic: Designing for Open Interactions in Museum Settings. In Proceedings of the 2015 ACM SIGCHI Conference on Creativity and
Cognition (C&C '15). ACM, 313-322. 33. Eliseo Veron and Martine Lavasseur. 1983.
Ethnographie de l’exposition, Bibliotheque Public d’Information, Centre George Pompidou, Paris. 34. Dirk vom Lehn and Christian Heath. 2003. Displacing
the object: mobile technology and interpretive resources. Proc. of Cultural Institution and Digital Technology.http://www.archimuse.com/publishing/ichi m03/088C.pdf
35. Philipp Wacker, Kerstin Kreutz, Florian Heller, and Jan Borchers. 2016. Maps and Location: Acceptance of Modern Interaction Techniques for Audio Guides.
In Proceedings of the 2016 CHI Conference on Human Factors in Computing Systems (CHI '16). ACM, 1067-1071.
36. Ron Wakkary and Marek Hatala. 2007. Situated play in a tangible interface and adaptive audio museum guide.
Personal and Ubiquitous Computing, 11, 171-191. 37. Ron Wakkary, Marek Hatala, Kevin Muise, Karen
Tanenbaum, Greg Corness, Bardia Mohabbati and Jim Budd. 2009. Kurio: A Museum Guide for Families. In Proceedings of Tangible, Embedded and Embodied Interaction (TEI’09), ACM, 215-222.
38. Alexandra Weilenmann, Thomas Hillman, and Beata Jungselius. 2013. Instagram at the museum:
communicating the museum experience through social photo sharing. In Proceedings of the SIGCHI
Conference on Human Factors in Computing Systems (CHI '13). ACM, 1843-1852.