Quantifying the Total Net Benefits of Grid
Integrated Wind
Eleanor Denny, Student Member IEEE, Mark O’Malley, Senior Member IEEE
Abstract— Throughout the world significant development is
being encouraged in wind energy for electricity generation. A complete cost benefit analysis has been conducted in this paper on the impacts of grid connected wind generation. A dispatch model is used to determine the dispatches upon which the costs and benefits can be ascertained for different wind capacities, plant mixes and loads. These costs and benefits are then used to generate net benefit curves for wind generation and the level where the costs exceed the benefits is established. These penetration levels can then be used by policy makers to determine the appropriate quantity of wind generation to promote. A large number of assumptions are tested and it was found that increased interconnection, high CO2 prices and a flexible plant mix are particularly beneficial for wind generation, and that there are positive net benefits for wind energy penetrations of 17% and higher under the chosen set of assumptions for the test system.
Index Terms— Wind power generation, Costs, Power system
economics, Power generation dispatch, Environmental factors, Emissions.
I. INTRODUCTION
W
IND generation penetrations are growing worldwide and there is much speculation on the impact of large levels of wind generation on electricity systems. Wind is a relatively cheap form of renewable energy and can assist in the achievement of renewable energy and emissions reduction targets. However, wind generation is variable and relatively unpredictable and poses unique challenges for system opera-tors and as such, the costs and benefits of wind generation are not clear cut and vary depending on the underlying system [1] [2] [3] [4] [5]. The purpose of doing a detailed investigation of costs and benefits of wind generation is to inform policy makers as to the appropriate quantity of wind generation to promote.Reserve is defined as the additional generation capacity that is required to restore load balance following an im-balance. As the wind generation is variable and difficult to predict accurately it adds to the uncertainty and may require the system operator to carry additional reserve capacity to maintain system security [6]. This increase in the required reserve is a cost to the system imposed by the wind generation [7]. In addition, an increase in variable generation on an electricity system may require the system operator to alter how conventional generation is dispatched [8] [9]. Conventional
This work has been conducted in the Electricity Research Centre, University College Dublin which is supported by Electricity Supply Board (ESB) Net-works, ESB Power Generation, ESB National Grid, Commission for Energy Regulation, Cylon, Airtricity and Enterprise Ireland.
E. Denny and M. O’Malley are with the School of Electrical, Electronic and Mechanical Engineering, University College Dublin, Dublin 4, Ireland (Ph: +353 (0)1 7161857; e-mail: [email protected]; [email protected]).
generation may be obliged to operate at lower operating levels in order to be available to ramp up or down to accommodate the inherent variability of the wind generation. There may also be an increase in the number of start-ups and shut-downs of conventional units as system operators attempt to coordinate the following of the fluctuating load and the variable output of the wind generation [8].
Thermal units are designed to be at their most efficient when online and running at a stable load. In general, units are optimised for continuous rather than cyclical operation and when operating in their normal range can operate for relatively long periods with relatively low risk of failure and loss of equipment life [10]. An increase in the cycling of conventional units, as a result of increased wind penetration, can result in increased wear and tear on the machine and result in a shortening of the life span of the unit [11].
It may be the case that a significant increase in the pene-tration of wind generation may result in a need for greater reinforcement of the network system, and this is a cost imposed by the wind generation [1] [12] [13].
Since the underlying energy source is variable, the output from a wind generator is variable. This variability has an impact on the capacity credit of wind generation. The capacity credit is a measure of the amount of conventional generation that could be displaced by the renewable production without making the system any less reliable [14]. For low levels of installed wind generation, the capacity credit tends to approx-imate the average wind output. However, as wind penetrations increase, the capacity credit tends to reduce as the correlation of the wind generation output on the system increases [14].
Wind generation is likely to displace the output of some thermal units and this can result in a reduction in harmful emissions [15]. A reduction in the operation of thermal units can also lead to a fuel cost saving as wind generation, with a zero fuel cost, replaces units with significant fuel costs.
In this paper, an economic dispatch model is used to calculate the costs and benefits of increasing penetrations of wind generation, and the penetration levels at which the costs exceed the benefits under a large range of scenarios are investigated. The approach adopted attempts to maximise social welfare and thus includes both direct and indirect costs and benefits. As this is a social welfare maximising study, any costs incurred are considered to be societal costs and any benefits are societal benefits, rather than accruing to any particular participant.
by the necessity to constrain the scope of the study. System dynamics, although an important issue for wind integration [16] [17] [18], are highly system specific and require a large scale system model beyond the scope of this paper and as such have been omitted in this analysis. This study represents a near perfectly competitive gross pool electricity market [19]. Thus, the generators are assumed to be profit maximisers and price takers and gaming of the electricity market by individual generators is not taken into account [20]. As discussed in [21] this approach to electricity market modelling is entirely valid. The wind generation is assumed to bid its forecasted output into the pool. Details on the most optimal way for wind gen-erators to participate in the market in order to maximise profit and minimise risk is shown in [22] [23]. Strategic consumer behaviour is not considered and it is assumed that the load continues to grow into the future and that the general daily load profile does not change significantly [24]. In addition, in an attempt to limit the number of assumptions required, it was necessary to omit ‘softer’ factors such as the visual impact of wind generation, the creation of jobs, improvements in local infrastructure, etc.
The costs and benefits associated with wind generation are explained in detail in Sections II and III respectively. Section IV discusses the chosen test system and Section V presents the methodology used in the analysis. The cost and benefit results for the chosen test system are presented in Section VI and these are combined into net benefit curves and are tested under a wide range of scenarios in Section VII. The conclusions are presented in Section VIII.
II. COSTSASSOCIATED WITHWINDGENERATION
The investigated costs include the capital, operation and maintenance costs of wind generation, the network reinforce-ment costs, the costs of cycling of conventional units and the cost of increased reserve.
A. Wind Development Costs
Since wind generation has zero fuel costs, its costs are based mainly on its capital cost, which represent about 75-80% of its total cost. Average capital costs for wind generation currently range between e900 and e1,100 per kW installed [25]. Operating and maintenance costs for wind energy include repair and insurance and represent about 20-25% of the total production costs per kWh for wind energy [25].
B. Network Reinforcement Costs
Increasing the wind generation capacity on a system may result in the need to reinforce the underlying network. This is most likely in rural areas with low population density and sparse networks. It is likely that the reinforcement of high voltage networks would be more expensive than lower volt-age distribution networks [26]. The specific cost of network reinforcement per MW of installed wind generation is highly system specific [12].
C. Cycling Costs of Conventional Units
Even in the absence of variable wind generation, conven-tional generation units are required to cycle in order to meet the load. This cycling includes ramping during load following, low-load cycling, and on/off cycles. When a unit is turned off and on, the boiler, steam lines, turbine and auxiliary compo-nents undergo large thermal and pressure stresses which result in damage. This damage accumulates over time and eventually leads to accelerated component failures and forced outages [11]. This wear and tear on the components is exacerbated by creep-fatigue interaction.
Creep is the change in the size or shape of a material due to constant stress on the material over time. This is likely in units which are operated at continuous output over long periods of time, such as base-loaded units [27]. Fatigue occurs when a material is exposed to fluctuating stresses resulting in fractures and failures. Fatigue is likely during cyclical operation when the materials experience large transients in both pressures and temperatures [28]. Older units which were designed and used for base loaded operation over a number of years and are then forced to cycle on regular basis are very susceptible to component failure through creep and fatigue damage interaction [27].
This depletion of the life expectancy of conventional units is a serious issue when analysing wind generation penetration as it is likely that some units will be moved up the merit order and will switch from being base loaded to being required to be more flexible. This could also occur if an emissions tax was introduced which altered the merit order.
The costs associated with cycling include additional O&M spending associated with increased overhauls, higher heat rates due to low load and variable operation, auxiliary power, fuel during start up, unit life shortening, increased operator error due to greater hands-on operation, etc. It is estimated that these costs can range frome200 toe500,000 (including fuel cost) per single on-off cycle depending on the type of unit [29].
The actual cost of cycling is very difficult to estimate and must be conducted on a plant by plant basis. Grimsrud & Lefton [27] found that a base loaded coal unit with a total installed capacity of 500MW and a fuel cost of $3,000 per cycle, had a true cost of $40,000 per cycle when the costs mentioned above were taken into account. On average, it was estimated that for a large sample of units, the fuel costs represent about 7 - 12% of the total cost associated with cycling for a large supercritical unit, 10 - 15% for an intermediate fossil fuel unit and 20 - 30% for a gas fired turbine [27].
D. Additional Reserve Costs
capacity has little effect on the reserve categories that operate over a short time frame (seconds to minutes) [31]. Increasing amounts of wind capacity causes a greater increase in the need for categories of reserve that act over longer periods of time (20min - 1 hour) [31]. Thus, in this analysis, the assumed reserve requirement is equal to the size of the largest infeed plus the additional reserve based on the installed wind generation [31]. An additional reserve requirement may result in more units operating at lower efficiencies and an increase in the number of units committed which may result in greater cycling costs.
III. BENEFITSASSOCIATED WITHWINDGENERATION
The societal benefits of wind generation include the capacity value of wind generation, the emissions savings and the reduction in the fuel bill resulting from a reduction in output of combustion plant on the system.
A. Capacity Benefit
One of the key benefits associated with increased wind generation is the additional capacity added to the system. The extent to which wind generation can substitute for con-ventional generation is given by the capacity credit of wind and this decreases with increasing installed capacity [14]. The capacity benefit of wind generation can therefore be determined as the saved cost of having to build and maintain additional conventional generation in its place.
B. Emissions Benefit
As the installed capacity of wind generation increases it displaces conventional generation which has an impact on the emissions from the conventional units. Emissions of carbon dioxide (CO2) and sulphur dioxide (SO2) depend on the quantity of carbon and sulphur in the fuel respectively and the quantity of fuel burnt [15]. Thus, a reduction in the operation of a thermal unit will result in a reduction in CO2 andSO2 emissions. Nitrogen Oxides (NOX) formation is more complex and does not depend solely on the nitrogen content of the fuel but is also affected by the flame temperature, the oxygen concentration and the residence time [32]. Previous work on the impact of wind generation on emissions is shown in [15].
C. Fuel Savings Benefit
When wind generation displaces electricity produced from thermal units, the quantity of fuel burnt by the thermal units reduces and wind generation provides a fuel saving [33]. The value of this saving depends on the price of the fuel saved and is impacted by a number of factors. The load factor of the wind generation gives the MWh produced per MW installed and as this reduces the incremental fuel saving reduces. Wind generation has seasonal variations which impact on the fuel saving. An increase in the cycling of conventional units will reduce the fuel savings from wind generation as start ups are fuel expensive. In addition, prolonged cycling can have a detrimental impact on plant heat rates [29].
IV. THETESTSYSTEM
The chosen test system for this study is Ireland where wind generation currently represents 8% of total installed capacity and this is expected to grow to 12% by 2010 and 20% by 2020, in a relatively inflexible system [34]. The Irish electricity system is made up of two separately operated but interconnected systems, one in the Republic of Ireland and one in Northern Ireland. This paper studies an ‘all Ireland’ elec-tricity system, covering the Republic of Ireland and Northern Ireland (referred to jointly in this paper as ‘Ireland’). It has an installed capacity of 7,600MW and one 400 MW HVDC interconnector to Scotland [35]. Ireland is unique in having a large natural peat resource and peat fired generation accounts for approximately 350MW of Ireland’s installed capacity [35]. There is a relative generation capacity shortage in Ireland and temporary diesel generators are currently employed during periods of peak demand during the winter months [34]. This illustrates the need for additional capacity on the Irish system but also highlights the limitations of the system in responding to large fluctuations in wind generation production. Ireland is thus an ideal test system to investigate the system impacts of wind generation as the effects are relatively easier to identify. The costs and benefits are calculated for the years 2010, 2015 and 2020. The assumed plant mixes for these years were based on the projected generation plant mix considering increased wind penetration for the test system from [34] and the optimal future generation portfolio for the test system to accommodate large penetrations of wind generation from [36]. Preliminary results from the Government sponsored ‘All Island Renewable Grid Study’ [37] specifically aimed at determining the optimal plant mix for 2020 were also used to inform the assumptions on the generation portfolios.
The proposed all Ireland single electricity market (SEM) is a gross pool market with centralised commitment [38]. The model used in this paper aims to reflect this market and is validated against a full unit commitment model of the system. Although many electricity markets are moving away from centrally controlled dispatch, it has been shown in [39] that a model which allows the generators to bid incrementally and self commit produces solutions almost identical to those from a centralised unit commitment [39] [40]. In fact, centralised unit commitment can be used for the prediction of operating decisions in decentralised markets [39]. Thus, although the model used here reflects a centralised gross pool electricity market, it could also reflect the operating decisions in alterna-tive electricity market designs.
V. METHODOLOGY
PLEXOS model is unable to handle updated wind forecasts and as such a perfect wind forecast is required [42]. Given these significant limitations, a second model was designed, called the dispatch model. The main advantage of this model over the unit commitment model is the speed at which it reaches a solution and the ability to include wind forecasts. It also allows complete flexibility in changing assumptions and running wide ranging scenarios. The dispatch model was benchmarked against the Unit Commitment model at a number of different installed wind capacities.
The dispatch model aims to represent a deregulated gross pool electricity market and generates least-cost dispatches using a linear programming formulation which co-optimises generators’ operating and reserve levels on an hourly basis (discussed in detail in [15] and [43]). The aim is to minimise the following objective function:
min
ÃN X
i=1
cpiPi+ N
X
i=1
criRi
!
(1)
wherePiis the power from unit i andRiis the primary reserve from unit i. The energy and reserve bids of generator i are given by cpi and cri respectively and N is the number of generators. Generators are assumed to have linear bids for en-ergy and reserve and the constraints included are load balance, reserve capacity requirement, maximum and minimum rated capacities, and in order to be dispatched for reserve, a unit must be on and the sum of its dispatched energy and reserve cannot exceed its maximum generation [15] [43].
Discrete decisions must be made about the on/off status of a generator to ensure it is not dispatched below its minimum rated capacity. Since the dispatch model does not explicitly contain discrete decision variables, the following approach was adopted to mimic these on/off decisions. The model is first run with each generator’s power output permitted to range between 0 and maximum generation. This results in optimality, however some units may be dispatched below their minimum operating point. Since it is assumed that generators have linear bids for energy and reserve it is assumed that those units which have been dispatched below their minimum must be utilised to ensure load balance. These units are thus required to be turned on, and as such, this first run of the dispatch model essentially determines which units should be on and which off. The algorithm is then run a second time, this time only including those units which have been turned on in the first stage and forcing them to operate between their minimum and maximum rated capacities. The algorithm now returns a feasible dispatch. Thus, the first run of the model essentially determines which units will be on and the second run determines their operating levels. Running the model in two stages like this is particularly advantageous when trying to model wind power forecasts, as described below.
A. Wind in the Dispatch Model
It is the two stage approach of the dispatch model which is one of its key advantages when looking at wind generation. The first stage of the model essentially returns a ‘commitment’
decision, by deciding which units should be turned on and which should be off. The second stage of the model does not turn on or off any units but determines their operating levels (economic dispatch). This approach can account for the unpredictability of wind generation forecasts by using a long range wind forecast in the first stage and an updated wind generation forecast in the second stage, representing actual system operation. As such, the commitment decisions are based on a longer range wind forecast and the operating levels are based on an updated forecast as would be expected in reality. For the purposes of this paper, the time between the two model runs was assumed to be 6 hours, reflecting wind forecasting characteristics [44]. Thus, for each hour, the commitment decisions are made 6 hours ahead of that hour and the dispatch decisions are made virtually at real time. This two stage approach, with commitment and dispatch taking account of wind power forecasts, has also been adopted in the Siemens PROMOD software, used in [8], and the two stage methodology is also employed in the MORE CARE control software, which is described in detail for an island system in [5], [9]. An alternative economic dispatch model which includes network constraints using genetic algorithms to dispatch an island system with wind is described in [45].
The dispatch model generates a long range wind power forecast based on historical wind power data [35] and the standard deviations of wind power forecast errors [31]. An ‘average’ wind power forecast error with a standard deviation of 9% of the installed capacity was used [31]. This implies that 68% of the time, the forecast of the wind power output is within 1 standard deviation (9% installed capacity) of the actual wind power output. A ‘best’ case and a ‘worst’ case wind power forecast with a 7% and 14% standard deviation respectively are also tested, representing the most accurate and the least accurate the total wind power forecast error is likely to be, for a forecast horizon of 6 hours ahead [31]. In [31] these wind power forecast errors are taken into account when calculating the additional reserve required with increased wind generation.
The dispatch model does not explicitly include temporal constraints, however, once the dispatch model had been run, the compliance levels with the temporal constraints were checked. Each unit was evaluated to see if it remained within its required ramp rates, obeyed its minimum up and down times and allowed the required start time prior to each start. Some minor tuning of the model ensured that in all wind penetration scenarios, the dispatch model returned realistic dispatches when compared with the PLEXOS dispatches, with compliance levels in excess of 95% for ramp rates and in excess of 90% for the minimum up and down time and start time constraints. The test system has one pumped storage station and a small concentration of hydro power plants. Given the complex operating nature of these units, the hydro and pumped storage plant were optimised in the full Unit Commitment model described above, and the operating levels were then used as an input in the dispatch model [42].
words, if generation exceeds the load when all committed conventional generators are running at their minimum, then no conventional unit is switched off and the wind generation is curtailed. The breach of Equation (2) below results in the curtailment of wind generation by an amount equal to the load minus the sum of the minimum generation of the committed generators. This situation occurred rarely but increased as the installed wind capacity increased.
N
X
i=1
(δi,jPmin,i) + Windj ≤Loadj ∀j (2)
where N is the number of generators on the system,Pmin,iis the minimum generation for unit i,δis either 1 or 0 depending on whether unit i has been committed in hour j. Windj is the updated wind power forecast for hour j and Loadj is the forecasted load in hour j. A perfect load forecast was assumed under the premise that wind power forecast errors are likely to dominate load forecast errors [31].
2) Wind Shortfall: If the long range wind power forecast overestimates the actual wind output and commits too few plant to meet the load in the commitment stage of the model, then the dispatch model forces on units with very short start up times, such as OCGTs, to meet the shortfall in generation in the second stage of the model. This occurs if Equation (3) does not hold true.
N
X
i=1
(δi,j(Pmax,i−Ri)) + Windj≥Loadj ∀j (3)
wherePmax,iis the maximum capacity of generator i andRi is the dispatched reserve for unit i. The breach of constraint (3) occurred more frequently than (2) and increased as the installed wind capacity increased.
B. Load Factors
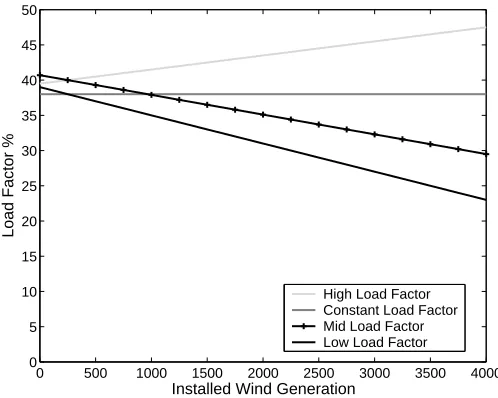
The electricity output of a wind generator is based on its load factor. The load factors for wind generation in Ireland typically range from 25% - 40% depending on a large range of factors including location, turbine size, season etc. [46]. The different load factors tested in this paper are summarised in Figure 1. It is assumed that the most favourable sites for wind turbines will be developed first and these are likely to have the highest load factor. For this reason, it is assumed that the load factor per MW installed decreases with increasing installed capacity in the ‘low’ and ‘mid’ load factor cases as the number of feasible favourable sites reduces. For illustrative purposes, a ‘constant’ load factor has been included and the ‘high’ load factor case represents the situation where new development in wind penetration is in offshore sites with higher load factors and in onshore sites with advances in wind turbine efficiency.
C. Plant Mix and Load Growth
The analysis for the test system is done for three different years, and is based on the projected load and plant mixes for the years 2010, 2015 and 2020. The plant portfolio for 2010 was based on generation projections given in [34]. It is
0 500 1000 1500 2000 2500 3000 3500 4000
0 5 10 15 20 25 30 35 40 45 50
Load Factor %
Installed Wind Generation
[image:5.612.314.563.54.253.2]High Load Factor Constant Load Factor Mid Load Factor Low Load Factor
Fig. 1. Assumed load factors with increasing installed wind generation
envisaged that any new additions to the conventional plant mix will be gas fired [34] [47]. For 2015, it is assumed that the planned 400MW interconnector to Wales will be developed in addition to the development of three new gas fired units, and the retirement of two old oil fired units [34]. For 2020, another two oil fired units are retired due to age and are replaced with an additional three gas fired units [36]. Increases in hydro generation and pumped storage were considered under the Government sponsored ‘All Island Renewable Grid Study’ [37] and were found not to be viable for the Irish system, and are thus not included here.
The dispatch model was run for a month for each of the test years and was then scaled up by a weighted factor for each month to represent the entire year. In order to effectively calculate the net benefits, each cost and benefit was then discounted by the chosen discount rate over a 20 year period. Three different discount rates of 6%, 8% and 10% are tested in this paper [47].
There are three demand growths analysed, low, medium and high, with 2.5%, 3.2% and 4.3% growth respectively [34].
D. Fuel Prices
There are a range of fuel prices investigated in the analysis, based on [47] [36], and summarised in Table I. The same growth is not used for each fuel price as some fuel prices are expected to grow by more than others. For example, it is likely that gas prices will grow more than coal due to an increase in the development of cleaner more efficient gas fired plant [47].
E. Wind Development Costs
TABLE I FUEL COSTS IN(e2006)
Year Scenario Gase/GJ Coale/GJ Oile/GJ
2010
Low 4.16 2.16 4.13 Mid 4.37 2.17 4.27 High 4.58 2.18 4.40
2015
Low 4.41 2.17 4.30 Mid 5.04 2.22 4.71 High 5.66 2.26 5.12
2020
Low 4.91 2.21 4.63 Mid 6.41 2.31 5.62 High 7.91 2.41 6.61
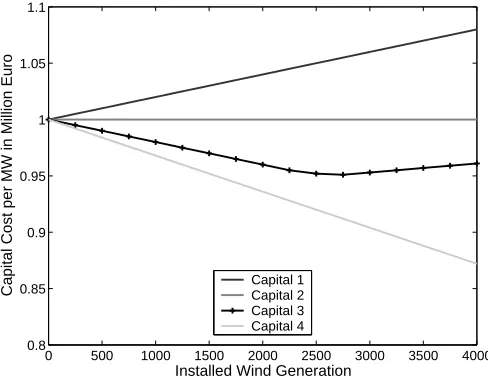
for smaller onshore wind farms. Under ‘capital 2’, the cost remains constant as the installed wind generation increases. In capital 3 and 4 the capital cost reduces incrementally due to likely advances in technology and turbine size. Under ‘capital 3’ it has been assumed that the most accessible and efficient sites are developed first. As more and more wind generation is connected, the number of feasible wind farm sites reduces and the size of wind farms is likely to decline. Due to a reduction in economies of scale for smaller wind farms and the likely increase in off-shore wind development it has been assumed that the cost per MW will begin to increase beyond a certain point. This point, where the capital cost begins to increase, was based on a forecast of the current feasible installed wind capacity on the island of Ireland, given in [48]. Capital costs continue to decrease under ‘capital 4’ under the assumption of technology advances.
0 500 1000 1500 2000 2500 3000 3500 4000
0.8 0.85 0.9 0.95 1 1.05 1.1
Capital Cost per MW in Million Euro
[image:6.612.52.296.456.645.2]Installed Wind Generation Capital 1 Capital 2 Capital 3 Capital 4
Fig. 2. Assumed capital cost per MW of installed wind generation
Throughout the study the costs are analysed on an annual basis, and in order to annualise the capital costs, they are assumed to be equivalent to an annuity [47], [49]. Operation and maintenance costs are assumed to be e35,000 per MW installed per annum [36].
F. Network Reinforcement Costs
Initial estimates of the likely network costs associated with increasing penetrations of wind generation in Ireland are given in [37] and further work is planned on these costs in [12]. At the current wind penetration level in Ireland (700MW) there are no network constraints with respect to wind generation on the grid and it is envisaged that deep network reinforcement would not be required until above 1500MW installed wind generation. Network reinforcement costs are estimated to range frome25m at 1750MW installed toe400m at 4000MW [37]. These estimates of network costs are included in the results and are expressed as an annuity.
VI. RESULTS
The costs and benefits discussed in Sections II and III are now calculated for the test system. The capital costs, network reinforcement costs (Sections V-E and V-F) and capacity benefits (Section VI-C) are independent of the dispatch model, however, the other results are based on the dispatches from the model.
A. Cycling Cost
In order to calculate the cost of cycling associated with increased penetrations of wind generation on the Irish system, all startups and ramping were translated into the number of equivalent hot starts (EHS) for each generator [50]. By analysing the rate of temperature and pressure change during each cycling activity, it was possible to express each cycling duty as a percentage of the temperature and pressure change during a hot start [11], [50]. This conversion rate was assumed to be equivalent to the related damage associated with each activity [11]. Table II illustrates the EHS conversion rates of the different cycling activities used in this paper.
TABLE II
CYCLING ACTIVITY EXPRESSED AS AN EQUIVALENT HOT START[11]
Activity EHS
Cold Start 2.28 Warm Start 1.77 Hot Start 1.00 10% Ramp 0.05
0 500 1000 1500 2000 2500 3000 3500 4000 0
50 100 150 200
Cycling Cost in Million Euro
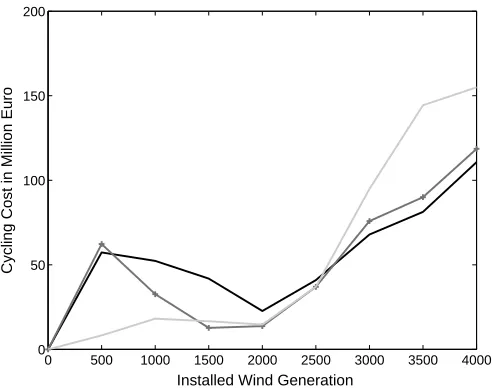
[image:7.612.52.298.53.247.2]Installed Wind Generation
Fig. 3. Cost of equivalent hot starts with increasing wind penetration
As Figure 3 shows, wind generation causes an increase in the cost of cycling across each of the three test years. In 2010 and 2015 there is a reduction in the added cycling costs between 500 and 2000MW of installed wind generation. This is due to the wind generation pushing the oil units down the merit order so they are used less frequently and replacing them with more flexible gas fired generation on the margin. As the installed wind generation increases beyond 2000MW, there is an increase in the cycling of baseloaded units which further increases the cycling costs.
B. Reserve
The increase in reserve requirement with increasing instal-lations of wind generation was based on [31]. Wind generation impacts on the requirement of slow acting reserve, 20min - 1 hour, known as replacement reserve. The cost for replacement reserve was taken to be e1.15 per MW per hour [30].
Since the dispatch model cooptimises energy and reserve, there are occasions when a unit must be switched on in order to provide reserve. As the reserve requirement increases, the switching on of units to provide reserve increases. In addition, the burden of having to provide an increased level of reserve results in the operation of more plants at lower levels of operation and thus lower efficiencies. These indirect costs of additional reserve are captured by a greater EHS cost plus lower emissions and fuel benefits (Sections VI-A, D and E).
C. Capacity Credit Benefit
The capacity credit reduces with increased wind penetration, and for Ireland ranges from 41% at low wind penetrations to 20% at high wind penetrations [36]. The capacity benefit of wind generation can therefore be deemed as the saved cost of having to build additional conventional generation in its place. It is assumed that new conventional generation built in Ireland will be gas fired, with a capital cost ofe600,000 per MW installed and operation and maintenance costs ofe50,000 per MW per year [47] [36].
D. Emission Savings Benefit
As the installed capacity of wind generation increases it displaces conventional generation which has an impact on the emissions from the conventional units. Using the plant operating schedules attained from the model described in Section V, the resulting hourlyCO2,SO2andNOx emissions from the conventional units are calculated by using specific emissions information for each generator from [35]. Start-up emissions ofCO2 were considered as well as increasedNOx emissions during periods of significant ramping [15].
The value of the CO2 emissions savings is given by the CO2 emissions market price. Since there is not currently an emissions market forSO2andNOx in Europe, the emissions costs are nominally assumed to range frome50 toe350 per ton forSO2and frome1000 toe7000 per ton forNOx, based on emissions markets in the United States [51], [52]. Four different emissions prices were analysed and these prices are summarised in Table III. In the dispatch model, an emissions factor (based on the average CO2, SO2 and NOx emissions per MW) is included in the bid price of each generator to represent the price ofCO2,SO2 andNOx.
TABLE III
EMISSIONSCOSTS INePER TON
Emission Low Mid High Highest
CO2 10 30 50 70
SO2 50 150 250 350
NOx 1000 3000 5000 7000
0 500 1000 1500 2000 2500 3000 3500 4000 0
10 20 30 20000 25000
Emissions in Kilotons
0 500 1000 1500 2000 2500 3000 3500 40000 100 200 300 400 500
Benefit in Million Euro
Installed Wind Generation
CO2 SO2 NOx
Low Emission Price Mid Emission Price High Emission Price Highest Emission Price
Fig. 4. Emissions benefits with increasing wind generation
Figure 4 illustrates the emissions benefits from increasing levels of wind generation forCO2,SO2andNOxfor the 2010 plant mix and load. The magnitude ofCO2emissions is much larger than for the other two emissions, however, for ease of illustration all three emissions have been plotted on the same axis in Figure 4. Given the magnitude of theCO2 emissions, the values of the benefits curves are dictated by the price of CO2 rather than the other emissions prices.
due to the conventional units running at lower efficiencies and being required to cycle more frequently, which reduces the potential emissions savings.
E. Fuel Saving Benefit
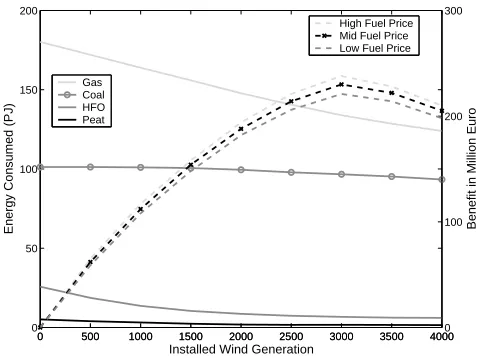
As wind generation displaces electricity produced from thermal units the quantity of fuel burnt by the thermal units changes. Figure 5 illustrates the annual fuel consumption in petajoules for each fuel type on the Irish system for 2010, and shows how the consumption changes with increasing wind generation. The benefits are valued under different fuel prices from Table I, and these prices were also used in the dispatch of the generators. As Figure 5 shows, the main reduction in fuel use is for gas fired plants.
0 500 1000 1500 2000 2500 3000 3500 4000 0
50 100 150 200
Energy Consumed (PJ)
0 500 1000 1500 2000 2500 3000 3500 40000 100 200 300
Benefit in Million Euro
Installed Wind Generation
High Fuel Price Mid Fuel Price Low Fuel Price
Gas Coal HFO Peat
Fig. 5. Fuel savings with increasing wind generation
VII. NETBENEFITS
The costs and benefits curves for the test system were described in Section VI and these curves are now summed into a single cost function and a single benefit function for each level of installed wind generation, and the costs are then subtracted from the benefits to give the net benefits function, as shown in Equation (4).
N BW = T X
t=1
1 (1 +r)t
(CBW+EW +F SW)−(CW
+OMW+N WW+CYW +RW)
(4)
where N BW represents the net benefits at wind penetration W. T is the assumed term over which the costs and benefits are discounted and r is the discount rate. The benefits at wind penetration W are given by the capacity benefit CBW, plus the emissions benefit EW, plus the fuel saving benefit F SW. The costs are made up of the capital cost CW, the operating and maintenance costOMW, the network reinforcement cost
N WW, the cycling costsCYW and the reserve costRW. The figures that follow show how the net benefit curve changes with modifications in the underlying assumptions. Figure 6 illustrates the net benefits curve for wind using the
TABLE IV
BASECASEASSUMPTIONSSUMMARISED
Assumption Scenario
Load Factor Mid (Figure 1) Wind Power Forecast Error 9% (Section V-A)
Fuel Price Mid (Table I) Wind Capital Costs Capital 3 (Figure 2)
Emissions Costs Mid (Table III) Discount rate 8%
EHS Cost Fuel is 10-30% of cost (Section VI-A)
0 500 1000 1500 2000 2500 3000 3500 4000
−3000 −2000 −1000 0 1000 2000 3000 4000
Installed Wind Generation
Net Benefit in Millions of Euro
[image:8.612.54.294.242.421.2]2020 2015 2010
Fig. 6. Base case net benefits of wind generation
load, plant mixes and fuel prices for 2010, 2015 and 2020 under the base case assumptions (summarised in Table IV).
The net benefit curves illustrate where the incremental net benefits begin to decline and more importantly, the points where the costs exceed the benefits (where net benefits are ≤0), representing the critical points beyond which no further investment should be made in wind generation. The critical point is lower for 2010, at approximately 2790MW, represent-ing approximately 21% of total electricity generation, due to the installed plant mix being more inflexible and having less interconnection than 2015 and 2020. In addition the presence of an east west interconnector with a capacity of 400MW makes a highly significant impact on the net benefits of wind generation in 2015 and 2020. The retirement of the oil fired units is also highly beneficial to wind. The critical point for wind generation in 2015 is 2994MW and in 2020 is 3705MW (representing approximately 21.5% and 22.2% of electricity generation respectively).
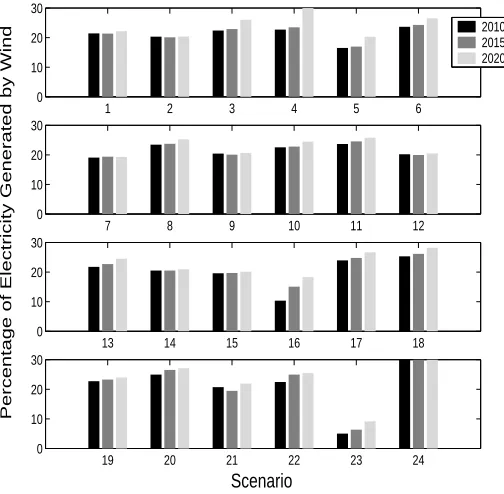
stated, the only value altered in each scenario is the one under investigation, all other values are as they are in the base case. Although this paper analysed only installed wind capacities up to 4000MW (representing 27.6% of electricity generated in 2010), Figure 7 shows percentages up to 30%. This is due to the fact that in many scenarios, the critical values were above 4000MW and in these cases, the critical values are found by linear extrapolation from the net benefits curve at 4000MW.
TABLE V SCENARIOSEXPLAINED
Details
1 Base Case (see Table IV) 2 ‘Low’ load factor 3 ‘Constant’ load factor 4 ‘High’ load factor
5 ‘Worst’ wind power forecasts 6 ‘Best’ wind power forecasts 7 ‘Low’ demand growth 8 ‘High’ demand growth 9 ‘Low’ fuel price growth 10 ‘High’ fuel price growth 11 Discount rate of 6% 12 Discount rate of 10%
13 ‘Low’ wind capital cost scenario 14 ‘Constant’ wind capital cost scenario 15 ‘High’ wind capital cost scenario 16 ‘Low’ emissions price
17 ‘High’ emissions price 18 ‘Highest’ emissions price
19 Fuel cost represent 50% of cycling cost 20 Fuel cost represent 80% of cycling cost 21 ‘High’ fuel price and ‘High’ wind capital cost
22 ‘High’CO2price, noSO2 andNOxprice and ‘High’ fuel price 23 Bad case for wind (scenarios 2, 5, 7, 9, 12, 15, 16 combined) 24 Good case for wind (4, 6, 8, 10, 11, 13, 18, 20 combined)
As illustrated by comparing scenarios 2 to 4 in Figure 7, the chosen load factor has an impact on the net benefits curve. A high load factor results in a shift in the net benefits curve upwards and to the right, Figure 6, resulting in the critical value, where costs exceed benefits, occurring at a higher installed capacity (3002MW in scenario 4 compared to 2586MW under scenario 2 in 2010). This is due to the higher emissions and fuel use benefits with a higher load factor, but the same capital cost as under the lower load factor scenario. Scenarios 5 and 6 investigate the impact of wind power forecast errors and, as expected, the ‘worst’ case forecast results in a lower critical value than the base case and the ‘best’ case forecast yields a higher critical value.
Scenarios 7 and 8 show an interesting result whereby high demand growth is preferred to low demand growth. With low demand growth, wind generation represents a higher proportion of the dispatched plant. This results in the marginal plants being higher up the merit order, and in Ireland, this means older, more inefficient coal fired units. These units are then required to cycle more frequently resulting in large cycling costs. On the other hand, if the demand growth was high, the wind generation represents a smaller percentage of
1 2 3 4 5 6
0 10 20 30
7 8 9 10 11 12
0 10 20 30
13 14 15 16 17 18
0 10 20 30
Percentage of Electricity Generated by Wind
19 20 21 22 23 24
0 10 20 30
Scenario
[image:9.612.51.302.177.474.2]2010 2015 2020
Fig. 7. Impact of different assumptions on critical values
the electricity generation, plus the marginal units are more likely to be gas fired units which are more flexible and have a lower cost per cycle. Scenarios 9 and 10 show that a high fuel price results in greater fuel bill savings by wind generation and leads to a higher critical value.
Scenarios 11 to 15 show that a higher discount rate and higher capital costs lead to a lower critical value. In addition, it is interesting to note that although wind generation is highly capital intensive, assuming a constant capital cost still maintains the shape of the net benefits curve and the critical value is less than the base case.
Scenarios 16 to 18 show the impact of different emissions prices. A low emissions price results in low emissions benefits to wind generation. A high emissions price significantly alters the merit order, shifting coal units from operating at baseload to operating on the margin, resulting in greater emissions savings at a higher price. This shift in the merit order also increases the cycling costs which restrains the critical value at a level not much greater than the base case.
The base case scenario puts a cost on cycling of 3 to 12 times the fuel cost depending on the unit (Section VI-A). Scenarios 19 and 20 assume that actual cycling costs are in fact much lower with fuel costs representing 50% and 80% of total cycling cost respectively. If this is the case, the critical value for wind generation increases.
and produces a dramatically reduced critical value across each scenario. A good range of scenarios for wind are shown in scenario 24 resulting in high net benefits for wind of over 40% in each year. From Figure 7 it is clear that in all but the low emissions and worst case scenarios, the critical value for wind generation in Ireland is above 17% for each test year, which represents about 2087MW in 2010, 2531MW in 2015 and above 3117MW in 2020.
A large number of assumptions were required for this study and many of these assumptions, if changed, could alter the results shown here. For instance, it was assumed that the electricity market was a perfectly competitive market. However, it is likely that if a generating company had a large degree of market power (and was not being actively controlled by the electricity system regulator) that strategic bidding behaviour could alter the market outcome with gen-erators withholding output in order to achieve higher prices [20]. Strategic behaviour by consumers, and the presence of non-generating participants on the supply side (such as Virtual Power Producers [53]) were also neglected in this study and may alter the outcomes. It was also necessary to omit dynamic security issues and transmission constraints, which are costs which could be imposed on the system by increases in wind generation and their inclusion could reduce the net benefits of wind generation. This study used estimates of network reinforcement costs from [37], however, a more detailed investigation into the likely network costs of wind generation is currently underway in [12]. In addition, this work attributed all the costs and benefits of wind generation to society in general. However, in reality, these costs and benefits will be ascribed to particular participants, often on a ‘causer-pays’ principle. Determining which participants will be better or worse off with the addition of wind generation is an interesting study. It is intended that these issues will be included in future work.
VIII. CONCLUSION
This paper investigated the costs and benefits of wind gener-ation and the extent to which a large number of assumptions affect the net benefits. By comparing a number of different scenarios it was found that by increasing the amount of interconnection the net benefits of wind generation increase significantly. A more flexible plant mix with lower cycling costs, such as an increase in gas fired units and a reduction in oil fired units is also beneficial to the net benefits of wind. In addition, improvements in the net benefits are seen with a high demand growth when compared to low demand growth. High fuel prices lead to greater scope for wind generation. Given the magnitude ofCO2emissions compared to the other emissions, the price ofCO2is highly significant whereas the net benefits of wind are not particularly sensitive to the price of SO2and NOx emissions. The benefits for wind generation of a high CO2price are somewhat limited by the increased cycling costs associated with a change in the type of unit on the margin. Characteristics of the wind industry can significantly improve the net benefits of wind such as more accurate forecasting, higher load factors and reduced capital and operating costs.
It was found that in all but the low emissions and worst case scenarios, the critical value for wind generation in Ireland is above 17% for each test year, under the chosen assumptions.
ACKNOWLEDGMENT
The authors gratefully acknowledge the contributions of P. Grimsrud, J. Fitz Gerald, K. Neuhoff, M. Kelly, J. Butler, M. O’Mahony and D. O’Kane .
REFERENCES
[1] G. Strbac, “Quantifying the system cost of additional renewable gener-ation in 2020,” Available: http://www.dti.gov.uk, 2002.
[2] S. Kennedy, “Wind power planning: assessing long term costs and benefits,” Energy Policy, vol. 33, pp. 1661–1675, 2005.
[3] H. Holttinen, The impact of large scale wind power production on the Nordic electricity system - VTT publications 554. VTT technical research centre of finland: Julkaisija, 2004.
[4] We Energies, “System operation impacts of wind generation integration - etk2044,” Available: http://www.uwig.org, 2003.
[5] N. Hatziargyriou et al, “Energy management and control of island power systems with increased penetration from renewable energy sources,” in IEEE Power Engineering Society Winter Meeting, 2002.
[6] L. Soder, “Reserve margin planning in a wind-hydro-thermal power system,” IEEE Transactions on Power Systems, vol. 8, 1993.
[7] UK Energy Research Centre, “The costs and impacts of intermittency,” Available: http://www.ukerc.ac.uk, 2006.
[8] ESB National Grid (Eirgrid), “Impact of wind power generation in ireland on the operation of conventional plant and the economic im-plications,” Available: http://www.eirgrid.com, 2004.
[9] N. Hatziargyriou et al, “Operation and control of island systems - the crete case,” in IEEE Power Engineering Society Winter Meeting, 2000. [10] A Report Prepared by the IEEE Current Operating Problems Subcom-mittee, “Operational aspects of generation cycling,” IEEE Transactions on Power Systems, vol. 5, no. 4, pp. 1194–1203, 1990.
[11] S. Lefton, P. Besuner, and G. Grimsrud, “Understand what it really costs to cycle fossil-fired units,” Power, vol. 141, no. 2, pp. 41–42, 1997. [12] All Island Renewable Grid Study - Workstream 3, “Network studies,”
Available: http://www.dcmnr.gov.ie, 2006.
[13] J. Kabouris and N. Hatziargyriou, “Wind power in greece - current situation future developments and prospects,” in IEEE PES General Meeting, Montreal, Canada, 2006.
[14] R. Castro and L. Ferreira, “A comparison between chronological and probabilistic methods to estimate wind power capacity credit,” IEEE Transactions on Power Systems, vol. 16, pp. 904–909, 2001.
[15] E. Denny and M. O’Malley, “Wind generation, power system operation, and emissions reduction,” IEEE Transactions on Power Systems, vol. 21, no. 1, pp. 341–347, 2006.
[16] M. Palsson, T. Toftevaag, K. Uhlen, and J. Tande, “Control concepts to enable increased wind power penetration,” in IEEE PES General Meeting, Toronto, Canada, 2003, pp. 1984–1990.
[17] V. Akhmatov et al., “A dynamic stability limit of grid connected induction generators,” in Proc. of IASTED International Conference on Power and Energy Systems, Marabella, Spain, 2000, pp. 235–244. [18] Commission for Energy Regulation, “Options for operational rules to
curtail wind generation,” Available: www.cer.ie, 2004.
[19] M. Katz and H. Rosen, Microeconomics, 3rd ed. McGraw-Hill Companies, 1998.
[20] X. Guan, Y. Ho, and D. Pepyne, “Gaming and price spikes in electric power markets,” IEEE Transactions on Power Systems, vol. 16, 2001. [21] P. Correia, “Decentralised unit commitment in a market structure:
problem formulation and solution advancement,” IEE Proceedings on Generation, Transmission and Distribution, vol. 153, no. 1, 2006. [22] G. Bathurst, J. Weatherill, and G. Strbac, “Trading wind generation
in short term energy markets,” IEEE Transactions on Power Systems, vol. 17, no. 3, pp. 782–789, aug 2002.
[23] S. Galloway et al., “Managing the risk of trading wind energy in a competitive market,” IEE Proceedings on Generation, Transmission and Distribution, vol. 153, no. 1, 2006.
[24] Transmissions System Operator Ireland, “Transmission forecast state-ment 2006 - 2012,” Available http://www.eirgrid.com, 2006.
[26] P. Gardner et al., “The impacts of increased levels of wind penetration on the electricity systems of the Republic of Ireland and Northern Ireland,” Final Report to the Commission for Energy Regulation/OFREG by Garrad Hassan, vol. 3096/GR/04, 2003.
[27] P. Grimsrud and S. Lefton, “Economics of cycling 101: what do you need to know about cycling costs and why?” APTECH Engineering Technical Paper TP098, http://www.aptecheng.com, 1995.
[28] S.A. Lefton et al, “Optimizing power plant cycling operations while reducing generating plant damage and costs at the irish electric supply board,” in International conference on plant maintenance for managing life and performance, Baltica IV, Helsinki, Stockholm, 1998. [29] S. Lefton and P. Besuner, “Power plant cycling operations and
un-bundling their effect on plant heat rate,” APTECH Technical Paper TP134 - Available: http://www.aptecheng.com.
[30] ESB National Grid (Eirgrid), “Statement of charges and payments for ancillary services providers 2005,” www.eirgrid.ie, 2005.
[31] R. Doherty and M. O’Malley, “New approach to quantify reserve demand in systems with significant installed wind capacity,” IEEE Transactions on Power Systems, vol. 20, no. 2, pp. 587–595, 2005. [32] U. Kesgin, “Study on prediction of the effects of design and operating
parameters on NOx emissions from a leanburn natural gas engine,” Energy Conversion and Management, vol. 44, pp. 907–921, 2003. [33] A. Malik and A. Awsanjli, “Energy fuel saving benefit of a wind
turbine,” in IEEE MELECON, Dubrovnik, Croatia, May 2004. [34] Transmission System Operator Ireland, “Generation adequacy report:
2006 - 2012,” Available: www.eirgrid.com, 2005.
[35] All Island Project, “All-island modelling project. Available: http://www.allislandproject.org,” 2005.
[36] R. Doherty, H. Outhred, and M. O’Malley, “Establishing the role that wind may have in future generation portfolios,” IEEE Transactions on Power Systems, vol. 21, pp. 1415–1421, 2006.
[37] All Island Renewable Grid Study - Workstream 2A, “High level assess-ment of suitable generation portfolios for the all-island system in 2020,” http://www.dcmnr.gov.ie, 2006.
[38] The Single Electricity Market, “High level design decision paper -AIP/SEM/42/05,” Available: www.allislandproject.org, June 2005. [39] J. Xu and R. Christie, “Decentralised unit commitment in competitive
energy markets,,” in DIMAC Conference on Unit Commitment, Rutgers, New Jersey. Also published as a chapter in Hobbs, Rothkopf, O’Neill and Chao, eds., The Next Generation of Electric Power Unit Commitment Models, Kluwer., 1999.
[40] S. Ede, R. Zimmerman, T. Mount, R. Thomas, and W. Schulze, “An economic analysis of the self commitment of thermal units.” in Proc. 33rd Hawaii International Conference on System Sciences, 2000. [41] PLEXOS for Power Systems - Electricity Market Simulation,
www.draytonanalytics.com.
[42] E. Denny, G. Bryans, J. FitzGerald, and M. O’Malley, “A quantitative analysis of the net benefits of grid integrated wind,” in IEEE PES General Meeting, Montreal, Canada, June 2006.
[43] R. Doherty, G. Lalor, and M. O’Malley, “Frequency control in compet-itive electricity market dispatch,” IEEE Transactions on Power Systems, vol. 20, no. 3, pp. 1588–1596, 2005.
[44] I. Marti et al., “Evaluation of advanced wind power forecasting models - results of the anemos project,” Available: http://anemos.cma.fr, 2006. [45] I. Damousis, A. Bakirtzis, and P. Dokopoulos, “Nework-constrained eco-nomic dispatch using real-coded genetic algorithm,” IEEE Transactions on Power Systems, vol. 18, no. 1, 2003.
[46] British Wind Energy Association, “Can we rely on the wind - online,” Available: http://www.bwea.com/energy/rely.html, 2005.
[47] Commission for Energy Regulation Ireland, “Best new entrant price 2006 - CER/05/110,” Available: www.cer.ie, 2005.
[48] Sustainable Energy Ireland (SEI), “Final report- economic analysis of RES-E support mechanisms,” Available: www.sei.ie, 2004.
[49] Royal Academy of Engineering, “The costs of generating electricity,” Available: www.raeng.org.uk, 2004.
[50] Editorial, “Profitable operation requires knowing how much it costs to cycle your unit,” Combined Cycle Journal, Second Quarter 2004. [51] United States EPA, “SO2 allowance market analysis,” Available:
http://www.epa.gov, 2006.
[52] United States EPA - NOx State Implementation Plan, “Evaluat-ing ozone control programs in the eastern united states,” Available: http://www.epa.gov, 2006.
[53] H. Morais et al., “A decision-support simulation tool for virtual power producers,” in International Conference on Future Power Systems, Amsterdam, Netherlands, Nov. 2005, pp. 1–6.
Eleanor Denny received a B.A. degree in Eco-nomics and Mathematics and a M.B.S. degree in Quantitative Finance from University College Dublin. She is currently studying for a Ph. D. degree in the Electricity Research Centre, University Col-lege Dublin with research interests in the economics of wind generation.