AV
+
EC 2015 – The First Affect Recognition Challenge
Bridging Across Audio, Video, and Physiological Data
Fabien Ringeval
University of Passau Chair of Complex & IntelligentSystems Passau, Germany
Björn Schuller
∗ University of Passau Chair of Complex & IntelligentSystems Passau, Germany
Michel Valstar
University of NottinghamMixed Reality Lab Nottingham, UK
Shashank Jaiswal
University of NottinghamMixed Reality Lab Nottingham, UK
Erik Marchi
Technische UniversitätMünchen
Institute for Human-Machine Communication Munich, Germany
Denis Lalanne
University of Fribourg Human-IST Research CenterFribourg, Switzerland
Roddy Cowie
Queen’s University BelfastSchool of Psychology Belfast, UK
Maja Pantic
† Imperial College LondonIntelligent Behaviour Understanding Group
London, UK
ABSTRACT
We present the first Audio-Visual+ Emotion recognition
Challenge and workshop (AV+EC 2015) aimed at compari-son of multimedia processing and machine learning methods for automatic audio, visual and physiological emotion anal-ysis. This is the 5th event in the AVEC series, but the very first Challenge that bridges across audio, video and physiological data. The goal of the Challenge is to provide a common benchmark test set for multimodal information processing and to bring together the audio, video and phys-iological emotion recognition communities, to compare the relative merits of the three approaches to emotion recogni-tion under well-defined and strictly comparable condirecogni-tions and establish to what extent fusion of the approaches is pos-sible and beneficial. This paper presents the challenge, the dataset and the performance of the baseline system.
∗The author is further affiliated with Imperial College
Lon-don, Intelligent Behaviour Understanding, LonLon-don, UK.
†The author is further affiliated with Twente University,
EEMCS, Twente, The Netherlands.
Permission to make digital or hard copies of all or part of this work for personal or classroom use is granted without fee provided that copies are not made or distributed for profit or commercial advantage and that copies bear this notice and the full cita-tion on the first page. Copyrights for components of this work owned by others than ACM must be honored. Abstracting with credit is permitted. To copy otherwise, or re-publish, to post on servers or to redistribute to lists, requires prior specific permission and/or a fee. Request permissions from [email protected].
AVEC’15, October 26 2015,Brisbane, Australia c
2015 ACM. ISBN 978-1-4503-3743-4/15/10. . . $15.00 DOI: http://dx.doi.org/10.1145/2808196.2811642.
Categories and Subject Descriptors
H.4 [Information Systems Applications]: Miscellaneous; D.2.8 [Software Engineering]: Metrics—complexity mea-sures, performance measures
General Terms
Theory
Keywords
Affective Computing, Emotion Recognition, Speech, Facial Ex-pression, Physiological Signals, Challenge
1.
INTRODUCTION
Following up from the last Audio Visual Emotion Recognition Challenge (AVEC) event [26], which focused on emotion recogni-tion as a regression problem, AV+EC 2015 aims to accelerate re-search in automatic continuous affect recognition from audio, video and, for the first time ever, physiological data. This is therefore the first multimodal challenge bridging across audio-visual and physi-ological information for emotion recognition in multimedia data.
One of the reasons that have motivated the inclusion of auto-nomic signals in the AV+EC 2015 dataset, besides being comple-mentary to audio-visual data for the description of affective be-haviours [13], is that more and more wearable devices now in-clude physiological sensors, such as electrodermal activity or elec-trocardiogram, at an affordable cost, allowing affective interaction through wearable computing in the near future [3]. Robust mod-els of emotion from physiological signals are therefore required, as well as the knowledge of their relevance in comparison with the performance obtained with the traditional audio-visual models.
Table 1: Inter-rater reliability on arousal and va-lence for the 6 raters and the 27 subjects of the RECOLA database; raw or normalised ratings [18].
RMSE CC CCC ICC α
Raw
Arousal .344 .400 .277 .775 .800 Valence .218 .446 .370 .811 .802
Normalised
Arousal .263 .496 .431 .827 .856 Valence .174 .492 .478 .844 .829
arousal and valence. As benchmarking database the RECOLA mul-timodal corpus will be used [20]. Even though this database does not feature human-machine but rather human-human interaction, we strongly believe that the latter is the most interesting type of communication to study for the development of systems that will interact with humans, as we want such systems achieving realistic human-like behaviours in the near future.
Although we provide as baseline standard feature sets for audio, video and physiological modalities, participants can use their own algorithms to perform features extraction. The standard feature sets can also be solely used to investigate machine learning algorithms. We however strongly encourage participants to consider all modal-ities for the emotion prediction task, which makes it possible to evaluate the relative merit of each modality. Participants have only five trials to upload their results on the test sets, whose labels are unknown to them. The organisers preserve the right to re-evaluate the findings, but will not participate themselves in the Challenge.
The Challenge baseline is the average performance over arousal and valence from the best approach, which corresponds here to the inclusion of all modalities. As evaluation measure, we chose the Concordance Correlation Coefficient (CCC) [15], which combines the Pearson’s correlation coefficient (CC) with the square differ-ence between the mean of the two compared time series:
ρc=
2ρσxσy
σ2
x+σ2y+ (µx−µy)2
, (1)
whereρis the Pearson correlation coefficient between two time se-ries (e. g., prediction and gold standard),σ2
xand σ2ythe variance
of each time serie, andµxandµythe mean value of each.
There-fore, predictions that are well correlated with the gold standard but shifted in value are penalised in proportion to the deviation.
This paper is organised as follow: we next introduce the Chal-lenge corpus and labels (Sec. 2), then audio, visual and physiolog-ical baseline features (Sec. 3), and baseline results (Sec. 4), before concluding (Sec 5).
2.
RECOLA DATABASE
The RECOLA database [20] was recorded to study socio-affective behaviours from multimodal data in the context of remote collaborative work, for the development of computer-mediated communication tools [19]. It is freely available for scientific pur-poses from:https://diuf.unifr.ch/diva/recola/.
[image:2.595.338.535.90.165.2]Spontaneous and naturalistic interactions were collected during the resolution of a collaborative task that was performed in dyads and remotely through video conference. Multimodal signals, i. e., audio, video, electro-cardiogram (ECG) and electro-dermal activ-ity (EDA), were synchronously recorded from 27 French-speaking subjects. Even though all subjects speak French fluently, they have different nationalities (i. e., French, Italian or German), which thus provide some diversity in the encoding of affect.
Table 2: Partitioning of the RECOLA database into train, dev(elopment), and test sets.
# train dev test
female 6 5 5
male 3 4 4
French 6 7 7
Italian 2 1 2
German 1 1 0
ageµ(σ) 21.2 (1.9) 21.8 (2.5) 21.2 (1.9)
Regarding the annotation of the dataset, time-continuous ratings (40 ms binned frames) of emotional arousal and valence were per-formed by six gender balanced French-speaking assistants for the first five minutes of all recordings, because participants discussed more about their strategy – hence showing emotions – at the begin-ning of their interaction.
To assess inter-rater reliability, we computed the intra-class cor-relation coefficient (ICC(3,1)) [24] and the Cronbach’sα[4]; rat-ings are concatenated over all subjects. Additionally, we computed the root-mean-square error (RMSE), the Pearson’s CC and the CCC [15]; values are averaged over theC6
2pairs of raters. Results
indi-cate a very strong inter-rater reliability for both arousal and va-lence, cf. Table 1. A normalisation technique based on the Eval-uator Weighted Estimator [9] and introduced in [18] is used prior to the computation of the gold standard, i. e., the average of all rat-ings for each subject. This technique has significantly (p <0.001
for CC) improved the inter-rater reliability for both arousal and va-lence, with a stronger improvement on the former dimension; CCC has been improved by 56%. The Fisher Z-transform is used to per-form statistical comparisons between CC in this study.
Finally, the dataset was divided into speaker disjoint subsets for training, development (validation) and testing, by stratifying (bal-ancing) on gender and mother tongue, cf. Table 2.
3.
BASELINE FEATURES
In the followings we describe how the baseline feature sets are computed for audio, video and physiological data.
3.1
Audio Features
In contrast to large scale feature sets, which have been success-fully applied to many speech classification tasks [18, 26], smaller, expert-knowledge based feature sets have also shown high robust-ness for the modelling of emotion from speech [17, 2]. Some rec-ommendations for the definition of a minimalistic acoustic standard parameter set have been recently investigated, and have led to the Geneva Minimalistic Acoustic Parameter Set (GeMAPS) and to an extended version (eGeMAPS) [7], which is used here as base-line. The acoustic low-level descriptors (LLD) cover spectral, cep-stral, prosodic and voice quality information and are extracted with theopenSMILEtoolkit [8], cf. Table 3.
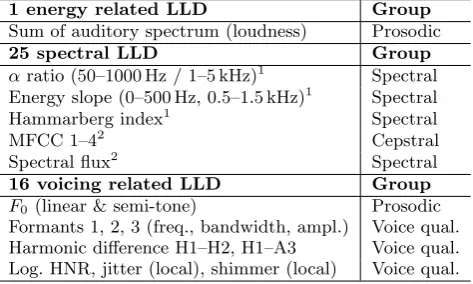
[image:2.595.75.271.95.172.2]Table 3: 42 acoustic low-level descriptors (LLD); 1
computed on voiced and unvoiced frames, re-spectively; 2computed on voiced, unvoiced and all frames, respectively.
1 energy related LLD Group
Sum of auditory spectrum (loudness) Prosodic
25 spectral LLD Group
αratio (50–1000 Hz / 1–5 kHz)1 Spectral
Energy slope (0–500 Hz, 0.5–1.5 kHz)1 Spectral
Hammarberg index1 Spectral
MFCC 1–42 Cepstral
Spectral flux2 Spectral
16 voicing related LLD Group
F0 (linear & semi-tone) Prosodic
Formants 1, 2, 3 (freq., bandwidth, ampl.) Voice qual. Harmonic difference H1–H2, H1–A3 Voice qual. Log. HNR, jitter (local), shimmer (local) Voice qual.
regions only. Additionally, the average RMS energy is computed and 6 temporal features are included: the rate of loudness peaks per second, mean length and standard deviation of continuous voiced and unvoiced segments and the rate of voiced segments per sec-ond, approximating the pseudo syllable rate. Overall, the acoustic baseline features set contains 102 features.
3.2
Video Features
Facial expressions play an important role in the communication of emotion [6]. They are usually quantified by two types of facial descriptors: appearance and geometric based [25]. For the video baseline features set, we computed both, using Local Gabor Bi-nary Patterns from Three Orthogonal Planes (LGBP-TOP) [1] for appearance and facial landmarks [28] for geometric.
The LGBP-TOP are computed by splitting the video into spatio-temporal video volumes. Each slice of the video volume extracted along 3 orthogonal planes (x-y,x-tandy-t) is first convolved with a bank of 2D Gabor filters. The resulting Gabor pictures in the di-rection ofx-yplane are divided into 4x4 blocks. In thex-tandy-t directions they are divided into 4x1 blocks. The LBP operator is then applied to each of these resulting blocks followed by the con-catenation of the resulting LBP histograms from all the blocks. A feature reduction is then performed by applying a Principal Com-ponent Analysis (PCA) from a low-rank (up to rank 500) approx-imation [10]. We obtained 84 features representing 98 % of the variance.
In order to extract geometric features, we tracked 49 facial landmarks with the Supervised Descent Method (SDM) [28] and aligned them with a mean shape from stable points (located on the eye corners and on the nose region). As features, we computed the difference between the coordinates of the aligned landmarks and those from the mean shape, and also between the aligned landmark locations in the previous and the current frame; this procedure pro-vided 196 features in total. We then split the facial landmarks into groups according to three different regions: i) the left eye and left eyebrow, ii) the right eye and right eyebrow and iii) the mouth. For each of these groups, the Euclidean distances (L2-norm) and the angles (in radians) between the points are computed, provid-ing 71 features. We also computed the Euclidean distance between the median of the stable landmarks and each aligned landmark in a video frame. In total the geometric set includes 316 features.
Both appearance and geometric feature sets are interpolated by a piecewise cubic Hermite polynomial to cope with dropped frames.
3.3
Physiological Features
Physiological signals are strongly correlated with emotion [14, 13], despite not being directly perceptible the way audio-visual are. Although there are some controversies about peripheral physiology and emotion [22, 12], we believe that autonomic measures must be considered along with audio-visual data in the realm of affective computing, as they do not only provide complementary descrip-tions of affect but can also be easily and continuously monitored with wearable sensors [21, 16, 3].
As baseline features, we extracted features from both ECG and EDA signals with overlapping (step of 40 ms) windows of 4 s length [18]. From the ECG signal, we extracted 28 features: the heart rate (HR) and its measure of variability (HRV), the zero-crossing rate, the 4 first statistical moments, the normalised length density, the non-stationary index, the spectral entropy, slope, mean frequency plus 12 spectral coefficients, the power of HR in low frequency (LF, 0.04-0.15 Hz), high frequency (HF, 0.15-0.4 Hz) and the LF/HF power ratio; the first order derivate is additionally computed on all excepted HR and HRV, which provided 54 features in total.
EDA reflects a rapid, transient response called skin conductance response (SCR), as well as a slower, basal drift called skin conduc-tance level (SCL) [5]. Both, SCL (0–0.5 Hz) and SCR (0.5–1 Hz) are estimated using a 3rd order Butterworth filter, 30 features are then computed: the temporal slope of EDA (first coefficient of a first order regression polynomial), the spectral entropy and mean frequency of SCR, the non-stationary index, the normalised length density, the 4 first statistical moments, the mean value of the first order derivate and the proportion and mean of its negative part for EDA, SCL and SCR. The first order derivate is additionally com-puted for all, providing 60 features in total.
4.
CHALLENGE BASELINE
All the five feature sets, i. e., audio, video (appearance and geo-metric), ECG and EDA are normalised per recording (i. e., subject) using az-score and processed separately. For unimodal emotion recognition, we used a hybrid decision-fusion based on Support Vector Regression (SVR) and Neural Networks (NN).
For SVR, we used a linear kernel and trained a model with one frame out of every twenty to reduce the computation time. The training was performed with the Sequential Minimum Optimisation algorithm implemented in Weka [11]; the complexity parameterC was optimised on the development set with values in[10−4−100]. For NN, we exploited all frames to train three types of architec-ture with theCURRENNTtoolkit [27] and by applying the same setup as in [18]: i) feed-forward (FF, no contextual information), ii) long short-term memory (LSTM, inclusion of past information) and iii) bilateral long short-term memory (BLSTM, inclusion of past and future information). The best architecture of NN is kept according to the performance obtained on the development parti-tion.
As the predictions made with either SVR or NN are partially noisy, we applied a median-filtering with the window size opti-mised on the development partition and values in[0.2−20]s.
Fusion of SVR and NN predictions obtained on a given modality is performed by a linear regression model:
P redSV R−N N =α∗P redSV R+β∗P redN N+u, (2)
where P redSV R and P redN N are the predictions provided by
SVR and NN for a given modality, respectively,α,βanduare
regression coefficients estimated on the development partition by minimising the squared error, andP redSV R−N N is the fused
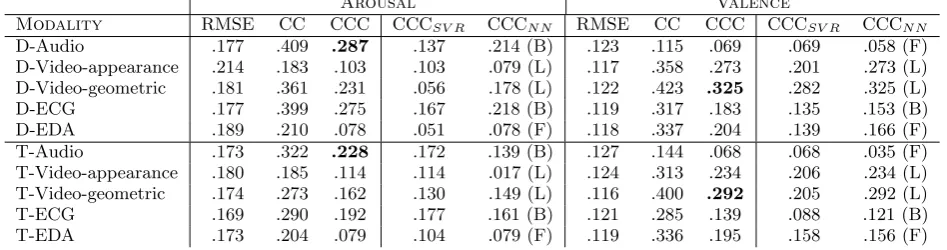
Table 4: Results on the development (D) and test (T) partitions with decision-fusion of SVR and NN from audio, video (appearance and geometric), ECG and EDA feature sets. Performance obtained with each predictor is also provided for the CCC metric and the best NN architecture from the development partition is given in parentheses; F: Feed-Forward, L: LSTM, B: BLSTM.
Arousal Valence
Modality RMSE CC CCC CCCSV R CCCN N RMSE CC CCC CCCSV R CCCN N
D-Audio .177 .409 .287 .137 .214 (B) .123 .115 .069 .069 .058 (F) D-Video-appearance .214 .183 .103 .103 .079 (L) .117 .358 .273 .201 .273 (L) D-Video-geometric .181 .361 .231 .056 .178 (L) .122 .423 .325 .282 .325 (L) D-ECG .177 .399 .275 .167 .218 (B) .119 .317 .183 .135 .153 (B) D-EDA .189 .210 .078 .051 .078 (F) .118 .337 .204 .139 .166 (F) T-Audio .173 .322 .228 .172 .139 (B) .127 .144 .068 .068 .035 (F) T-Video-appearance .180 .185 .114 .114 .017 (L) .124 .313 .234 .206 .234 (L) T-Video-geometric .174 .273 .162 .130 .149 (L) .116 .400 .292 .205 .292 (L) T-ECG .169 .290 .192 .177 .161 (B) .121 .285 .139 .088 .121 (B) T-EDA .173 .204 .079 .104 .079 (F) .119 .336 .195 .158 .156 (F)
Table 5: Multimodal baseline results on the devel-opment and test partitions with decision-fusion.
Arousal Valence
RMSE CC CCC RMSE CC CCC Dev. .161 .559 .476 .105 .548 .461
Test. .164 .354 .444 .113 .490 .382
In order to ensure good generalisation abilities of the fusion of the two predictors (i. e., SVR and NN), we empirically defined a threshold on the relative improvement to consider the fusion as rel-evant: if a relative improvement of more than 10 % is obtained with the fusion of the two predictors on the development partition – in comparison with the performance obtained by the best predictor (i. e., either SVR or NN) – the fusion of SVR and NN predictions is performed on the test partition; the best predictor is kept other-wise and used on the test partition.
Multimodal fusion of the five modalities, i. e., audio, video (ap-pearance and geometric), ECG and EDA, is then performed with another linear regression model:
P redmulti=m+ N X
i=1
γi∗P redu(i), (3)
whereP redu(i)is the unimodal prediction of the modalityifrom
theNavailable ones – obtained either by the fusion of SVR and NN predictions or by the best of the two predictors,γiandmare
regression coefficients estimated on the development partition, and P redmultiis the fused prediction.
Results obtained on each of the five feature sets are depicted in Table 4. Fusion of SVR and NN predictions shows that those two predictors are complementary for half of the cases; SVR performs best on the appearance features for arousal and on the audio fea-tures for valence, whereas NN performs best on EDA for arousal and on both appearance and geometric features for valence.
Acoustic features perform significantly better than all other modalities on arousal (p <0.05), despite the performance being much lower than the one reported in [18], because of the impor-tant reduction of the feature space we performed in this study (only 102 features are used here in total). Facial descriptors, i. e., both appearance and geometric features, perform significantly better on valence (p < 0.01), which is consistent with many other studies, e. g., [18, 26]. Further, geometric features provide the best overall performance on the prediction of valence, as it has also been shown
for the prediction of facial expressions as well as for the estima-tion of their intensity [25]. Another remarkable result is that the physiological signals are also well ranked in terms of performance for emotion prediction: ECG performs second best on arousal and EDA second best for valence by considering appearance and ge-ometric features as a single modality. Autonomic measures have therefore a strong potential to provide complementary descriptions of affective behaviours in comparison to those obtained from audio-visual data.
The best type of NN architecture, i. e., the type of contextual information, seems to depend on the modality: FF provides best performance for EDA, LSTM for facial descriptors and BLSTM for ECG; results are more contrasted for audio data. These results suggest that the most relevant features for EDA might be carried by the SCL, which presents such slow variations over time that they cannot be successfully modelled by the memory units used in (B)LSTM. Whereas the body response in terms of heart rate can vary rapidly over time and occur either before (e. g., by anticipation of the stimuli) or after (e. g., by reaction to a stimuli) the expressed emotion; it is thus better modelled with BLSTM. Regarding facial expressions, the appraisal theory suggests that emotion should be seen first in the face [23], which might explain the preference for LSTM.
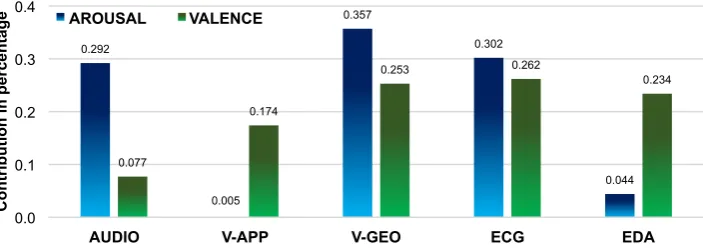
Multimodal baseline results are given in Table 5. The improve-ment of the performance over the best unimodal prediction is very high (p < 0.001), which thus show the relevance of using multi-modal information for the time-continuous prediction of emotion in terms of arousal and valence. In order to depict the contribution of each modality in the prediction of emotion, we normalised the linear regression coefficients that were learned for the multimodal fusion model into a percentage:
Ci= 100∗
|γi| PN
k=1|γk|
, (4)
whereCiis the contribution of the modalityiin percentage, and
γkare the regression coefficients of the multimodal fusion model.
0.292
0.005
0.357
0.302
0.044 0.077
0.174
0.253 0.262
0.234
0.0 0.1 0.2 0.3 0.4
AUDIO V-APP V-GEO ECG EDA
C
o
n
tr
ib
u
ti
o
n
in
p
er
ce
n
ta
g
[image:5.595.130.482.55.179.2]e AROUSAL VALENCE
Figure 1: Percentage of contribution of each modality in the prediction of emotion; values are derived from the multimodal fusion model; V-APP: video appearance; V-GEO: video geometric; ECG: electrocardiogram; EDA: electrodermal activity.
5.
CONCLUSIONS
We introduced the Audio-Visual+ Emotion recognition Chal-lenge (AV+EC 2015), the fifth event in the AVEC series but also the very first Challenge uniting audio-visual and physiological in-formation. It addresses the detection of the affective dimensions arousal and valence in continuous time and value, from audio, video and – for the first time ever – physiological data. This pa-per described AV+EC 2015’s challenge data, baseline features and results.
By intention, we used open-source softwares for both features extraction and machine learning algorithms. We also opted for the highest possible transparency and realism for the baselines by refraining from feature space optimisation and optimising on test data. By using hybrid predictors (SVR and NN) combined with a decision-level fusion of five multimodal feature sets (audio, facial appearance, facial geometry, ECG and EDA), we showed that mul-timodality is a key to achieve high performance in the prediction of emotional arousal and valence from spontaneous recordings, as all modalities contribute to the prediction of emotion. Further, we also showed that physiological signals are complementary to audio-visual data for the description of affective behaviours, which thus confirm their strong potential for affective computing.
6.
ACKNOWLEDGMENTS
The research leading to these results has received funding from the EC’s Seventh Framework Programme through the ERC Start-ing Grant No. 338164 (iHEARu), and the EU’s Horizon 2020 Pro-gramme through the Innovative Action No. 644632 (MixedEmo-tions), No. 645094 (SEWA) and the Research Innovative Action No. 645378 (ARIA-VALUSPA). The authors would further like to thank the sponsors of the challenge, the Association for the Ad-vancement of Affective Computing (AAAC) and audEERING UG. The responsibility lies with the authors.
7.
REFERENCES
[1] T. R. Almaev and M. F. Valstar. Local Gabor Binary Patterns from Three Orthogonal Planes for Automatic Facial Expression Recognition. InProc. of ACII, pages 356–361, Geneva, Switzerland, 2013. IEEE Computer Society. [2] D. Bone, C.-C. Lee, and S. S. Narayanan. Robust
Unsupervised Arousal Rating: A Rule-Based Framework with Knowledge-Inspired Vocal Features.IEEE Transactions on Affective Computing, 5(2):201–213, April-June 2014.
[3] M. Chen, Y. Zhang, M. M. H. Yong Li, and A. Alarmi. AIWAC: Affective interaction through wearable computing and cloud technology.IEEE Mobile Wearable
Communications, 22(1):20–27, 2015.
[4] L. J. Cronbach. Coefficient alpha and the internal structure of tests.Psychometrika, 16(3):297–334, 1951.
[5] M. Dawson, A. Schell, and D. Filion. The electrodermal system. In J. T. Cacioppo, L. G. Tassinary, and G. G. Berntson, editors,Handbook of psychophysiology, volume 2, pages 200–223. Cambridge: Cambridge University Press, 2007.
[6] P. Ekman, W. V. Friesen, and J. Hager.Facial action coding system. Salt Lake City, UT: Research Nexus, 2002.
[7] F. Eyben, K. Scherer, B. Schuller, J. Sundberg, E. André, C. Busso, L. Devillers, J. Epps, P. Laukka, S. Narayanan, and K. Truong. The Geneva Minimalistic Acoustic Parameter Set (GeMAPS) for Voice Research and Affective Computing.
IEEE Transactions on Affective Computing, 2015. in press.
[8] F. Eyben, F. Weninger, F. Groß, and B. Schuller. Recent developments in openSMILE, the Munich open-source multimedia feature extractor. InProc. of ACM MM, pages 835–838, Barcelona, Spain, 2013.
[9] M. Grimm and K. Kroschel. Evaluation of natural emotions using self assessment manikins. InProc. of IEEE ASRU, pages 381–385, San Juan, Puerto Rico, 2005.
[10] N. Halko, P.-G. Martinsson, Y. Shkolnisky, and M. Tygert. An algorithm for the principal component analysis of large data sets.Journal on Scientific Computing,
33(5):2580–2594, October 2011.
[11] M. Hall, E. Frank, G. Holmes, B. Pfahringer, P. Reutemann, and I. H. Witten. The WEKA data mining software: an update.ACM SIGKDD Explorations Newsletter, 11(1):10–18, June 2009.
[12] D. Keltner and J. S. Lerner. Emotion. In S. Fiske, D. Gilbert, and G. Lindzey, editors,Handbook of Social Psychology, volume 1, pages 317–331. John Wiley & Sons Inc., 5th edition, 2010.
[13] R. B. Knapp, J. Kim, and E. André. Physiological signals and their use in augmenting emotion recognition for human–machine interaction. InEmotion-Oriented Systems – The Humaine Handbook, pages 133–159. Springer Berlin Heielberg, 2011.
for emotion analysis using physiological signals.IEEE Transactions on Affective Computing, 3:18–31, 2012. [15] L. Li. A concordance correlation coefficient to evaluate
reproducibility.Biometrics, 45(1):255–268, March 1989. [16] R. Picard. Affective media and wearables: surprising
findings. InProc. of ACM MM, pages 3–4, Orlando (FL), USA, 2014. ACM.
[17] F. Ringeval, S. Amiriparian, F. Eyben, K. Scherer, and B. Schuller. Emotion recognition in the wild: Incorporating voice and lip activity in multimodal decision-level fusion. In
Proc. of EmotiW, ICMI, pages 473–480, Istanbul, Turkey, 2014. ACM.
[18] F. Ringeval, F. Eyben, E. Kroupi, A. Yuce, J.-P. Thiran, T. Ebrahimi, D. Lalanne, and B. Schuller. Prediction of asynchronous dimensional emotion ratings from audiovisual and physiological data.Pattern Recognition Letters, November 2014, in press.
[19] F. Ringeval, A. Sonderegger, B. Noris, A. Billard, J. Sauer, and D. Lalanne. On the influence of emotional feedback on emotion awareness and gaze behavior. InProc. of ACII, pages 448–453, Geneva, Switzerland, 2013. IEEE Computer Society.
[20] F. Ringeval, A. Sonderegger, J. Sauer, and D. Lalanne. Introducing theRECOLAmultimodal corpus of remote collaborative and affective interactions. InProc. of EmoSPACE, FG, Shanghai, China, 2013.
[21] A. Sanoa, R. W. Picard, and R. Stickgold. Quantitative analysis of wrist electrodermal activity during sleep.
International Journal of Psychophysiology, 94(3):382–389, 2014.
[22] S. Schachter. Cognition and peripheralist-centralist
controversies in motivation and emotion. In M. S. Gazzaniga, editor,Handbook of Psychobioogy, pages 529–564. Academic Press Inc., 2012.
[23] K. R. Scherer, A. Schorr, and T. Johnstone. Appraisal processes in emotion: Theory, methods, research. In K. R. Scherer, A. Schorr, and T. Johnstone, editors,Series in Affective Science. Oxford University Press, New York and Oxford, 2001.
[24] P. Shrout and J. Fleiss. Intraclass correlations: Uses in assessing rater reliability.Psychological Bulletin, 86(2):420–428, 1979.
[25] M. Valstar, G. McKeown, M. Mehu, L. Yin, M. Pantic, and J. Cohn. FERA 2015 - Second Facial Expression
Recognition and Analysis Challenge. InProc. of FG, Ljublijana, Slovenia, May 2015. IEEE.
[26] M. Valstar, B. Schuller, K. Smith, T. Almaev, F. Eyben, J. Krajewski, R. Cowie, and M. Pantic. AVEC 2014 – The Three Dimensional Affect and Depression Challenge. In
Proc. of ACM MM, Orlando (FL), USA, November 2014. [27] F. Weninger, J. Bergmann, and B. Schuller. Introducing
CURRENNT – the Munich Open-Source CUDA RecurREnt Neural Network Toolkit.Journal of Machine Learning Research, 16(3):547–551, 2015.
![Table 1:Inter-rater reliability on arousal and va-lence for the 6 raters and the 27 subjects of theRECOLA database; raw or normalised ratings [18].](https://thumb-us.123doks.com/thumbv2/123dok_us/8679160.378022/2.595.338.535.90.165/table-reliability-arousal-subjects-therecola-database-normalised-ratings.webp)