VOLUME 19 ISSUE 12 FEBRUARY 2015 ISSN 1366-5278
DOI 10.3310/hta19120
The Cannabinoid Use in Progressive Inflammatory
brain Disease (CUPID) trial: a randomised double-blind
placebo-controlled parallel-group multicentre trial
and economic evaluation of cannabinoids to slow
progression in multiple sclerosis
Inflammatory brain Disease (CUPID)
trial: a randomised double-blind
placebo-controlled parallel-group
multicentre trial and economic
evaluation of cannabinoids to slow
progression in multiple sclerosis
Susan Ball,
1
*
Jane Vickery,
2
Jeremy Hobart,
2
Dave Wright,
1
Colin Green,
3
James Shearer,
3,4
Andrew Nunn,
5
Mayam Gomez Cano,
1
David MacManus,
6
David Miller,
6
Shahrukh Mallik
6
and John Zajicek
2
1
Centre for Biostatistics, Bioinformatics and Biomarkers, Plymouth University
Peninsula Schools of Medicine and Dentistry, Plymouth, UK
2
Peninsula Clinical Trials Unit, Plymouth University Peninsula Schools of Medicine
and Dentistry, Plymouth, UK
3
Health Economics Group, University of Exeter Medical School, Exeter, UK
4
Centre for the Economics of Mental and Physical Health, Institute of Psychiatry,
Psychology and Neuroscience, King
’
s College London, London, UK
5
Medical Research Council Clinical Trials Unit, London, UK
6
University College London
’
s Institute of Neurology, London, UK
*Corresponding author
Declared competing interests of authors:John Zajicek reports grants and personal fees from the Medical Research Council, personal fees from Bayer Schering, personal fees from Institut für klinische Forschung, Berlin, grants from the Multiple Sclerosis Society and grants from the Multiple Sclerosis Trust outside the submitted work. David Miller reports grants from Multiple Sclerosis Society of Great Britain and Northern Ireland, grants from University College London/University College London Hospitals Biomedical Research Centre, during the conduct of the study; grants and other from Biogen Idec, grants and other from Novartis, grants and other from GlaxoSmithKline, grants from the National Institute for Health Research, grants from Genzyme, grants from the US National Multiple Sclerosis Society and the Multiple Sclerosis Society of Great Britain and Northern Ireland, other from Bayer Schering, other from Mitsubishi Pharma Ltd, other from Merck, other from Chugai and personal fees from McAlpines Multiple Sclerosis, 4th edition, outside the submitted work. David MacManus reports grants from Biogen Idec, grants from GlaxoSmithKline, grants from Apitope, grants from Novartis and grants from Richmond Pharma outside the submitted work.
Ball S, Vickery J, Hobart J, Wright D, Green C, Shearer J,et al. The Cannabinoid Use in Progressive Inflammatory brain Disease (CUPID) trial: a randomised double-blind placebo-controlled
parallel-group multicentre trial and economic evaluation of cannabinoids to slow progression in multiple sclerosis.Health Technol Assess2015;19(12).
Health Technology Assessmentis indexed and abstracted inIndex Medicus/MEDLINE,Excerpta Medica/EMBASE,Science Citation Index Expanded(SciSearch®) andCurrent Contents®/
ISSN 1366-5278 (Print)
ISSN 2046-4924 (Online)
Impact factor: 5.116
Health Technology Assessmentis indexed in MEDLINE, CINAHL, EMBASE, The Cochrane Library and the ISI Science Citation Index and is assessed for inclusion in the Database of Abstracts of Reviews of Effects.
This journal is a member of and subscribes to the principles of the Committee on Publication Ethics (COPE) (www.publicationethics.org/).
Editorial contact: [email protected]
The full HTA archive is freely available to view online at www.journalslibrary.nihr.ac.uk/hta. Print-on-demand copies can be purchased from the report pages of the NIHR Journals Library website: www.journalslibrary.nihr.ac.uk
Criteria for inclusion in theHealth Technology Assessmentjournal
Reports are published inHealth Technology Assessment(HTA) if (1) they have resulted from work for the HTA programme or, originally commissioned by the Medical Research Council (MRC) and now managed by the Efficacy and Mechanism Evaluation programme which is funded by the MRC and NIHR, and (2) they are of a sufficiently high scientific quality as assessed by the reviewers and editors.
Reviews inHealth Technology Assessmentare termed 'systematic' when the account of the search appraisal and synthesis methods (to minimise biases and random errors) would, in theory, permit the replication of the review by others.
HTA programme
The HTA programme, part of the National Institute for Health Research (NIHR), was set up in 1993. It produces high-quality research information on the effectiveness, costs and broader impact of health technologies for those who use, manage and provide care in the NHS.
‘Health technologies’are broadly defined as all interventions used to promote health, prevent and treat disease, and improve rehabilitation and long-term care.
The journal is indexed in NHS Evidence via its abstracts included in MEDLINE and its Technology Assessment Reports inform National Institute for Health and Care Excellence (NICE) guidance. HTA research is also an important source of evidence for National Screening Committee (NSC) policy decisions.
For more information about the HTA programme please visit the website: http://www.nets.nihr.ac.uk/programmes/hta
This report
This issue ofHealth Technology Assessmentcontains a project originally commissioned by the MRC but managed by the Efficacy and Mechanism Evaluation Programme. The EME programme was created as part of the National Institute for Health Research (NIHR) and the Medical Research Council (MRC) coordinated strategy for clinical trials. The EME programme is funded by the MRC and NIHR, with contributions from the CSO in Scotland and NISCHR in Wales and the HSC R&D, Public Health Agency in Northern Ireland. It is managed by the NIHR Evaluation, Trials and Studies Coordinating Centre (NETSCC) based at the University of Southampton.
The authors have been wholly responsible for all data collection, analysis and interpretation, and for writing up their work. The HTA editors and publisher have tried to ensure the accuracy of the authors’report and would like to thank the reviewers for their constructive comments on the draft document. However, they do not accept liability for damages or losses arising from the material published in this report.
This report presents independent research funded by the National Institute for Health Research (NIHR). The views and opinions expressed by authors in this publication are those of the authors and do not necessarily reflect those of the NHS, the NIHR, the MRC, NETSCC, the HTA programme, the EME programme or the Department of Health. If there are verbatim quotations included in this publication the views and opinions expressed by the interviewees are those of the interviewees and do not necessarily reflect those of the authors, those of the NHS, the NIHR, NETSCC, the HTA programme, the EME programme or the Department of Health.
© Queen’s Printer and Controller of HMSO 2015. This work was produced by Ballet al.under the terms of a commissioning contract issued by the Secretary of State for Health. This issue may be freely reproduced for the purposes of private research and study and extracts (or indeed, the full report) may be included in professional journals provided that suitable acknowledgement is made and the reproduction is not associated with any form of advertising. Applications for commercial reproduction should be addressed to: NIHR Journals Library, National Institute for Health Research, Evaluation, Trials and Studies Coordinating Centre, Alpha House, University of Southampton Science Park, Southampton SO16 7NS, UK.
Editor-in-Chief of
Health Technology Assessment
and
NIHR
Journals Library
Professor Tom Walley Director, NIHR Evaluation, Trials and Studies and Director of the HTA Programme, UK
NIHR Journals Library Editors
Professor Ken Stein Chair of HTA Editorial Board and Professor of Public Health, University of Exeter Medical School, UK
Professor Andree Le May Chair of NIHR Journals Library Editorial Group (EME, HS&DR, PGfAR, PHR journals)
Dr Martin Ashton-Key Consultant in Public Health Medicine/Consultant Advisor, NETSCC, UK
Professor Matthias Beck Chair in Public Sector Management and Subject Leader (Management Group), Queen’s University Management School, Queen’s University Belfast, UK
Professor Aileen Clarke Professor of Public Health and Health Services Research, Warwick Medical School, University of Warwick, UK
Dr Tessa Crilly Director, Crystal Blue Consulting Ltd, UK
Dr Peter Davidson Director of NETSCC, HTA, UK
Ms Tara Lamont Scientific Advisor, NETSCC, UK
Professor Elaine McColl Director, Newcastle Clinical Trials Unit, Institute of Health and Society, Newcastle University, UK
Professor William McGuire Professor of Child Health, Hull York Medical School, University of York, UK
Professor Geoffrey Meads Professor of Health Sciences Research, Faculty of Education, University of Winchester, UK
Professor John Powell Consultant Clinical Adviser, National Institute for Health and Care Excellence (NICE), UK
Professor James Raftery Professor of Health Technology Assessment, Wessex Institute, Faculty of Medicine, University of Southampton, UK
Dr Rob Riemsma Reviews Manager, Kleijnen Systematic Reviews Ltd, UK
Professor Helen Roberts Professor of Child Health Research, UCL Institute of Child Health, UK
Professor Helen Snooks Professor of Health Services Research, Institute of Life Science, College of Medicine, Swansea University, UK
Please visit the website for a list of members of the NIHR Journals Library Board: www.journalslibrary.nihr.ac.uk/about/editors
Editorial contact: [email protected]
Abstract
The Cannabinoid Use in Progressive Inflammatory brain
Disease (CUPID) trial: a randomised double-blind
placebo-controlled parallel-group multicentre trial and
economic evaluation of cannabinoids to slow progression
in multiple sclerosis
Susan Ball,
1*Jane Vickery,
2Jeremy Hobart,
2Dave Wright,
1Colin Green,
3James Shearer,
3,4Andrew Nunn,
5Mayam Gomez Cano,
1David MacManus,
6David Miller,
6Shahrukh Mallik
6and John Zajicek
21Centre for Biostatistics, Bioinformatics and Biomarkers, Plymouth University Peninsula Schools of
Medicine and Dentistry, Plymouth, UK
2Peninsula Clinical Trials Unit, Plymouth University Peninsula Schools of Medicine and Dentistry,
Plymouth, UK
3Health Economics Group, University of Exeter Medical School, Exeter, UK
4Centre for the Economics of Mental and Physical Health, Institute of Psychiatry, Psychology and
Neuroscience, King’s College London, London, UK
5Medical Research Council Clinical Trials Unit, London, UK
6University College London’s Institute of Neurology, London, UK
*Corresponding author [email protected]
Background:The Cannabinoid Use in Progressive Inflammatory brain Disease (CUPID) trial aimed to determine whether or not oralΔ9-tetrahydrocannabinol (Δ9-THC) slowed the course of progressive multiple
sclerosis (MS); evaluate safety of cannabinoid administration; and, improve methods for testing treatments in progressive MS.
Objectives:There were three objectives in the CUPID study: (1) to evaluate whether or notΔ9-THC could
slow the course of progressive MS; (2) to assess the long-term safety ofΔ9-THC; and (3) to explore newer
ways of conducting clinical trials in progressive MS.
Design:The CUPID trial was a randomised, double-blind, placebo-controlled, parallel-group, multicentre trial. Patients were randomised in a 2 : 1 ratio toΔ9-THC or placebo. Randomisation was balanced
according to Expanded Disability Status Scale (EDSS) score, study site and disease type. Analyses were by intention to treat, following a pre-specified statistical analysis plan. A cranial magnetic resonance imaging (MRI) substudy, Rasch measurement theory (RMT) analyses and an economic evaluation were undertaken.
Setting:Twenty-seven UK sites.
Participants:Adults aged 18–65 years with primary or secondary progressive MS, 1-year evidence of disease progression and baseline EDSS 4.0–6.5.
Interventions:OralΔ9-THC (maximum 28 mg/day) or matching placebo.
Assessment visits:Three and 6 months, and then 6-monthly up to 36 or 42 months.
© Queen’s Printer and Controller of HMSO 2015. This work was produced by Ballet al.under the terms of a commissioning contract issued by the Secretary of State for Health.
This issue may be freely reproduced for the purposes of private research and study and extracts (or indeed, the full report) may be included in professional journals provided that suitable acknowledgement is made and the reproduction is not associated with any form of advertising. Applications for commercial reproduction should be addressed to: NIHR Journals Library, National Institute for Health Research, Evaluation, Trials and Studies Coordinating Centre, Alpha House, University of Southampton Science Park, Southampton SO16 7NS, UK.
Main outcome measures:Primary outcomes were time to EDSS progression, and change in Multiple Sclerosis Impact Scale-29 version 2 (MSIS-29v2) 20-point physical subscale (MSIS-29phys) score. Various secondary patient- and clinician-reported outcomes and MRI outcomes were assessed. RMT analyses examined performance of MS-specific rating scales as measurement instruments and tested for a symptomatic or disease-modifying treatment effect. Economic evaluation estimated mean incremental costs and quality-adjusted life-years (QALYs).
Results:Effectiveness–recruitment targets were achieved. Of the 498 randomised patients (332 to active and 166 to placebo), 493 (329 active and 164 placebo) were analysed. Primary outcomes: no significant treatment effect; hazard ratio EDSS score progression (active : placebo) 0.92 [95% confidence interval (CI) 0.68 to 1.23]; and estimated between-group difference in MSIS-29phys score (active–placebo)–0.9 points (95% CI–2.0 to 0.2 points). Secondary clinical and MRI outcomes: no significant treatment effects. Safety–at least one serious adverse event: 35% and 28% of active and placebo patients, respectively. RMT analyses–scale evaluation: MSIS-29 version 2, MS Walking Scale-12 version 2 and MS Spasticity Scale-88 were robust measurement instruments. There was no clear symptomatic or disease-modifying treatment effect.Economic evaluation–estimated mean incremental cost to NHS over usual care, over 3 years £27,443.20 per patient. No between-group difference in QALYs.
Conclusions:The CUPID trial failed to demonstrate a significant treatment effect in primary or secondary outcomes. There were no major safety concerns, but unwanted side effects seemed to affect compliance. Participants were more disabled than in previous studies and deteriorated less than expected, possibly reducing our ability to detect treatment effects. RMT analyses supported performance of MS-specific rating scales as measures, enabled group- and individual person-level examination of treatment effects, but did not influence study inferences. The intervention had significant additional costs with no improvement in health outcomes; therefore, it was dominated by usual care and not cost-effective. Future work should focus on determining further factors to predict clinical deterioration, to inform the development of new studies, and modifying treatments in order to minimise side effects and improve study compliance. The absence of disease-modifying treatments in progressive MS warrants further studies of the cannabinoid pathway in potential neuroprotection.
Trial registration:Current Controlled Trials ISRCTN62942668.
Funding:The National Institute for Health Research Health Technology Assessment programme, the Medical Research Council Efficacy and Mechanism Evaluation programme, Multiple Sclerosis Society and Multiple Sclerosis Trust. The report will be published in full inHealth Technology Assessment; Vol. 19, No. 12. See the NIHR Journals Library website for further project information.
ABSTRACT
NIHR Journals Library www.journalslibrary.nihr.ac.uk
Contents
List of tables xiii
List of figures xix
List of abbreviations xxiii
Plain English summary xxv
Scientific summary xxvii
Chapter 1Introduction 1
Structure of this report 1
Background and objectives 1
Multiple sclerosis and cannabinoids 1
Trials in progressive multiple sclerosis 2
Research aims 3
Chapter 2Methods: main study and magnetic resonance imaging substudy 5
Study design 5
Setting 5
Study approvals 5
Training 5
Participant eligibility 6
Inclusion criteria 6
Exclusion criteria 6
Recruitment of participants 7
Study site personnel 7
Screening visit (consent and entry to trial) 7
Study diary 8
Randomisation and masking 8
Trial interventions 8
Outcome assessments 9
Participant-completed questionnaires 9
Baseline visit (provision of trial medication) 9
Subsequent participant follow-up 10
Safety monitoring 13
Magnetic resonance imaging substudy 13
Data management and monitoring 13
Trial oversight 13
Sample size and power 14
End Point Committee 14
Statistical methods 14
Pre-specified analyses of primary clinical outcomes 14 Pre-specified analyses of secondary clinical outcomes 15 Analysis of premature discontinuations of trial medication and losses to follow-up 16 Pre-specified analyses of magnetic resonance imaging substudy 16
Further analyses 16
© Queen’s Printer and Controller of HMSO 2015. This work was produced by Ballet al.under the terms of a commissioning contract issued by the Secretary of State for Health.
This issue may be freely reproduced for the purposes of private research and study and extracts (or indeed, the full report) may be included in professional journals provided that suitable acknowledgement is made and the reproduction is not associated with any form of advertising. Applications for commercial reproduction should be addressed to: NIHR Journals Library, National Institute for Health Research, Evaluation, Trials and Studies Coordinating Centre, Alpha House, University of Southampton Science Park, Southampton SO16 7NS, UK.
Ethics and research governance approval 16
Trial registration 16
Role of the funding source 17
Summary of changes to the study protocol 17
Chapter 3Results: main study and magnetic resonance imaging substudy 19
Unblinding of randomised treatments 19
Telephone-based assessment of Expanded Disability Status Scale score 19
Baseline comparability of randomised groups 21
Prescribed dose of trial medication 24
Random urine testing to determine any illicit cannabis use 28
Pre-specified analyses of primary clinical outcomes 32
Primary analysis of time to first confirmed Expanded Disability Status Scale
score progression 32
Sensitivity analyses of time to first confirmed Expanded Disability Status Scale
score progression 34
Pre-specified subgroup analyses of time to first confirmed Expanded Disability Status
Scale score progression 39
Primary analysis of change in Multiple Sclerosis Impact Scale-29 20-point physical subscale 39
Pre-specified analyses of secondary outcomes 39
Multiple Sclerosis Walking Scale-12 39
Multiple Sclerosis Functional Composite 42
Rivermead Mobility Index 44
Short Form questionnaire-36 items (physical health subscale) 44
Multiple Sclerosis Spasticity Scale-88 45
Investigation of adverse events and serious adverse events 50
Category rating scales 51
Analysis of premature discontinuations of trial medication and losses to follow-up 53
Pre-specified analyses of magnetic resonance imaging substudy 56
Chapter 4Post-hoc exploratory analyses: main study and magnetic resonance
imaging substudy 61
Introduction 61
Methods 61
Subgroup analyses 61
On-treatment analyses 61
Expanded Disability Status Scale score transitions and recurrent progression events 62
Results 62
Subgroup analyses 62
On-treatment analyses 64
Expanded Disability Status Scale score transitions and recurrent progression events 66
Conclusions 73
Chapter 5Rasch measurement theory analysis of multiple sclerosis rating scale data 75
Introduction 75
Section 1: rating scales, rating scale data analysis and the added value of Rasch
measurement theory 76
Section 2: within-study measurement performance of the Multiple Sclerosis Impact Scale-29, Multiple Sclerosis Walking Scale-12 and Multiple Sclerosis Spasticity Scale-88
using Rasch measurement theory 79
Background 79
Methods 79
Results 82
CONTENTS
NIHR Journals Library www.journalslibrary.nihr.ac.uk
Section 3: evaluation of treatment effect per protocol 88
Methods 88
Results 89
Summary 103
Section 4: exploratory evaluation of treatment effect by baseline disability level 103
Methods 104
Results 104
Summary 110
Section 5: reflections and lessons learned from Rasch measurement theory analysis of
Cannabinoid Use in Progressive Inflammatory brain Disease data 110
Chapter 6Economic evaluation 113
Introduction 113
Methods 113
Resource use 113
Unit costs for resource use 114
Outcomes 116
Statistical methods 116
Results 118
Intervention costs (delivery ofΔ9-tetrahydrocannabinol) 118
Health and social care resource use and costs, NHS/personal and social
services perspective 119
NHS-/personal and social services-funded other health-care costs 119 NHS-/personal and social services-funded social care costs 119 NHS-/personal and social services-funded multiple sclerosis-related hospital episodes 119 Total costs by treatment group and follow-up (complete cases and imputed data) 119 Comparison of NHS/personal and social services resource use costs by treatment group 124 Post-hoc subgroup analysis of total NHS costs by treatment group 124 Private-/patient-funded other health and social care resource use 125 Private-/patient-funded other health-care costs 127
Private-/patient-funded social care costs 128
Aggregated resource use costs by treatment group and follow-up (complete cases
and imputed data) 128
Comparison of private/patient resource use costs by treatment group 129 Post-hoc subgroup analysis of total private costs by treatment group 129
Health outcomes: quality-adjusted life-years 130
European Quality of Life-5 Dimensions scores by treatment group and follow-up 130 Comparison of quality-adjusted life-year outcomes between treatment groups 130 Post-hoc subgroup analysis of quality-adjusted life-year outcomes by treatment group 133
Conclusions 135
Chapter 7Discussion 137
Primary outcome measures 137
Secondary outcome measures 137
Further analyses 138
Economic evaluation 138
Rasch analysis 138
Symptomatic evaluation 139
Safety 139
Further work 139
© Queen’s Printer and Controller of HMSO 2015. This work was produced by Ballet al.under the terms of a commissioning contract issued by the Secretary of State for Health.
This issue may be freely reproduced for the purposes of private research and study and extracts (or indeed, the full report) may be included in professional journals provided that suitable acknowledgement is made and the reproduction is not associated with any form of advertising. Applications for commercial reproduction should be addressed to: NIHR Journals Library, National Institute for Health Research, Evaluation, Trials and Studies Coordinating Centre, Alpha House, University of Southampton Science Park, Southampton SO16 7NS, UK.
Chapter 8Conclusions 141
Implications for health care 141
Recommendations for research 141
Acknowledgements 143
References 145
Appendix 1Participating sites and principal investigators 147
Appendix 2NHS research and development approval dates 149
Appendix 3Study recruitment May 2006–July 2008 by site 151
Appendix 4Participant information sheet 155
Appendix 5Cannabinoid Use in Progressive Inflammatory brain Disease
trial organisation 163
Appendix 6Patient and public involvement in the Cannabinoid Use in
Progressive Inflammatory brain Disease study 165
Appendix 7End Point Committee terms of reference 167
Appendix 8Economic evaluation 169
CONTENTS
NIHR Journals Library www.journalslibrary.nihr.ac.uk
List of tables
TABLE 1 Number of capsules prescribed according to weight of participants
at baseline 10
TABLE 2 The CUPID study visit and questionnaire completion schedule 11
TABLE 3 Analysis set and study completion (all randomised patients) 20
TABLE 4 Baseline characteristics of patients by treatment group and overall 21
TABLE 5 Outcome variables at baseline for patients randomised to the two
treatment groups 22
TABLE 6 Prescribed daily dose of trial medication at each 6-monthly follow-up,
by treatment group, among non-withdrawals and overall 24
TABLE 7 Frequency and relative frequency (%) of patients in each treatment
group with a urine sample tested positive or negative for cannabinoid presence 29
TABLE 8 Summary of main results 30
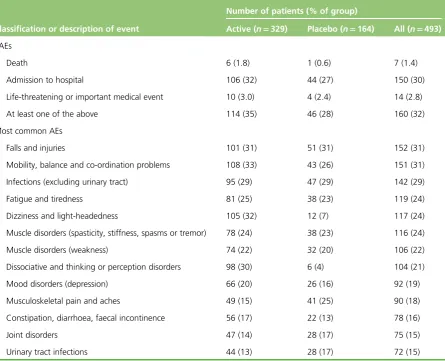
TABLE 9 Occurrences of SAEs and the most common AEs 50
TABLE 10 Frequencies and relative frequencies (%) of responses to category
rating scale questions 9–16, by treatment group, at 3 months after baseline 51
TABLE 11 Frequencies and relative frequencies (%) of responses to category
rating scale questions 9–16, by treatment group, at 1 year after baseline 51
TABLE 12 Frequencies and relative frequencies (%) of responses to category
rating scale questions 9–16, by treatment group, at 2 years after baseline 52
TABLE 13 Frequencies and relative frequencies (%) of responses to category
rating scale questions 9–16, by treatment group, at 3 years after baseline 52
TABLE 14 Frequencies and relative frequencies (%) of reasons for discontinuation of trial medication or loss to follow-up, by treatment group, disease type,
baseline EDSS, sex and overall 54
TABLE 15 Frequencies and relative frequencies (%) of reasons for loss to follow-up,
by treatment group, disease type, baseline EDSS, sex and overall 54
TABLE 16 Premature discontinuations of trial medication and losses to follow-up,
by study site 55
TABLE 17 Baseline characteristics of patients in the MRI substudy, by treatment
group and overall 57
© Queen’s Printer and Controller of HMSO 2015. This work was produced by Ballet al.under the terms of a commissioning contract issued by the Secretary of State for Health.
This issue may be freely reproduced for the purposes of private research and study and extracts (or indeed, the full report) may be included in professional journals provided that suitable acknowledgement is made and the reproduction is not associated with any form of advertising. Applications for commercial reproduction should be addressed to: NIHR Journals Library, National Institute for Health Research, Evaluation, Trials and Studies Coordinating Centre, Alpha House, University of Southampton Science Park, Southampton SO16 7NS, UK.
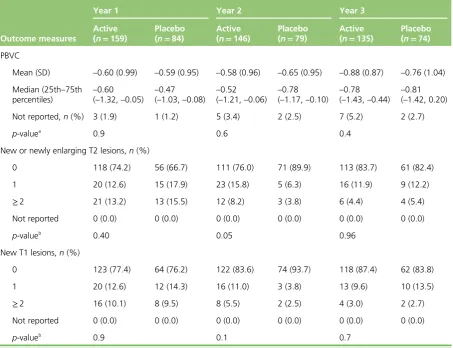
TABLE 18 Descriptive statistics and between-treatment-group comparisons for
MRI outcome measures at years 1, 2 and 3 58
TABLE 19 Summary of results from post-hoc exploratory subgroup and
on-treatment analyses 63
TABLE 20 Frequencies and relative frequencies (%) of patients seen to have specified numbers of unconfirmed, recurrent progression events, by treatment
group, baseline EDSS score and overall 66
TABLE 21 Counts and proportions of transitions between EDSS score groups,
in each 6-monthly follow-up period 71
TABLE 22 Rasch measurement theory evaluation of MS-specific PRO measures 83
TABLE 23 Multiple Sclerosis Impact Scale-29, 20-point physical subscale:
symptomatic effect 90
TABLE 24 Multiple Sclerosis Impact Scale-29, psychological impact subscale:
symptomatic effect 90
TABLE 25 Multiple Sclerosis Walking Scale-12: symptomatic effect 91
TABLE 26 Multiple Sclerosis Spasticity Scale-88, muscle stiffness subscale, q01–12:
symptomatic effect 91
TABLE 27 Multiple Sclerosis Spasticity Scale-88, pain/discomfort subscale, q13–21:
symptomatic effect 92
TABLE 28 Multiple Sclerosis Spasticity Scale-88, muscle spasms subscale, q22–35:
symptomatic effect 92
TABLE 29 Multiple Sclerosis Spasticity Scale-88, ADL subscale, q36–46:
symptomatic effect 93
TABLE 30 Multiple Sclerosis Spasticity Scale-88, walking subscale, q47–56:
symptomatic effect 93
TABLE 31 Multiple Sclerosis Spasticity Scale-88, body movements subscale,
q57–67: symptomatic effect 94
TABLE 32 Multiple Sclerosis Spasticity Scale-88, feelings subscale, q68–80:
symptomatic effect 94
TABLE 33 Multiple Sclerosis Spasticity Scale-88, social function subscale, q81–88:
symptomatic effect 95
TABLE 34 Multiple Sclerosis Impact Scale-29, physical impact subscale:
disease-modifying effect 96
TABLE 35 Multiple Sclerosis Impact Scale-29, psychological impact subscale:
disease-modifying effect 96
LIST OF TABLES
NIHR Journals Library www.journalslibrary.nihr.ac.uk
TABLE 36 Multiple Sclerosis Walking Scale-12: disease-modifying effect 97
TABLE 37 Multiple Sclerosis Spasticity Scale-88, muscle stiffness subscale, q01–12:
disease-modifying effect 97
TABLE 38 Multiple Sclerosis Spasticity Scale-88, pain/discomfort subscale, q13–21:
disease-modifying effect 98
TABLE 39 Multiple Sclerosis Spasticity Scale-88, muscle spasms subscale, q22–35:
disease-modifying effect 98
TABLE 40 Multiple Sclerosis Spasticity Scale-88, ADL subscale, q36–46:
disease-modifying effect 99
TABLE 41 Multiple Sclerosis Spasticity Scale-88, walking subscale, q47–56:
disease-modifying effect 99
TABLE 42 Multiple Sclerosis Spasticity Scale-88, body movements subscale,
q57–67: disease-modifying effect 100
TABLE 43 Multiple Sclerosis Spasticity Scale-88, feelings subscale, q68–80:
disease-modifying effect 100
TABLE 44 Multiple Sclerosis Spasticity Scale-88, social function subscale, q81–88:
disease-modifying effect 101
TABLE 45 Examination of symptomatic treatment effect in baseline EDSS
score-defined subgroups 105
TABLE 46 Examination of disease-modifying treatment effect in baseline
EDSS-defined subgroups 106
TABLE 47 Details of resource use data collected as part of the trial 113
TABLE 48 Unit costs and sources (£, 2010–11) 114
TABLE 49 Summary of missing cost data 117
TABLE 50 Summary of missing EQ-5D data 117
TABLE 51 Intervention resource use and costs (Δ9-THC) 118
TABLE 52 Summary of NHS/PSS costs by treatment group and resource use
category (complete case analysis, costs not discounted) 120
TABLE 53 Total other health and social care costs over trial period (excluding the
cost of the CUPID intervention): regression results (discounted, imputed data) 124
TABLE 54 Comparison of aggregated NHS/PSS mean costs (£) by treatment group
over trial period (discounted imputed data) 124
© Queen’s Printer and Controller of HMSO 2015. This work was produced by Ballet al.under the terms of a commissioning contract issued by the Secretary of State for Health.
This issue may be freely reproduced for the purposes of private research and study and extracts (or indeed, the full report) may be included in professional journals provided that suitable acknowledgement is made and the reproduction is not associated with any form of advertising. Applications for commercial reproduction should be addressed to: NIHR Journals Library, National Institute for Health Research, Evaluation, Trials and Studies Coordinating Centre, Alpha House, University of Southampton Science Park, Southampton SO16 7NS, UK.
TABLE 55 Total costs (including the cost of the CUPID intervention) over trial
period, among the baseline EDSS score of 4.0–5.5 subgroup: regression results
(imputed data, discounted costs) 125
TABLE 56 Comparison of total mean NHS/PSS aggregated costs (£) by treatment
group over trial period for the baseline EDSS score of 4.0–5.5 subgroup
(discounted imputed data) 125
TABLE 57 Summary of private/patient costs (£) by treatment group and resource
use category (complete case analysis, costs not discounted) 126
TABLE 58 Total costs at month 33: regression results (imputed data,
discounted costs) 129
TABLE 59 Total costs over trial period, among baseline EDSS score of 4.0–5.5
subgroup: regression results (imputed data, discounted costs) 129
TABLE 60 Total QALYs at month 36: regression results (discounted,
imputed data) 132
TABLE 61 Quality-adjusted life-years by treatment group and year (imputed,
discounted QALYs) 133
TABLE 62 Total QALYs at month 36: regression results (discounted, imputed
subgroup analysis) 133
TABLE 63 Quality-adjusted life-years by treatment group and year (discounted,
imputed subgroup analysis) 133
TABLE 64 The CUPID study sites and PIs 147
TABLE 65 The CUPID study sites and dates of R&D approval 149
TABLE 66 CUPID study sites and monthly and total numbers of participants
recruited, between May 2006 and July 2008 152
TABLE 67 NHS/PSS resource use in natural units by treatment group and follow-up
(complete case analysis) 169
TABLE 68 NHS/PSS resource use costs by treatment group and follow-up
(complete case analysis, costs not discounted) 174
TABLE 69 Aggregated other NHS/PSS resource use costs by treatment group and
follow-up (discounted costs, complete cases) 179
TABLE 70 Aggregated other NHS/PSS resource use costs by treatment group and
follow-up (discounted costs, imputed data) 179
TABLE 71 Private resource use in natural units by treatment group and follow-up
(complete case analysis) 180
LIST OF TABLES
NIHR Journals Library www.journalslibrary.nihr.ac.uk
TABLE 72 Private resource use costs by treatment group and follow-up
(complete case analysis, undiscounted) 182
TABLE 73 Aggregated private resource use costs by treatment group and
follow-up (discounted, complete cases) 185
TABLE 74 Concomitant medication costs by drug and drug class 186
© Queen’s Printer and Controller of HMSO 2015. This work was produced by Ballet al.under the terms of a commissioning contract issued by the Secretary of State for Health.
This issue may be freely reproduced for the purposes of private research and study and extracts (or indeed, the full report) may be included in professional journals provided that suitable acknowledgement is made and the reproduction is not associated with any form of advertising. Applications for commercial reproduction should be addressed to: NIHR Journals Library, National Institute for Health Research, Evaluation, Trials and Studies Coordinating Centre, Alpha House, University of Southampton Science Park, Southampton SO16 7NS, UK.
List of figures
FIGURE 1 The Consolidated Standards of Reporting Trials (CONSORT) flow diagram 20
FIGURE 2 Percentiles of prescribed daily dose of trial medication among
non-withdrawals at each visit, by treatment group and weight group 26
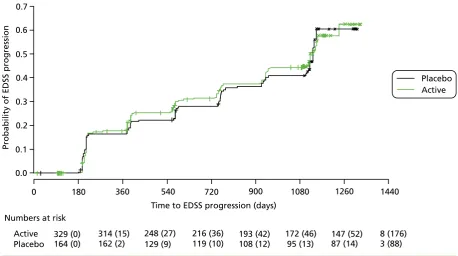
FIGURE 3 Kaplan–Meier estimates of the probability of progression on the EDSS
in the two treatment groups, confirmed after 6 months within the study period 32
FIGURE 4 Estimated HRs and 95% CIs for EDSS score progression from a Cox
regression model 33
FIGURE 5 Kaplan–Meier estimates of the probability of progression on the EDSS,
by baseline EDSS score, confirmed after 6 months within the study period 34
FIGURE 6 Estimated HRs (active : placebo) for EDSS score progression, with
95% CIs andp-values from Cox regression models, sequentially removing study
sites with high loss to follow-up for each of the two data sets and each of the
two ways of dealing with losses to follow-up 35
FIGURE 7 Estimated HRs (active : placebo) and 95% CIs for EDSS score
progression by subgroup 40
FIGURE 8 Estimated mean MSIS-29phys score, with 95% CIs, at each visit,
separated by treatment group 41
FIGURE 9 Estimated mean MSWS-12v2, with 95% CIs, at each visit, separated by
treatment group 41
FIGURE 10 Estimated mean MSFC composite (a), T25-FW (b), 9-HPT (c) and PASAT
(d)z-scores, with 95% CIs, at each visit, separated by treatment group 42
FIGURE 11 Estimated mean RMI, with 95% CIs, at each visit, separated by
treatment group 44
FIGURE 12 Estimated mean SF-36(PH), with 95% CIs, at each visit, separated by
treatment group 45
FIGURE 13 Estimated mean MSSS-88 subscales 1–8 scores, with 95% CIs, at each
visit, separated by treatment group 46
FIGURE 14 Estimated mean MSSS-88 (1) total score from subscales 1–3,
concerning muscle stiffness/spasms, pain and discomfort; MSSS-88 (2) total score
from subscales 4–6, concerning activity, walking and body movements; and
MSSS-88 (3) total score from subscales 7 and 8, concerning feelings and social
functioning, with 95% CIs, at each visit, separated by treatment group 49
FIGURE 15 Kaplan–Meier estimates of the probability of discontinuation of trial
medication in the two treatment groups 53
© Queen’s Printer and Controller of HMSO 2015. This work was produced by Ballet al.under the terms of a commissioning contract issued by the Secretary of State for Health.
This issue may be freely reproduced for the purposes of private research and study and extracts (or indeed, the full report) may be included in professional journals provided that suitable acknowledgement is made and the reproduction is not associated with any form of advertising. Applications for commercial reproduction should be addressed to: NIHR Journals Library, National Institute for Health Research, Evaluation, Trials and Studies Coordinating Centre, Alpha House, University of Southampton Science Park, Southampton SO16 7NS, UK.
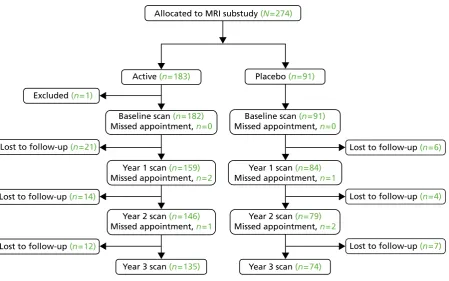
FIGURE 16 Flow of participants through the MRI substudy 57
FIGURE 17 Estimated mean cumulative PBVC (%), and 95% CI, by treatment
group, measured at yearly MRI visits 59
FIGURE 18 Kaplan–Meier estimates of the probability of progression on the EDSS in the two treatment groups, confirmed after 6 months within the study period,
among the subgroup of patients with a baseline EDSS score of 4.0–5.5 64
FIGURE 19 Kaplan–Meier estimates of the probability of progression on the EDSS in the two treatment groups, confirmed after 6 months within the study period, based on an on-treatment data set, in which withdrawals from trial treatment
are considered as losses to follow-up at the time of withdrawal 65
FIGURE 20 Estimated mean cumulative PBVC (%), and 95% CI, by treatment
group, measured at yearly MRI visits, in the on-treatment data 65
FIGURE 21 Estimated probabilities of EDSS score progression (unconfirmed),
with 95% CI, by starting EDSS score, in each 6-monthly interval from baseline 67
FIGURE 22 Estimated probabilities of EDSS score progression (unconfirmed),
with 95% CI, by starting EDSS score, in all 6-monthly intervals from baseline 70
FIGURE 23 Estimated probabilities of unconfirmed EDSS score progression,
with 95% CI, in each 6-monthly interval from baseline and overall 72
FIGURE 24 Person-item threshold distribution for MSIS-29phys (grouping set to
interval length of 0.20 making 60 groups) 86
FIGURE 25 Person-item threshold distribution for MSWS-12v2 (grouping set to
interval length of 0.20 making 60 groups) 87
FIGURE 26 Standardised response means for the two MSIS-29v2 subscales,
by treatment group 102
FIGURE 27 Individual-person change for the MSIS-29phys, by treatment group 103
FIGURE 28 Standardised response means for the MSIS-29phys, by treatment
group and baseline EDSS score subgroup 107
FIGURE 29 Standardised response means for the MSWS-12v2, by treatment
group and baseline EDSS score subgroup 107
FIGURE 30 Individual-person change for the MSIS-29v2phys, in each treatment
group, by disability subgroup 108
FIGURE 31 Individual-person change for the MSWS-12v2, in each treatment
group, by disability subgroup 109
FIGURE 32 Roadmap to patient-focused outcome measurement in clinical trials 111
FIGURE 33 Qualification of COAs 112
LIST OF FIGURES
NIHR Journals Library www.journalslibrary.nihr.ac.uk
FIGURE 34 Proportion (%) of costs attributable to each type of NHS-/PSS-funded
primary or acute care service provider in each treatment group 121
FIGURE 35 Proportion (%) of costs attributable to each type of NHS-/PSS-funded
social care provider in each treatment group 122
FIGURE 36 Proportion (%) of costs attributable to each type of MS-related
hospital episode in each treatment group 123
FIGURE 37 Proportion (%) of costs attributable to each type of private-/
patient-funded primary or acute care service provider in each treatment group 127
FIGURE 38 Proportion (%) of costs attributable to each type of private-/
patient-funded social care provider in each treatment group 128
FIGURE 39 Percentages of the different responses to each of the five dimensions
of the EQ-5D, at each follow-up, separated by treatment group (complete cases) 131
FIGURE 40 Mean EQ-5D scores, with 95% CIs, by treatment group and follow-up 132
FIGURE 41 European Quality of Life-5 Dimensions weighted index score by
follow-up and EDSS subgroup 134
© Queen’s Printer and Controller of HMSO 2015. This work was produced by Ballet al.under the terms of a commissioning contract issued by the Secretary of State for Health.
This issue may be freely reproduced for the purposes of private research and study and extracts (or indeed, the full report) may be included in professional journals provided that suitable acknowledgement is made and the reproduction is not associated with any form of advertising. Applications for commercial reproduction should be addressed to: NIHR Journals Library, National Institute for Health Research, Evaluation, Trials and Studies Coordinating Centre, Alpha House, University of Southampton Science Park, Southampton SO16 7NS, UK.
List of abbreviations
Δ9-THC Δ9-tetrahydrocannabinol
9-HPT 9-hole peg test
ADL activities of daily living
AE adverse event
ANOVA analysis of variance
BDI-II Beck Depression Inventory-II
CAMS Cannabinoids in Multiple Sclerosis
CI confidence interval
COA clinical outcome assessment
CRF case report form
CTT classical test theory
CUPID Cannabinoid Use in Progressive Inflammatory brain Disease
DIF differential item functioning
EDSS Expanded Disability Status Scale
EPC End Point Committee
EQ-5D European Quality of Life-5 Dimensions
FDA Food and Drug Administration
GCP Good Clinical Practice
GLM generalised linear model
GP general practitioner
HR hazard ratio
HRQoL health-related quality of life
ICC item characteristic curve
ICE imputation using chained equations
IDMC Independent Data Monitoring Committee
ISRCTN International Standard Randomised Controlled Trial Number
ITT intention to treat
MHRA Medicine and Healthcare products Regulatory Agency
MRC Medical Research Council
MRI magnetic resonance imaging
MS multiple sclerosis
MSFC Multiple Sclerosis Functional Composite
MSIS-29phys Multiple Sclerosis Impact Scale-29 version 2 20-point physical subscale
MSIS-29v2 Multiple Sclerosis Impact Scale-29 version 2
MSSS-88 Multiple Sclerosis Spasticity Scale-88
MSWS-12v2 Multiple Sclerosis Walking Scale-12 version 2
NBV normalised brain volume
NICE National Institute For Health and Care Excellence
OR odds ratio
PASAT Paced Auditory Serial Addition Test
PBVC percentage brain volume change
PH proportional hazard
PI principal investigator
PPMS primary progressive multiple sclerosis
PRO patient-reported outcome
PSI person separation index
PSS Personal and Social Services
PSSRU Personal and Social Services Research Unit
QALY quality-adjusted life-year
© Queen’s Printer and Controller of HMSO 2015. This work was produced by Ballet al.under the terms of a commissioning contract issued by the Secretary of State for Health.
This issue may be freely reproduced for the purposes of private research and study and extracts (or indeed, the full report) may be included in professional journals provided that suitable acknowledgement is made and the reproduction is not associated with any form of advertising. Applications for commercial reproduction should be addressed to: NIHR Journals Library, National Institute for Health Research, Evaluation, Trials and Studies Coordinating Centre, Alpha House, University of Southampton Science Park, Southampton SO16 7NS, UK.
R&D research and development
RCT randomised controlled trial
REC research ethics committee
RMI Rivermead Mobility Index
RMT Rasch measurement theory
RRMS relapsing–remitting multiple sclerosis
SAE serious adverse event
SAP statistical analysis plan
SD standard deviation
SE standard error
SF-36v2 Short Form questionnaire-36 items version 2
SF-36(PH) Short Form questionnaire-36 items version 2 (physical health subscale)
SPMS secondary progressive multiple sclerosis
SRM standardised response mean
SUSAR suspected unexpected serious adverse reaction
T25-FW timed 25-foot walk
THC tetrahydrocannabinol
TSC Trial Steering Committee
LIST OF ABBREVIATIONS
NIHR Journals Library www.journalslibrary.nihr.ac.uk
Plain English summary
T
he Cannabinoid Use in Progressive Inflammatory brain Disease study investigated the effectiveness and safety of the cannabinoid tetrahydrocannabinol (THC) in slowing progressive multiple sclerosis (MS) over 3 years.Four hundred and ninety-three people with primary or secondary progressive MS were recruited to the study from 27 UK sites between May 2006 and July 2008. A requirement of study entry was that walking was affected by MS but that participants could still walk, with aids if necessary. Participants were randomly assigned to receive oral THC (329 people) or placebo (164 people) capsules in a‘double-blind’manner so that neither participants nor research staff were aware of treatment allocations. Dose was titrated on an individual basis according to body weight and side effects, before being gradually reduced to zero after 3 years.
The two primary measures of treatment effectiveness were scores on the Expanded Disability Status Scale (EDSS) and MS Impact Scale-29 version 2 (MSIS-29v2). The EDSS was assessed 6-monthly, with progression confirmed if sustained at two consecutive visits. Secondary measures included MS Functional Composite and various self-completion questionnaires. Participants at 13 sites underwent yearly magnetic resonance imaging brain scans.
The study found no evidence that THC has an effect on MS progression. EDSS and MSIS-29v2 scores showed little change over the study period and no difference was found between the THC and placebo groups. There was some evidence that THC might have a beneficial effect in participants at the lower end of the disability scale, but numbers were small and further studies will be needed. The study raised no major issues regarding safety of THC.
© Queen’s Printer and Controller of HMSO 2015. This work was produced by Ballet al.under the terms of a commissioning contract issued by the Secretary of State for Health.
This issue may be freely reproduced for the purposes of private research and study and extracts (or indeed, the full report) may be included in professional journals provided that suitable acknowledgement is made and the reproduction is not associated with any form of advertising. Applications for commercial reproduction should be addressed to: NIHR Journals Library, National Institute for Health Research, Evaluation, Trials and Studies Coordinating Centre, Alpha House, University of Southampton Science Park, Southampton SO16 7NS, UK.
Scientific summary
Background
Multiple sclerosis (MS) is the commonest cause of neurological disability in young adults. It is generally regarded as an autoimmune disease, with early episodes of inflammation associated with axonal damage, which becomes the major pathological process as the disease progresses. Initial clinical relapses are often replaced by secondary gradual progression after several years. Although therapies for the inflammatory phase are available, none has been shown to slow disease progression in the absence of relapses.
Cannabinoids are used to ameliorate MS-related symptoms, particularly muscle spasticity and pain. Our previous large multicentre Cannabinoids in MS (CAMS) trial focused on testing symptomatic benefits of cannabinoids for 15 weeks in 630 participants (95% with progressive disease). A treatment effect on spasticity (assessed by the Ashworth scale) was not evident, although more participants reported benefits from symptom alleviation in the active group than in the placebo group. Experimental evidence emerged to suggest that cannabinoids have neuroprotective effects and might encourage remyelination. A follow-up study, in which participants, masked to treatment, could continue study medication for up to 12 months, reported significant effects of dronabinol [Δ9-tetrahydrocannabinol (Δ9-THC)] on spasticity, with some
evidence of an effect on disability, measured by the Expanded Disability Status Scale (EDSS) and Rivermead Mobility Index (RMI). This provided clinical evidence to support experimental data suggesting that
cannabinoids might have a neuroprotective effect in progressive MS and confirmed that dronabinol continued to ameliorate patients’symptoms for up to 12 months. The Cannabinoid Use in Progressive Inflammatory brain Disease (CUPID) trial aimed to test the hypothesis that oral dronabinol slows progression of primary progressive MS (PPMS) and secondary progressive MS (SPMS) over 3 years.
Aims
In patients with PPMS and SPMS, three primary aims were investigated over 3 years. These were to:
l assess the value ofΔ9-THC in slowing disease progression l assess the safety ofΔ9-THC
l use the information gained to improve methodology for conducting clinical trials in progressive MS.
Methods
Design
The CUPID trial was a randomised, double-blind, placebo-controlled, multicentre, parallel-group study in adults with PPMS and SPMS, designed to assess the efficacy and safety ofΔ9-THC in slowing disease
progression over 3 years.
Setting and participants
Participants were recruited from 27 UK neurology or rehabilitation departments. Eligible patients were aged 18–65 years, with a diagnosis of PPMS or SPMS, evidence of disease progression in the preceding year, EDSS score 4.0–6.5 and willingness to abstain from other cannabis use during the trial. Main exclusion criteria were:
l immunosuppressive or immunomodulatory therapy in previous 12 months
l corticosteroids in previous 3 months
© Queen’s Printer and Controller of HMSO 2015. This work was produced by Ballet al.under the terms of a commissioning contract issued by the Secretary of State for Health.
This issue may be freely reproduced for the purposes of private research and study and extracts (or indeed, the full report) may be included in professional journals provided that suitable acknowledgement is made and the reproduction is not associated with any form of advertising. Applications for commercial reproduction should be addressed to: NIHR Journals Library, National Institute for Health Research, Evaluation, Trials and Studies Coordinating Centre, Alpha House, University of Southampton Science Park, Southampton SO16 7NS, UK.
l significant MS relapse in previous 6 months
l serious illness or medical condition likely to interfere with study assessment
l previous history of psychotic illness
l sesame seed allergy
l pregnancy
l cannabinoids (including nabilone) taken in previous 4 weeks.
Randomisation
Consenting patients were randomly assigned in a 2 : 1 ratio to oralΔ9-THC or placebo. Randomisation
was balanced according to EDSS score, study site and disease type, by stochastic minimisation, using a computer-generated randomisation sequence. Participants and study staff were blinded to treatment allocation.
Interventions
OralΔ9-THC (maximum dose 28 mg/day, titrated against body weight and adverse effects) or matching
placebo (vegetable oil capsules).
Outcome measures
Primary clinical outcomes were time to confirmed EDSS score progression (physician based) and change in Multiple Sclerosis Impact Scale-29 version 2 20-point physical subscale (MSIS-29phys) score (patient based).
Secondary outcomes included: number and nature of adverse events (AEs); MS Walking Scale-12 version 2 (MSWS-12v2) score; MS Functional Composite (MSFC) score; RMI score; Short Form questionnaire-36 items version 2 (SF-36v2) score; European Quality of Life-5 Dimensions (EQ-5D) questionnaire score; MS Spasticity Scale-88 (MSSS-88) score and category rating scale. Additionally, in the magnetic resonance imaging (MRI) substudy, outcomes included brain atrophy [in terms of annual percentage brain volume change (PBVC)] and occurrence of new T1 hypointense and new or newly enlarging T2 hyperintense lesions from annual cranial MRI.
Expanded Disability Status Scale was assessed by the physician at follow-ups scheduled at 3 and 6 months, then 6-monthly up to 36 months, unless EDSS score progression was seen at this time, in which case a further visit was scheduled at 42 months. RMI was also assessed at these visits. MSFC (timed 25-foot walk; 9-hole peg test; paced auditory serial addition test) were assessed at 2 weeks (treated as baseline) and at 12, 24 and 36 or 42 months. Data on MSIS-29phys, MSWS-12v2, SF-36v2 and EQ-5D were collected from postal questionnaires at baseline, 3 and 6 months, and then 6-monthly up to 36 or 42 months. Questionnaires also included MSSS-88 and category rating scales at 12, 24 and 36 or 42 months.
Sample size and power
Previous data suggested a progression rate of approximately 70% in the placebo group. Based on this and an expected 5% annual loss to follow-up rate, recruiting 492 patients provided 90% power to detect a one-third reduction in hazard of progression [i.e. hazard ratio (HR) 0.67], corresponding to a relative reduction in risk of progression over 3 years of 21% (from 70% to 55% progression in theΔ9-THC group).
For the MRI substudy, allowing for a 5% annual loss to follow-up rate, it was estimated that 261 patients allocated to active treatment and placebo in a 2 : 1 ratio gave 90% power to detect 40% slowing in atrophy rate, with scans performed pre treatment and at years 1, 2 and 3.
Analysis
Analysis of time to EDSS score progression used Cox proportional hazards models. Analysis of repeated measures of MSIS-29phys score, secondary clinical outcomes and PBVC used multilevel models, with individual differences incorporated using random coefficients. Logistic regression models were used to analyse data on new or newly enlarging T2 and T1 lesions. In all models, between-group differences were estimated, adjusted for baseline patient and disease characteristics. Analysis, using statistical software R version 2.14.2 (The R Foundation for Statistical Computing, Vienna, Austria), was by intention to treat.
SCIENTIFIC SUMMARY
NIHR Journals Library www.journalslibrary.nihr.ac.uk
Investigation of adverse and serious adverse events
At each follow-up, participants were asked a question to elicit information about new or previously reported AEs. Events which satisfied criteria for seriousness (according to standard reporting procedures for clinical trials of investigational medicinal products) were reported by system organ class to an Independent Data Monitoring Committee for scrutiny. Serious AEs (SAEs) categorised as suspected unexpected serious adverse reactions were subject to expedited reporting to the sponsor, unblinded independently of the trials team and reported to the Medicines and Healthcare products Regulatory Agency as required. Identification and verification of AEs was substantiated by inspection of clinical case notes during site monitoring visits.
Rasch measurement theory
Data from MSIS-29v2, MSWS-12v2 and MSSS-88 were examined using Rasch measurement theory (RMT) methods. RMT derives, from ordered rating scale scores, linear estimates of constructs they measure, which are more scientifically sound values to analyse and are associated with individual person standard errors. First, performance of the scales as measurement instruments was examined. Second, data were examined for evidence of symptomatic changes (differences between measurements at baseline and end of dose titration period) and disease-modifying changes (differences between measurements at baseline and last visit), at group and individual person levels. Analyses included patients who remained on trial medication. At the group level, statistical and clinical significance was assessed using pairedt-tests and two effect sizes (Cohen’s and standardised response means), respectively. At the individual person level, significance of each person change score was computed, identifying them as significantly or non-significantly better, unchanged, non-significantly or significantly worse.
Economic evaluation
In an economic evaluation, the primary analysis was based on a between-group comparison of costs and quality-adjusted life-years (QALYs) (calculated using EQ-5D scores) over 3 years, from the UK NHS and Personal Services perspective. Secondary analyses considered costs from the patient perspective. Costs and QALYs were discounted after the first year at the 3.5% UK treasury rate. Missing data were imputed using multiple imputation using chained equations. Regression methods were used to estimate between-group differences in costs and QALYs adjusting for baseline values and pre-specified covariates.
Results
Of the 558 patients assessed for eligibility, 45 (8%) failed to meet the inclusion criteria. Of the 513 eligible patients, 10 (2%) declined to participate and five (1%) were excluded due to uncontrolled hypertension (n=2) and not attending screening appointment (n=3). Of the remaining 498 patients, 332 were allocated to active treatment and 166 to placebo, of whom 329 and 164 patients, respectively, were analysed. There were no important between-group differences in baseline patient and disease
characteristics. Primary analysis showed little evidence of treatment effect on time to confirmed EDSS score progression. The HR (active : placebo) was 0.92 [95% confidence interval (CI) 0.68 to 1.23]. Conclusions from this analysis were robust to sensitivity analyses. Pre-specified subgroup analyses of time to EDSS score progression indicated a differential effect of treatment between participants with lower and higher
baseline EDSS scores. The estimated HR (active : placebo) for the subgroup with baseline EDSS score of 4.0–5.5 was below 1; those with an EDSS score of 6.0 and 6.5 were above 1.
A multilevel model fitted to repeated measures of MSIS-29phys score showed little evidence of a treatment effect, i.e. the estimated between-group difference in MSIS-29phys score (dronabinol–placebo) was –0.9 (95% CI–2.0 to 0.2;p=0.11). Multilevel models showed little evidence of an effect of treatment on MSFCz-score [estimated between-group difference (dronabinol–placebo)–0.03 (95% CI–0.19 to 0.09; p=0.72)]; MSWS-12v2 [estimated between-group difference (dronabinol–placebo)–0.19 (95% CI–0.97 to 0.60;p=0.74)]; RMI [estimated between-group difference (dronabinol–placebo) 0.04 (95% CI–0.24 to 0.32;p=076)]; or on any other clinical outcome.
© Queen’s Printer and Controller of HMSO 2015. This work was produced by Ballet al.under the terms of a commissioning contract issued by the Secretary of State for Health.
This issue may be freely reproduced for the purposes of private research and study and extracts (or indeed, the full report) may be included in professional journals provided that suitable acknowledgement is made and the reproduction is not associated with any form of advertising. Applications for commercial reproduction should be addressed to: NIHR Journals Library, National Institute for Health Research, Evaluation, Trials and Studies Coordinating Centre, Alpha House, University of Southampton Science Park, Southampton SO16 7NS, UK.
There was no significant treatment effect on brain atrophy; estimated between-group difference in PBVC (dronabinol–placebo)–0.01% (95% CI–0.26% to 0.24%;p=0.94). There was an effect of time on atrophy (p<0.0001); on average, cumulative PBVC was estimated to be–0.58%,–1.20% and–2.02% at years 1, 2 and 3, respectively.
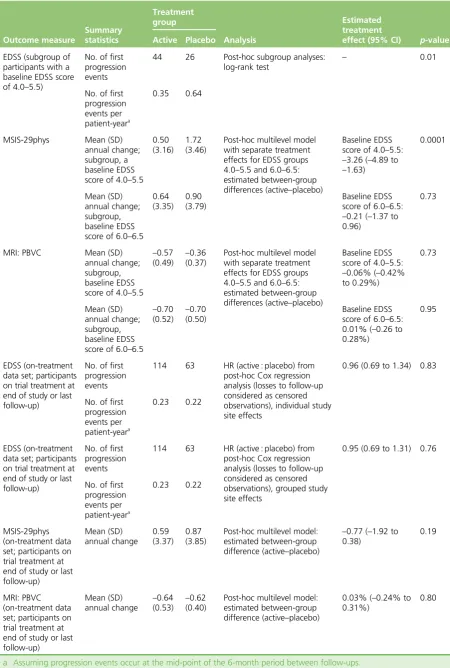
The suggestion of a treatment effect from subgroup analysis of time to EDSS score progression [HR (active : placebo) 0.52, 95% CI 0.32 to 0.85; baseline EDSS score 4.0–5.5], led to post-hoc analysis of progression among patients in this EDSS group, which suggested a potentially beneficial effect of active treatment compared with placebo (p=0.01, log-rank test). One hundred and fourteen (35%) patients in the active group and 46 (28%) in the placebo group experienced at least one SAE, the most common being hospital admission for MS-related events and infections. The number and nature of SAEs was similar across treatment groups. There were numerous non-serious AEs in both groups, consistent with effects of MS and the known safety profile of cannabinoids. The median number of events per participant was 11 (25th–75th percentiles 7–17) and 10 (25th–75th percentiles 6–14) in the active and placebo group, respectively. Loss to follow-up rate was as predicted; however, unwanted side effects contributed to a relatively high rate of discontinuation from trial medication in the active group. Among patients remaining on trial medication (n=178 active;n=118 placebo), median prescribed daily dose during the final year of follow-up was four capsules (25th–75th percentiles 2–6 capsules) and six capsules (25th–75th percentiles 4–8 capsules) in the active and placebo group, respectively.
Rasch measurement theory analysis showed that MS-specific scales performed well as measurement instruments. Targeting was good enough to enable robust evaluation of scale performance and individual person-level (and group-level) analysis of linear estimates. All subscales of MSIS-29v2, MSWS-12v2 and MSSS-88 had response categories that worked as intended, items that mapped out continua on which to measure people, items that were statistically cohesive, minimal or no item bias or instability. However, targeting plots for some physical function scales (e.g. MSWS-12v2) were skewed, questioning whether or not some scales underestimate changes and differences occurring in the study. Group-level analyses of RMT-derived linear estimates implied dronabinol was not associated with symptomatic or
disease-modifying benefit. There was no evidence that dronabinol improved psychosocial functioning. Post-hoc disability-defined subgroup analyses showed no clear symptomatic or disease-modifying treatment effect. There were hints of a potential disease-modifying effect with reduced progression measured by the MSIS-29phys and MSWS-12v2; between-group effect size differences for these two scales/subscales were clinically moderate to large. These were not supported by benefit on related MSSS-88 subscales.
Estimated mean incremental cost to the NHS forΔ9-THC over and above usual care over 3 years was
£27,443.20 per treated patient, with no between-group difference in QALYs. Post-hoc subgroup analyses of patients with baseline EDSS 4.0–5.5 indicated incremental costs at £30,130 and estimated incremental QALY gain of 0.066, with cost per QALY exceeding £400,000, well above the threshold at which the NHS would consider an intervention cost-effective.
Conclusions
Primary analyses failed to demonstrate evidence of an effect of dronabinol in slowing progression of MS. There were no major safety concerns, although compliance was almost certainly affected by minor side effects leading to less treatment adherence in the active group. There was some evidence of a potentially beneficial effect of dronabinol in participants with baseline EDSS 4.0–5.5, although this comprised only 20% of recruited participants. Conversely, there was evidence of potential active treatment-related deterioration in more disabled participants.
SCIENTIFIC SUMMARY
NIHR Journals Library www.journalslibrary.nihr.ac.uk
As dronabinol was not shown to be effective, a full cost-effectiveness analysis was not performed. Analysis of costs and QALYs indicated that introduction ofΔ9-THC, in addition to usual care, had
significant additional costs associated with treatment, with no improvement in health outcomes and was therefore dominated by usual care (i.e. was more costly and no more effective) and not
considered cost-effective.
The CUPID trial was not designed to detect symptom benefit, which has been found in several previous studies. However, there was some evidence for potential symptom amelioration when ancillary data on additional medication and side effects were assessed. As a whole, the population recruited to the CUPID trial was more disabled and progressed less over 3 years than other similar studies. This may have reduced the potential for detecting a treatment effect if the opportunity to detect an effect is limited to earlier disease states. Indeed, there was some evidence of a potentially beneficial effect at these lower disability levels. Conversely, the antispastic symptomatic effect (demonstrated in previous studies) may have contributed to any deterioration in those less able to walk, as removing spasticity from weak legs may compromise strength and increase disability. Lack of compliance in the active group may have contributed to the inability to detect a treatment effect. The continuing absence of disease-modifying treatment in progressive MS demands that all opportunities to test potential treatments rigorously are taken. Before cannabinoids are classed in the‘symptom amelioration-only’category of treatments, further studies using better-tolerated treatments in less disabled patients are warranted. Further work is also required to identify the population of MS patients who are most likely to deteriorate and in whom detection of a treatment effect is most likely.
Trial registration
This trial is registered as ISRCTN62942668.
Funding
Funding for this study was provided by the Health Technology Assessment programme of the National Institute for Health Research, the Medical Research Council Efficacy and Mechanism Evaluation programme, the Multiple Sclerosis Society and the Multiple Sclerosis Trust.
© Queen’s Printer and Controller of HMSO 2015. This work was produced by Ballet al.under the terms of a commissioning contract issued by the Secretary of State for Health.
This issue may be freely reproduced for the purposes of private research and study and extracts (or indeed, the full report) may be included in professional journals provided that suitable acknowledgement is made and the reproduction is not associated with any form of advertising. Applications for commercial reproduction should be addressed to: NIHR Journals Library, National Institute for Health Research, Evaluation, Trials and Studies Coordinating Centre, Alpha House, University of Southampton Science Park, Southampton SO16 7NS, UK.