Empirical Analysis of Object-Oriented Design Metrics for
Predicting Unit Testing Effort of Classes
Mourad Badri, Fadel Toure
Software Engineering Research Laboratory, Department of Mathematics and Computer Science, University of Quebec, Trois- Rivières, Canada.
Email: {Mourad.Badri, Fadel.Toure}@uqtr.ca
Received April 16th, 2012; revised May 29th, 2012; accepted June 10th, 2012
ABSTRACT
In this paper, we investigate empirically the relationship between object-oriented design metrics and testability of classes. We address testability from the point of view of unit testing effort. We collected data from three open source Java software systems for which JUnit test cases exist. To capture the testing effort of classes, we used metrics to quan- tify the corresponding JUnit test cases. Classes were classified, according to the required unit testing effort, in two categories: high and low. In order to evaluate the relationship between object-oriented design metrics and unit testing effort of classes, we used logistic regression methods. We used the univariate logistic regression analysis to evaluate the individual effect of each metric on the unit testing effort of classes. The multivariate logistic regression analysis was used to explore the combined effect of the metrics. The performance of the prediction models was evaluated using Re- ceiver Operating Characteristic analysis. The results indicate that: 1) complexity, size, cohesion and (to some extent) coupling were found significant predictors of the unit testing effort of classes and 2) multivariate regression models based on object-oriented design metrics are able to accurately predict the unit testing effort of classes.
Keywords: Software Testability; Unit Testing; Testing Effort; Metrics; Relationship; Prediction and Empirical Analysis
1. Introduction
Software testability is an important software quality at- tribute. IEEE [1] defines testability as the degree to which a system or component facilitates the establish- ment of test criteria and the performance of tests to de- termine whether those criteria have been met. ISO [2] defines testability (characteristic of maintainability) as attributes of software that bear on the effort needed to validate the software product.
Software testability is, in fact, a complex notion. In- deed, software testability is not an intrinsic property of a software artifact and cannot be measured simply such as size, complexity or coupling. According to Baudry et al.
[3,4], software testability is influenced by many factors including controllability, observability and the global test cost. Yeh et al. [5] argue also that diverse factors such as control flow, data flow, complexity and size contribute to testability. Zhao [6] states that testability is an elusive concept, and it is difficult to get a clear view on all the potential factors that can affect it. Dealing with software testability raises several questions such as [7,8]: Why is one class easier to test than another? What makes a class hard to test? What contributes to the testability of a class? How can we quantify this notion? In addition, according
to Baudry et al. testability becomes crucial in the case of object-oriented (OO) software systems where control flows are generally not hierarchical, but diffuse and dis- tributed over whole architecture [3,4].
Software metrics can be useful in assessing software quality attributes and supporting various software engi- neering activities [9-12]. In particular, metrics can be used to assess (predict) software testability and better manage the testing effort. Having quantitative data on the testability of a software can, in fact, be used to guide the decision-making of software development managers seeking to produce high-quality software. Particularly, it can help software managers, developers and testers to [7, 8]: plan and monitor testing activities, determine the critical parts of the code on which they have to focus to ensure software quality, and in some cases use this data to review the code. One effective way to deal with this important issue is to develop prediction models based on metrics that can be used to identify critical parts of soft- ware requiring a (relative) high testing effort. There is a real need is this area.
ing, cohesion and inheritance) were already used in re-cent years to assess (predict) testability of OO software systems [7,8,14-20]. Software testability has been add- ressed from different point of views. According to Gupta
et al. [8], none of the OO metrics is alone sufficient to give an overall reflection of software testability. Soft- ware testability is, indeed, affected by many different factors as pointed out by several researchers [3-6,21,22]. Moreover, even if there is a common belief (and empi- rical evidence) that several of these metrics (attributes) have an impact on testability of classes, few empirical studies have been conducted to examine their combined effect (impact), particularly when taking into account different levels of testing effort. As far as we know, this issue has not been empirically investigated.
The aim of this paper is to investigate empirically the relationship between OO design metrics, specifically, the Chidamber and Kemerer (CK) metrics suite [23,24] and testability of classes taking into account different levels of testing effort. We also include the well-known (size related) LOC (Lines of Code) metric as a “baseline”. The question we attempt to answer is how accurately do the OO metrics (separately and when used together) predict (high) testing effort. We addressed testability of classes from the perspective of unit testing effort. We performed an empirical analysis using data collected from three open source Java software systems for which JUnit test cases exist. To capture the testing effort of classes, we used the suite of test case metrics introduced by Bruntink
et al. [7,17] to quantify the corresponding JUnit test cases. These metrics were used, in fact, to classify the classes (in terms of required testing effort) in two catego- ries: high and low.
In order to evaluate the relationship between OO de- sign metrics and unit testing effort of classes, we used logistic regression methods. We used the univariate lo- gistic regression method to evaluate the individual effect of each metric on the unit testing effort of classes. The multivariate logistic regression method was used to in- vestigate the potential of the combined effect of the met- rics. The performance of the prediction models was evaluated using Receiver Operating Characteristic (ROC) analysis. In summary, the results indicate that complexity, size, cohesion and (to some extent) coupling were found significant predictors of the unit testing effort of classes. Moreover, the results show that multivariate regression models based on OO metrics are able to accurately pre- dict the unit testing effort of classes. In addition, we ex- plored the applicability of the prediction models by ex- amining to what extent a prediction model built using data from one system can be used to predict the testing effort of classes of another system.
The rest of this paper is organized as follows: A brief summary of related work on software testability is given
in Section 2. Section 3 introduces the OO design metrics investigated in the study. Section 4 presents the selected systems, describes the data collection, introduces the test case metrics we used to quantify the JUnit test cases and presents the empirical study we performed to investigate the relationship between OO design metrics and unit testing effort of classes. Finally, Section 5 concludes the paper and outlines directions for future work.
2. Software Testability
Software testability has been addressed in literature from different point of views. Fenton et al. [10] define soft- ware testability as an external attribute. Freedman intro- duces testability measures for software components based on two factors: observability and controllability [25]. Voas defines testability as the probability that a test case will fail if a program has a fault [26]. Voas and Miller [27] propose a testability metric based on inputs and outputs domains of a software component, and the PIE (Propagation, Infection and Execution) technique to ana- lyze software testability [28]. Binder [29] defines test- ability as the relative ease and expense of revealing soft- ware faults. He argues that software testability is based on six factors: representation, implementation, built-in text, test suite, test support environment and software process capability. Khoshgoftaar et al. investigate the relationship between static software product measures and testability [30,31]. Software testability is considered as a probability predicting whether tests will detect a fault. McGregor et al. [32] investigate testability of OO software systems and introduce the visibility component measure (VC). Bertolino et al. [33] investigate testability and its use in dependability assessment. They adopt a definition of testability as a conditional probability, dif- ferent from the one proposed by Voas et al. [26], and derive the probability of program correctness using a Bayesian inference procedure. Le Traon et al. [34-36] propose testability measures for data flow designs. Pe- trenko et al. [37] and Karoui et al. [38] address testability in the context of communication software. Sheppard et al.
[22] focus on formal foundation of testability metrics. Jungmayr [39] investigates testability measurement based on static dependencies within OO systems. He takes an integration testing point of view.
Gao et al. [40,41] consider testability from the per- spective of component-based software construction. The definition of component testability is based on five fac- tors: understandability, obervability, controllability, trace- ability and testing support capability. According to Gao
address testability measurement (and improvement) of OO designs. They focus on design patterns as coherent subsets in the architecture. Chowdhary [43] focuses on why it is so difficult to practice testability in the real world. He discusses the impact of testability on design and lay down guidelines to ensure testability considera- tion during software development. Khan et al. [44] focus on testability of classes at the design level. They deve- loped a model to predict testability of classes from UML class diagrams. Kout et al. [45] adapted this model to the code level (Java programs) and evaluated it on two case studies. Briand et al. [46] propose an approach where instrumented contracts are used to increase testability. A case study showed that contract assertions detect a large percentage of failures depending on the level of precision of the contract definitions.
Bruntink et al. [7,17] investigate factors of testability of OO software systems. Testability is investigated from the perspective of unit testing. Gupta et al. [8] use fuzzy techniques to combine some OO metrics values into a single overall value called testability index. The pro- posed approach has been evaluated on simple examples of Java classes. Singh et al. [18] used OO metrics and neural networks to predict testing effort. The testing ef- fort is measured in terms of lines of code added or changed during the life cycle of a defect. In [19], Singh et al. attempt to predict testability of Eclipse at the pack- age level. Badri et al. [14] performed a similar study to that conducted by Bruntink et al. [7] using two open source Java software systems in order to explore the rela- tionship between lack of cohesion metrics and testability of classes. In [15], Badri et al. investigated the capability of lack of cohesion metrics to predict testability using logistic regression methods. More recently, Badri et al.
[16,47] investigate the effect of control flow of the unit testing effort of classes.
3. Object-Oriented Design Metrics
We present, in this section, the summary of the OO de- sign metrics we selected for the empirical study. These metrics have been selected for study because they have received considerable attention from researchers and are also being increasingly adopted by practitioners. Further- more, these metrics have been incorporated into several development tools. We selected in total seven metrics. Six of these metrics (CBO, LCOM, DIT, NOC, WMC and RFC) were proposed by Chidamber and Kemerer in [23,24]. We also include in our study the well-known LOC metric. We give in what follows a brief definition of each metric.
Coupling between Objects: The CBO metric counts for a class the number of other classes to which it is cou- pled (and vice versa).
Lack of Cohesion in Methods: The LCOM metric measures the dissimilarity of methods in a class. It is defined as follows: LCOM = |P| − |Q|, if |P| > |Q|, where P is the number of pairs of methods that do not share a common attribute and Q the number of pairs of methods sharing a common attribute. If the difference is negative, LCOM is set to 0.
Depth of Inheritance Tree: The DIT metric of a class is given by the length of the (longest) inheritance path from the root of the inheritance hierarchy to the class on which it is measured (number of ancestor classes).
Number of Children: The NOC metric measures the number of immediate subclasses of the class in a hierar- chy.
Weighted Methods per Class: The WMC metric gives the sum of complexities of the methods of a given class, where each method is weighted by its cyclomatic com- plexity. Only methods specified in the class are consi- dered.
Response for Class: The RFC metric for a class is de- fined as the set of methods that can be executed in re- sponse to a message received by an object of the class.
Lines of Code per class: The LOC metric counts for a class its number of lines of code.
4. Empirical Analysis
This study aims at investigating empirically the relation- ship between OO design metrics and testability of classes in terms of required unit testing effort. We considered in each of the used systems only the classes for which JUnit test cases exist. We noticed that developers usually name the JUnit test case classes by adding the prefix (or suffix) “Test” or “TestCase” into the name of the classes (and in few cases interfaces) for which JUnit test cases were de- veloped. Only classes that have such name matching mechanism with the test case class name are included in the analysis. This approach has already been adopted in other studies [48].
JUnit is a simple Framework for writing and running automated unit tests for Java classes. A typical usage of JUnit is to test each class Cs of the program by means of a dedicated test case class Ct. However, by analyzing the JUnit test case classes of the subject systems, we noticed that in some cases there is no one-to-one relationship between JUnit classes and tested classes. This has also been noted in other previous studies [49,50]. In these cases, several JUnit test cases correspond in fact to a same tested class.
tool1. The selected classes of the subject systems have been categorized according to the required testing effort. We used the test case metrics to quantify the JUnit test cases and identify the classes which required a (relative) high testing effort. In order to simplify the process of testing effort categorization, we provide only two cate- gorizations: classes which required a high testing effort and classes which required a (relatively) low testing ef- fort.
5763 methods, with a total of roughly 68,000 lines of code. The Apache POI (http://poi.apache. org/) project’s mission is to create and maintain Java APIs for mani- pulating various file formats based upon the Office Open XML standards (OOXML) and Microsoft’s OLE 2 Compound Document format (OLE2). This system con- sists of 1540 classes, that are comprised of 4463 attri- butes and 14,084 methods, with a total of roughly 136,000 lines of code. Moreover, we can also observe from Table 1, and this for each system, that JUnit test cases were not developed for all classes. The number of selected soft- ware classes for which JUnit test cases were developed varies from one system to another. In total, our experi- ments will be performed on 688 classes and corre- sponding JUnit test cases.
4.1. Selected Systems
Three open source Java software systems from different domains were selected for the study: ANT, JFREECH- ART (JFC) and POI. Table 1 summarizes some of their characteristics. It gives, for each system, the total number of software classes, the total number of attributes, the total number of methods, the total number of lines of code, the number of selected software classes (for which JUnit test cases were developed), and the total number of lines of code of selected software classes (for which JUnit test cases were developed). ANT (www.apache.org) is a Java library and command-line tool whose mission is to drive processes described in build files as targets and extension points dependent upon each other. This system consists of 713 classes that are comprised of 2491 attri- butes and 5365 methods, with a total of roughly 64,000 lines of code. JFC (http://www.jfree.org/jfreechart) is a free chart library for Java platform. This system consists of 496 classes that are comprised of 1550 attributes and
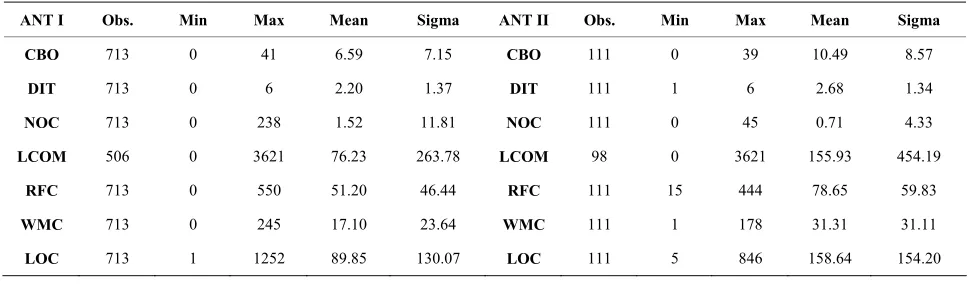
[image:4.595.64.538.469.545.2]4.2. Descriptive Statistics
Table 2 shows the descriptive statistics for all the OO metrics considered in the study. We give, for illustration, only the descriptive statistics corresponding to system ANT. We give in fact two tables of descriptive statistics (labeled I and II). The table labeled (I) indicates the de-scriptive statistics for OO metrics and this for all classes of the system. The table labeled (II) indicates the de-scriptive statistics for OO metrics only for selected classes for which JUnit test cases were developed. More- over, the metric LCOM is not computed for classes hav- ing no attributes. This is why the number of observations (Table 2: ANT(I) and ANT(II)) corresponding to the
Table 1. Some characteristics of the used systems.
#Classes #Att #Meth #LOC #TClasses #TLOC
ANT 713 2491 5365 64062 111 17609
JFC 496 1550 5763 68312 226 53115
[image:4.595.55.540.574.717.2]POI 1540 4463 14084 136005 351 51734
Table 2. Descriptive statistics for OO metrics.
ANT I Obs. Min Max Mean Sigma ANT II Obs. Min Max Mean Sigma
CBO 713 0 41 6.59 7.15 CBO 111 0 39 10.49 8.57
DIT 713 0 6 2.20 1.37 DIT 111 1 6 2.68 1.34
NOC 713 0 238 1.52 11.81 NOC 111 0 45 0.71 4.33
LCOM 506 0 3621 76.23 263.78 LCOM 98 0 3621 155.93 454.19
RFC 713 0 550 51.20 46.44 RFC 111 15 444 78.65 59.83
WMC 713 0 245 17.10 23.64 WMC 111 1 178 31.31 31.11
LOC 713 1 1252 89.85 130.07 LOC 111 5 846 158.64 154.20
metric LCOM is different from the number of observa- tions corresponding to the other OO metrics.
From Table 2 (ANT (I) and ANT (II)), we can see that classes for which JUnit test cases were developed are relatively large and complex classes. The mean values of the metrics LOC, RFC and WMC of Table 2-ANT(II) (respectively 158.64, 78.65 and 31.31), are all greater than the mean values of the same metrics in Table 2-ANT(I) (respectively 89.85, 51.20 and 17.10). This is a plausible finding. The testers actually focus on large and complex classes. We can also observe that mean value of coupling (CBO metric) in the case of selected classes for which JUnit test cases were developed (Table 2- ANT(II): 10.49) is geater than the mean value of coup- ling of all classes of ANT (Table 2-ANT(I): 6.59), sug- gesting that the coupling in the case of classes for which JUnit test cases were developed is relatively high. De- scriptive statistics of JFC and POI follow exactly the same trend.
4.3. Test Case Metrics
In order to quantify a JUnit test class (Ct) corresponding to a software class (Cs), we used the following two met-rics [7,17]: 1) TLoc: This metric gives the number of lines of code of a test class Ct. It is used to indicate the size of the test suite corresponding to a software class Cs; 2) TAss: This metric gives the number of invocations of JUnit assert methods that occur in the code of a test class
Ct. JUnit assert methods are, in fact, used by the testers to compare the expected behavior of the class under test to its current behavior. This metric is used to indicate an-other perspective of the size of a test suite. It is directly related to the construction of the test cases.
These metrics have been introduced by Bruntink et al.
in [7,17] to indicate the size of a test suite. Bruntink et al.
based, in fact, the definition of these metrics on the work of Binder [29]. They used, particularly, an adapted ver- sion of the fish bone diagram developed by Binder [29] to identify factors of testability. The used test case me- trics reflect different source code factors [7,17]: factors that influence the number of test cases required to test the classes of a system, and factors that influence the effort required to develop each individual test case. These two categories have been referred as test case generation and
test case construction factors. We assume that the effort necessary to write a test class Ct corresponding to a soft- ware class Cs is proportional to the characteristics mea- sured by the test case (TC) metrics.
4.4. Correlation Analysis
In this section, we present the first step of the empirical study we performed to explore the relationship between OO metrics (ms) and test case metrics (mt). We per-
formed statistical tests using correlation. We used a non-parametric measure of correlation in order to test the correlation between ms and mt metrics. We used the Spearman’s correlation coefficient. This technique, based on ranks of the observations, is widely used for measur- ing the degree of linear relationship between two vari- ables (two sets of ranked data). It measures how tightly the ranked data clusters around a straight line. Spear- man’s correlation coefficient will take a value between
−1 and +1. A positive correlation is one in which the ranks of both variables increase together. A negative correlation is one in which the ranks of one variable in- crease as the ranks of the other variable decrease. A cor- relation of +1 or −1 will arise if the relationship between the ranks is exactly linear. A correlation close to zero means that there is no linear relationship between the ranks. We used the XLSTAT2 tool to perform the analy- sis.
For each selected class Cs and corresponding JUnit test case (s) Ct, we have a total of 14 pairs of metrics <ms,
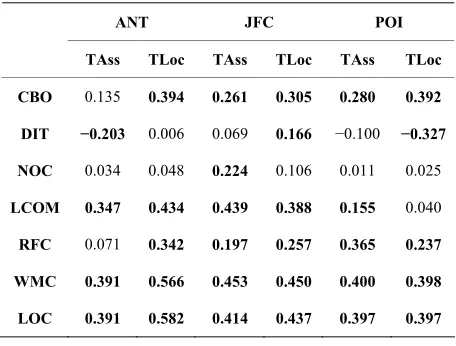
mt>. We analyzed the collected data set by calculating the Spearman’s correlation coefficient rs for each pair of metrics. Table 3 summarizes the results of the correla- tion analysis. It shows, for each of the selected systems and between each distinct pair of metrics <ms, mt>, the obtained values for the Spearman’s correlation coeffi- cient. The obtained Spearman’s correlation coefficients that are significant are set in boldface. The chosen sig- nificance level is α = 0.05. This means that for the corre- sponding pairs of metrics there exist a correlation at the 95% confidence level. We discuss briefly, in what fol- lows, the obtained results. The main purpose of this study is, in fact, to evaluate the ability of the selected OO met- rics (separately and when used together) to predict (using logistic regression methods) the testing effort of classes.
[image:5.595.309.537.549.722.2]The coupling metric CBO measures dependencies on
Table 3. Correlation values between OO and TC metrics.
ANT JFC POI
TAss TLoc TAss TLoc TAss TLoc
CBO 0.135 0.394 0.261 0.305 0.280 0.392
DIT −0.203 0.006 0.069 0.166 −0.100 −0.327
NOC 0.034 0.048 0.224 0.106 0.011 0.025
LCOM 0.347 0.434 0.439 0.388 0.155 0.040
RFC 0.071 0.342 0.197 0.257 0.365 0.237
WMC 0.391 0.566 0.453 0.450 0.400 0.398
LOC 0.391 0.582 0.414 0.437 0.397 0.397
external classes and methods. The fact that a class de- pends on other classes will probably influence its testing effort. From the obtained correlation values, between the CBO metric and the test case metrics, we can observe that the CBO metric is significantly correlated to the metric TLoc in the three subject systems. This metric is significantly correlated to the test case metric TAss in only two systems (JFC and POI). The observed correla- tion values between the metric CBO and the metric TLoc are higher than the correlation values (when significant) between the CBO metric and the test case metric TAss.
The cohesion metric LCOM is, in fact, a lack of cohe-sion metric (inverse cohecohe-sion measure). From the ob-tained correlation values, we can observe that the metric LCOM is significantly correlated to the two test case metrics for ANT and JFC. In the case of ANT and JFC, the metric LCOM is, overall, better correlated with the test case metrics than the metric CBO. The number of methods in a class influences its cohesion (lack of cohe-sion value) and the number of methods of the corre-sponding test class, which is related to the characteristics measured by the used test case metrics.
The inheritance metrics DIT and NOC are, overall, not as correlated to the used test case metrics as the metrics CBO and LCOM. The obtained correlations values are, overall, relatively low (when significant). Theoretically, if we consider that inherited methods have to be retested in any subclass, the depth of inheritance tree is likely to be correlated with at least TLoc metric. These results may, however, be affected by the testing strategies used by the developers (or the adopted style while writing test cases). The relative low use of inheritance in the case of the subject systems may also explain why the inheritance metrics are not as correlated to the test case metrics as the other OO metrics. Moreover, the used test case met- rics are measured at the class level (unit testing). This may also affect the results. The inheritance metrics would probably have a significant influence on testability at other levels.
The complexity metric WMC is significantly corre- lated to the test case metrics in all the selected systems. Also, we can see from Table 3 that the obtained correla- tion values for the metric WMC are, overall, higher than those obtained with the other OO metrics (except for the pair <LOC, TLoc> for ANT). The highest correlation value of the metric WMC is observed with the test case metric TLoc (for ANT), which is a plausible result knowing the strong relationship between size and com- plexity. The size metric LOC is significantly correlated to the test case metrics in the used systems (same trend as WMC). These results are, in fact, plausible. A large class, containing a large number of methods in particular, will require a high testing effort. The RFC metric is signifi- cantly correlated to the test case metrics in JFC and POI.
In ANT, it is significantly correlated to TLoc.
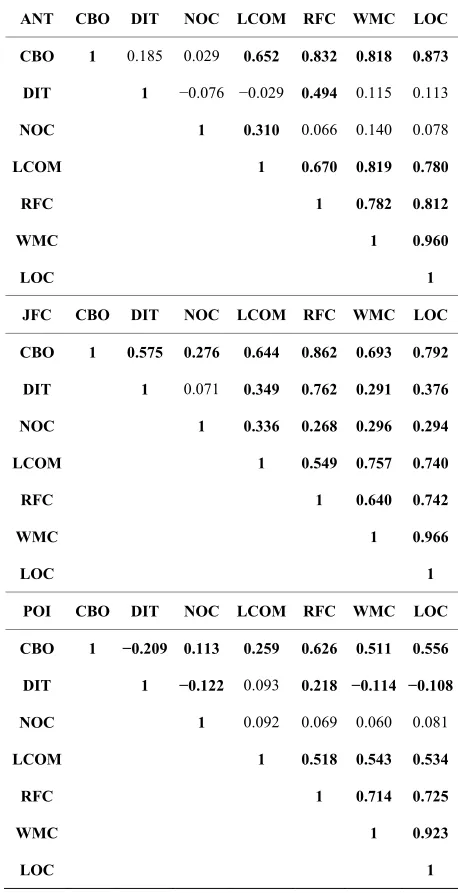
[image:6.595.307.536.286.733.2]We also calculated the Spearman’s correlation coeffi-cient rs for each pair of OO metrics <ms, ms> (Table 4) and for each pair of test case metrics <mt, mt> (Table 5). The correlation coefficients shown in bold are significant (at α = 0.05 level). The global observation that we can make from Table 4 is that the OO metrics are (at least for most) correlated between themselves, in particular, the metrics CBO, LCOM, LOC, RFC and WMP, which are related to the OO software attributes: coupling, cohe- sion, size and complexity. The inheritance metrics DIT and NOC are, in general, weakly correlated (when the correlation values are significant) to the other OO met- rics. From Table 5, the global observation that we can
Table 4. Correlation values between OO metrics.
ANT CBO DIT NOC LCOM RFC WMC LOC
CBO 1 0.185 0.029 0.652 0.832 0.818 0.873
DIT 1 −0.076 −0.029 0.494 0.115 0.113
NOC 1 0.310 0.066 0.140 0.078
LCOM 1 0.670 0.819 0.780
RFC 1 0.782 0.812
WMC 1 0.960
LOC 1
JFC CBO DIT NOC LCOM RFC WMC LOC
CBO 1 0.575 0.276 0.644 0.862 0.693 0.792
DIT 1 0.071 0.349 0.762 0.291 0.376
NOC 1 0.336 0.268 0.296 0.294
LCOM 1 0.549 0.757 0.740
RFC 1 0.640 0.742
WMC 1 0.966
LOC 1
POI CBO DIT NOC LCOM RFC WMC LOC
CBO 1 −0.209 0.113 0.259 0.626 0.511 0.556
DIT 1 −0.122 0.093 0.218 −0.114 −0.108
NOC 1 0.092 0.069 0.060 0.081
LCOM 1 0.518 0.543 0.534
RFC 1 0.714 0.725
WMC 1 0.923
Table 5. Correlation values between test case metrics.
ANT JFC POI
TAss TLoc TAss TLoc TAss TLoc
TAss 1 0.769 1 0.842 1 0.716
TLoc 1 1 1
make is that the test case metrics are also correlated be- tween themselves.
4.5. Evaluating the Effect of OO Metrics on the Testing Effort Using Logistic Regression Analysis
We present, in this section, the empirical study we con-ducted in order to evaluate the individual and combined effect of OO metrics on testability of classes in terms of unit testing effort. We used both the univariate and mul-tivariate logistic regression analysis. The univariate re-gression analysis is used to find the individual effect of each OO metric, identifying which metrics are signifi-cantly related to the testing effort of classes. The multi-variate regression analysis is used to investigate the combined effect of OO metrics on testability, indicating which metrics may play a more dominant role in pre-dicting the testing effort of classes
4.5.1. Dependent and Independent Variables
We used logistic regression to explore empirically the relationship between OO metrics (independent variables) and testability of classes in terms of unit testing effort (dependent variable). We used the test case metrics TLoc and TAss to identify the classes which required a (rela-tive) high testing effort. In order to simplify the process of testing effort categorization, we provide only two categorizations: classes which required a high testing effort and classes which required a (relative) low testing effort.
Category 1: includes the JUnit test classes for which the two following conditions are satisfied: 1) large num- ber of lines of code (corresponding TLoc ≥ mean value of TLoc); and 2) large number of invocations of JUnit assert methods (corresponding TAss ≥ mean value of TAss). We affect the value 1 to the corresponding classes.
Category 2: includes all the other JUnit test classes. We affect the value 0 to the corresponding classes.
Table 6 summarizes the distribution of classes accord- ing to the adopted categorization.
4.5.2. Hypotheses
The study tested seven hypotheses, which relate the se- lected metrics to the testing effort. For each source code
Table 6. Distribution of classes.
1 0
ANT 38.74% 61.26%
JFC 37.17% 62.83%
POI 35.04% 64.96%
metric ms, the hypothesis was:
A class with a high ms value is more likely to require a high testing effort than a class with a low ms value.
The null hypothesis was:
A class with a high ms value is no more likely to re- quire a high testing effort than a class with a low ms value.
4.5.3. Logistic Regression Analysis: Research Methodology
Logistic Regression (LR) is a standard statistical model- ing method in which the dependent variable can take on only one of two different values. It is suitable for build- ing software quality classification models. It is used to predict the dependent variable from a set of independent variables to determine the percent of variance in the de- pendent variable explained by the independent variables [9,51,52]. This technique has been widely applied to the prediction of fault-prone classes [20,52-56]. LR is of two types: Univariate LR and Multivariate LR. A multivari- ate LR model is based on the following equation:
1
1
1, ,
1 i n
i i i
i n i i i
a b X
n a b X
e
P X X
e
(1)
independent variables, and the more accurate the model.
4.5.4. Model Evaluation
In order to evaluate the performance of the predicted models, we used the ROC (Receiver Operating Charac-teristic) analysis. Indeed, precision and recall, which are traditional evaluation criteria used to evaluate the predic-tion accuracy of logistic regression models are subject to change as the selected threshold changes. The ROC curve, which is defined as a plot of sensitivity on the y-coordinate versus its 1-specificity on the x-coordinate, is an effective method of evaluating the performance of prediction models [57]. The optimal choice of the cutoff point that maximizes both sensitivity and specificity can be selected from the ROC curve. This will allow avoid-ing an arbitrary selection of the cutoff. In order to evalu-ate the performance of the models, we used particularly the AUC (Area Under the Curve) measure. It is a com-bined measure of sensitivity and specificity. It allows appreciating the model without subjective selection of the cutoff value. The larger the AUC measure, the better the model is at classifying classes. A perfect model that correctly classifies all classes has an AUC measure of 1. An AUC value close to 0.5 corresponds to a poor model. An AUC value greater than 0.7 corresponds to a good model [58]. Furthermore, if a prediction model is built on one data set (used as training set) and evaluated on the same data set (used as testing set), then the accuracy of the model will be artificially inflated [59]. A common way to obtain a more realistic assessment of the predic-
tive ability of the models is to use cross validation (k-fold cross-validation), which is a procedure in which the data set is partitioned in k subsamples (groups of observa-tions). The regression model is built using k− 1 groups and its prediction evaluated on the last group. This proc-ess is repeated k times. Each time, a different subsample is used to evaluate the model, and the remaining subsam-ples are used as training data to build the model. We performed, in our study, a 10-fold cross-validation.
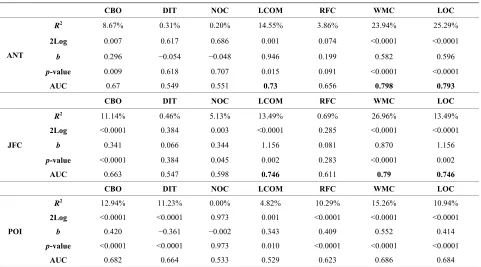
4.5.5. Univariate LR Analysis: Results and Discussion
In this section, we present the results obtained using the univariate LR analysis. The results, summarized in Table 7, show that: For system ANT, the b-coefficients of the metrics LCOM, WMC and LOC (respectively 0.946, 0.582 and 0.596) are significantly different from zero according to their p-values. The metrics LOC, WMC and LCOM have (respectively) the highest (and significant)
[image:8.595.59.540.469.736.2]R2 values (respectively 0.2529, 0.2394 and 0.1455). The metrics NOC, DIT, RFC and CBO have (respectively) the lowest b and R2 coefficients values. The metric CBO was, however, significant at 0.05 significance level. Ac- cording to these results, the metrics LOC, WMC and LCOM are (more) significantly related to the testing ef-fort compared to the other OO metrics. The AUC values (WMC: 0.798, LOC: 0.793 and LCOM: 0.73) confirm that univariate LR models based on the metrics WMC, LOC and LCOM are more predictive of testing effort than the other OO metrics. The metrics LOC and WMC have the highest R2 (and AUC values), which shows that
Table 7. Results for univariate LR analysis.
CBO DIT NOC LCOM RFC WMC LOC
R2 8.67% 0.31% 0.20% 14.55% 3.86% 23.94% 25.29%
2Log 0.007 0.617 0.686 0.001 0.074 <0.0001 <0.0001
b 0.296 −0.054 −0.048 0.946 0.199 0.582 0.596
p-value 0.009 0.618 0.707 0.015 0.091 <0.0001 <0.0001
ANT
AUC 0.67 0.549 0.551 0.73 0.656 0.798 0.793
CBO DIT NOC LCOM RFC WMC LOC
R2 11.14% 0.46% 5.13% 13.49% 0.69% 26.96% 13.49%
2Log <0.0001 0.384 0.003 <0.0001 0.285 <0.0001 <0.0001
b 0.341 0.066 0.344 1.156 0.081 0.870 1.156
p-value <0.0001 0.384 0.045 0.002 0.283 <0.0001 0.002
JFC
AUC 0.663 0.547 0.598 0.746 0.611 0.79 0.746
CBO DIT NOC LCOM RFC WMC LOC
R2 12.94% 11.23% 0.00% 4.82% 10.29% 15.26% 10.94%
2Log <0.0001 <0.0001 0.973 0.001 <0.0001 <0.0001 <0.0001
b 0.420 −0.361 −0.002 0.343 0.409 0.552 0.414
p-value <0.0001 <0.0001 0.973 0.010 <0.0001 <0.0001 <0.0001
POI
these metrics are the best predictors of the testing effort. For system JFC, we can observe also the same trends. The metrics WMC, LOC and LCOM have (respectively) the highest (and significant) R2 values (respectively 0.2696, 0.1349 and 0.1349). Here also, the AUC values (WMC: 0.79, LOC: 0.746 and LCOM: 0.746) confirm that univariate LR models based on the metrics WMC, LOC and LCOM are more predictive of testing effort than the metrics DIT, NOC, RFC and CBO. The WMC metric has the highest R2 (and AUC value), which shows that it is (here also) the best predictor of testing effort. The LOC metric has the second highest R2 (and AUC value). Moreover, in this case also the metric CBO was significant (at 0.01). The AUC value of the metric CBO is almost the same as that obtained for system ANT. For system POI, even if the results show that the b and R2 coefficients values for the OO metrics (except NOC) are significant, the AUC values of the univariate models are all lower than 0.7. The metrics WMC, CBO and DIT have the highest (and significant) R2 values (respectively 0.1526, 0.1294 and 0.1123). These results, based on the data set we used and particularly data collected from
ANT and JFC systems, suggest that the metrics WMC, LOC, LCOM and CBO (to some extent) are significant predictors of testing effort. Hence, we can reasonably support the hypothesis of each of these metrics. These metrics are related respectively to: complexity, size, co- hesion and coupling.
4.5.6. Multivariate LR Analysis: Results and Discussion
We present, in this section, the results of the multivariate LR analysis. The main objective was to explore the po- tential of OO design metrics, when used in combination, to predict the unit testing effort of classes. Indeed, the multivariate LR analysis here is not intended to be used to build the best prediction model combining the OO source code metrics because, in this case, other metrics also have to be considered (for example, other coupling or size metrics). Such a model is out of the scope of this paper.
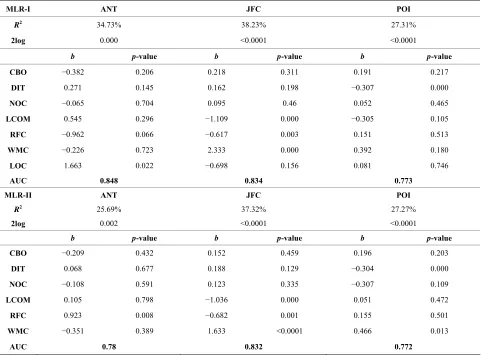
[image:9.595.58.539.382.739.2]We performed, in this step, two different experiments. The first experiment includes all the selected metrics (Table 8 MLR-I), in contrast to the second experiment
Table 8. Results for multivariate LR analysis.
MLR-I ANT JFC POI
R2 34.73% 38.23% 27.31%
2log 0.000 <0.0001 <0.0001
b p-value b p-value b p-value
CBO −0.382 0.206 0.218 0.311 0.191 0.217
DIT 0.271 0.145 0.162 0.198 −0.307 0.000
NOC −0.065 0.704 0.095 0.46 0.052 0.465
LCOM 0.545 0.296 −1.109 0.000 −0.305 0.105
RFC −0.962 0.066 −0.617 0.003 0.151 0.513
WMC −0.226 0.723 2.333 0.000 0.392 0.180
LOC 1.663 0.022 −0.698 0.156 0.081 0.746
AUC 0.848 0.834 0.773
MLR-II ANT JFC POI
R2 25.69% 37.32% 27.27%
2log 0.002 <0.0001 <0.0001
b p-value b p-value b p-value
CBO −0.209 0.432 0.152 0.459 0.196 0.203
DIT 0.068 0.677 0.188 0.129 −0.304 0.000
NOC −0.108 0.591 0.123 0.335 −0.307 0.109
LCOM 0.105 0.798 −1.036 0.000 0.051 0.472
RFC 0.923 0.008 −0.682 0.001 0.155 0.501
WMC −0.351 0.389 1.633 <0.0001 0.466 0.013
which excludes the metric LOC (Table 8 MLR-II). This will allow us to compare the performance of the predic- tion model MLR-II which is based on the CK metrics only, with the performance of the prediction model MLR-I which is based on all the considered metrics. Moreover, as mentioned in Section 4.2 (descriptive sta-tistics), the metric LCOM is not computed for all classes. The classes for which LCOM is not computed and the corresponding JUnit test cases have been excluded from our measurements (multivariate LR). So, the models MLR-I and MLR-II were built using data collected from only classes (and the corresponding JUnit test cases) for which LCOM is computed. The number of considered classes differ from one system to another (ANT: 98, JFC: 219 and POI: 313).
In the first experiment, we used all the OO metrics to build the multivariate regression model. Table 8 MLR-I summarizes the results of the multivariate analysis. From
Table 8 MLR-I, it can be seen that for ANT the AUC value is 0.848, which is higher than the AUC values ob- tained with the univariate LR analysis. It is also the highest value of AUC obtained in this experiment. More- over, the R2 value increases (34.73%). This shows that the combined effect of the metrics is higher. The results also show that the metric LOC has the highest (and sig- nificant) contribution (impact of the metric on the prob- ability of detecting a high testing effort). For JFC, we can see that the AUC value is 0.834, which is higher (here also) than the AUC values obtained with the univariate LR analysis. Moreover, the R2 value, as in the case of ANT, increases (38.23%). The results show that the met- rics WMC, LCOM and RFC have the highest (and sig- nificant) contributions. For POI, we can see that the AUC value is 0.773, which is higher (here also) than the AUC values obtained with the univariate LR analysis. More- over, the results (combined effect of the metrics) are sig- nificant in contrast to the results of the univariate analy- sis (individual effect of the metrics). The R2 value, as in the case of ANT and JFC, increases (27.31%). The R2 value in this case is relatively high than all the R2 values obtained in the case of univariate analysis. This shows once again that the combined effect of the metrics is more significant than when the metrics are considered individually.
In the second experiment, we used only the CK met- rics to build the multivariate regression model. Table 8
MLR-II summarizes the results of the multivariate analy- sis. From Table 8 MLR-II, we can observe that the re- sults have (overall) the same trend as those obtained during the first experiment. The results are significant for the three systems ANT, JFC and POI. From Table 8
MLR-II, it can be seen that for ANT the AUC value is 0.780, which is slightly less than the AUC values of the univariate models based on the metrics WMC and LOC
(respectively 0.798 and 0.793), and greater than the AUC values of the univariate models based on the metrics CBO, DIT, NOC, LCOM and RFC. Moreover, the R2 value (25.69%) increased slightly compared to the R2 value of the univariate model based on the metric LOC (25.29%, which was the highest R2 value obtained in the univariate analysis for ANT). The results also show that the metric RFC has the highest (and significant) contri- bution (impact of the metric on the probability of detect- ing a high testing effort). For JFC, we can see that the AUC value is 0.832, which is higher than the AUC val- ues obtained with the univariate LR analysis. Moreover, the R2 value increases (37.32%). The results show that the metrics WMC, LCOM and RFC have the highest (and significant) contributions. For POI, we can see that the AUC value is 0.772, which is higher (here also) than the AUC values obtained with the univariate LR analysis. Moreover, the results (combined effect of the metrics) are significant in contrast to the results of the univariate analysis (individual effect of the metrics). The R2 value, as in the case of ANT and JFC, increases (27.27%). The
R2 value in this case also is relatively high than all the R2 values obtained in the case of univariate LR analysis. This shows once again that the combined effect of the metrics is more significant than when the metrics are considered individually. In the case of POI, the results show that the metrics WMC and DIT have the highest (and significant) contributions (as for MLR-I).
analysis. Furthermore, in order to obtain a more realistic assessment of the predictive abilities of the models, we performed in our study a 10-fold cross-validation (MLR models). We used the R3 tool.
4.5.7. Applicability of the Prediction Models
In addition, we explored to what extent a prediction model built using data from one of the three used sys-tems can be used to predict the testing effort of classes of the two other systems. Indeed, the practical purpose of building software prediction models (reliability, fault- proneness, testing effort, etc.) is to apply them to soft- ware systems. Knowing that we have collected data sets from three different systems, we evaluated each model
Mi, constructed using data from a system Si, on data from another system Sj (i # j). As mentioned previously, the three used systems are from different domains and have different characteristics. Moreover, they have been de- veloped by different teams. We used, in fact, the data from a system as the training data set and the data from another system as the testing data set. Usually, the data set with the largest number of observations is designated as the training data set and the remaining system data sets as the testing sets [59]. So, in our study, we per- formed the following tests: 1) we applied the prediction model built using the data set of POI (referenced as MPOI) for predicting the testing effort of classes of JFC and ANT; and 2) we applied the prediction model built using the data set of JFC (referenced as MJFC) to predict the testing effort of classes of ANT.
The results of a prediction model depend on the cho- sen value of the threshold. Indeed, if the predicted testing effort of a class is above the chosen value, the class is classified as requiring a high testing effort. Moreover, the value of the threshold may vary from one system to an- other because of differences between systems. To avoid an arbitrary selection of the cutoff, and as a first attempt to assess the applicability of the prediction models, we explored in each test different values of threshold. We used here also the ROC analysis to evaluate the per-formance of the models. The obtained AUC values are 0.69, 0.67 and 0.71 respectively for applying MPOI for predicting the testing effort of classes of JFC and ANT and for applying MJFC to predict the testing effort of classes of ANT. The models do not show, in fact, a strong difference. Their prediction performance is, over-all, acceptable. The results indicate that the LR predic-tion models built using the OO metrics seem viable. They show, at least, that the metrics when combined of-fer a promising potential for predicting the testing effort of classes. Further investigations are, however, needed to
make more general conclusions.
4.6. Threats to Validity
The achieved results are based on the data set we col- lected from the analyzed systems. We analyzed a total of 688 classes and corresponding JUnit test cases. Even if we believe that the analyzed set of data is large enough to allow obtaining significant results, we do not claim that our results can be generalized to all systems. The study should be, indeed, replicated on a large number of OO software systems to increase the generality of our find- ings. In fact, there are a number of limitations that may affect the results of the study or limit their interpretation and generalization.
First, the JUnit test cases used in our study were de- veloped for large and complex classes. This is true for the three subject systems. It would be interesting to rep- licate this study using systems for which JUnit test cases have been developed for a maximum number of classes. This will allow observing the performance of the metrics (individually and used in combination) for different types of classes (small, medium and large). Second, it is also possible that facts such as the development style used by the developers for writing test cases may affect the re- sults or produce different results for specific applications. We observed, for example, that in some cases the deve- loped JUnit classes do not cover all the methods of the corresponding software classes. As the OO metrics are source code metrics and are computed using the com- plete code of the classes, this may bias the results. Fi- nally, another important threat to validity is from the identification of the relationship between the JUnit test cases and tested classes. We noticed, in fact, by analyz- ing the code of the JUnit test cases of the investigated systems that, in some cases, there is no one-to-one rela- tionship between JUnit test cases and tested classes. In these cases, several JUnit test cases have been related to a same tested class. Even if we followed a systematic approach for associating the JUnit test cases to the cor- responding tested classes, unfortunately we have not been able to do that for all classes. This may also affect the results of our study, or produce different results from one system to another.
5. Conclusions and Future Work
related to the JUnit test cases were used, in fact, to clas- sify the classes in two categories in terms of required testing effort: high and low.
In order to evaluate the relationship between OO met- rics and unit testing effort of classes, we performed sta- tistical analysis using correlation and logistic regression methods. We used the univariate logistic regression analysis to evaluate the individual effect of the selected metrics on the testing effort of classes. We used the mul- tivariate logistic regression analysis to evaluate their combined effect. The performance of the predicted mo- dels was evaluated using Receiver Operating Characte- ristic analysis. We also included in our study the well- known LOC metric as a “baseline”. Univariate regression analysis, based on the data set we used, suggests that univariate LR models based on the metrics WMC, LOC, LCOM and CBO (also to some extent) are significant predictors of unit testing effort. Moreover, the results show that multivariate regression models based on OO metrics are able to accurately predict the unit testing ef- fort of classes. The multivariate analysis shows that, overall, the metrics WMC, RFC, LCOM and LOC have the highest effect on the testing effort. In summary, the metrics that were found significant predictors of the test- ing effort (in the univariate analysis and in the multivari- ate analysis as having a relatively high effect) are related to the important OO attributes: size, complexity, cohe- sion and coupling.
In addition, we explored the applicability of the pre- diction models by examining to what extent a prediction model built using data from one system can be used to predict the testing effort of classes of another system. The results clearly show that the prediction models were able to achieve acceptable levels of performance in the classification of classes according to the predicted testing effort. We hope these findings will help to a better under- standing of what contributes to testability of classes in OO systems, and particularly the relationship between OO attributes (metrics) and testability of classes. The performed study should be replicated using many other OO software systems in order to draw more general con- clusions. The findings in this paper should be viewed as exploratory and indicative rather than conclusive. More- over, knowing that software testability is affected by many different factors, it would be interesting to extend the used suite of test case metrics to better reflect the testing effort.
As future work, we plan to: extend the used test case metrics to better reflect the testing effort, use other OO metrics to improve the performance of the prediction models, use other methods (such as machine learning methods) to explore the individual and combined effect of the metrics on testability of classes, explore other ap- proaches for testing effort rating (ranking) and finally
replicate the study on other OO software systems to be able to give generalized results.
6. Acknowledgements
This project was financially supported by NSERC (Na- tional Sciences and Engineering Research Council of Canada).
REFERENCES
[1] IEEE, “IEEE Standard Glossary of Software Engineering Terminology,” IEEE CSP, New York, 1990.
[2] ISO/IEC 9126, “Software Engineering Product Quality,” 1991.
[3] B. Baudry, B. Le Traon and G. Sunyé, “Testability Analysis of a UML Class Diagram,” 9th International
Software Metrics Symposium, Sydney, 3-5 September
2003.
[4] B. Baudry, Y. Le Traon, G. Sunyé and J. M. Jézéquel, “Measuring and Improving Design Patterns Testability,”
9th International Software Metrics Symposium, Sydney,
3-5 September 2003.
[5] P. L. Yeh and J. C. Lin, “Software Testability Measure-ment Derived From Data Flow Analysis,” 2nd Euromicro
Conference on Software Maintenance and Reengineering,
Florence, 8-11 March 1998.
[6] L. Zhao, “A New Approach for Software Testability Analysis,” 28th International Conference on Software
Engineering, Shanghai, 20-28 May 2006.
[7] M. Bruntink and A. V. Deursen, “Predicting Class Test-ability Using Object-Oriented Metrics,” 4th International
Workshop on Source Code Analysis and Manipulation,
Chicago, 15-16 September 2004. doi:10.1109/SCAM.2004.16
[8] V. Gupta, K. K. Aggarwal and Y. Singh, “A Fuzzy Ap-proach for Integrated Measure of Object-Oriented Soft-ware Testability,” Journal of Computer Science, Vol. 1, No. 2, 2005, pp. 276-282.
doi:10.3844/jcssp.2005.276.282
[9] V. R. Basili, L. C. Briand and W. Melo, “A Validation of Object-Oriented Design Metrics as Quality Indicators,”
IEEE Transactions on Software Engineering, Vol. 22, No.
10, 1996, pp. 751-761. doi:10.1109/32.544352
[10] N. Fenton and S. L. Pfleeger, “Software Metrics: A Rig-orous and Practical Approach,” PWS Publishing Com-pany, Boston, 1997.
[11] R. S. Pressman, “Software Engineering, A Practitioner’s Approach,” 6th Edition, McGraw Hill, New York, 2005. [12] I. Sommervile, “Software Engineering,” 9th Edition,
Ad-dison Wesley, New York, 2011.
[13] B. Henderson-Sellers, “Object-Oriented Metrics Meas-ures of Complexity,” Prentice-Hall, Upper Saddle River, 1996.
Eds., Advances in Software Engineering,
Communica-tions in Computer and Information Science, Vol. 117,
Springer, Berlin, 2010.
[15] L. Badri, M. Badri and F. Touré, “An Empirical Analysis of Lack of Cohesion Metrics for Predicting Testability of Classes,” International Journal of Software Engineering
and Its Applications, Vol. 5, No. 2, 2011, pp. 69-85.
[16] M. Badri and F. Touré, “Empirical Analysis for Investi-gating the Effect of Control Flow Dependencies on Test-ability of Classes,” 23rd International Conference on
Software Engineering and Knowledge Engineering,
Mi-ami Beach, 7-9 July 2011.
[17] M. Bruntink and A. V. Deursen, “An Empirical Study into Class Testability,” Journal of Systems and Software, Vol. 79, No. 9, 2006, pp. 1219-1232.
doi:10.1016/j.jss.2006.02.036
[18] Y. Singh, A. Kaur and R. Malhota, “Predicting Testability Effort Using Artificial Neural Network,” Proceedings of the World Congress on Engineering and Computer Sci-ence, San Francisco, 22-24 October 2008.
[19] Y. Singh and A. Saha, “Predicting Testability of Eclipse: A Case Study,” Journal of Software Engineering, Vol. 4, No. 2, 2010, pp. 122-136. doi:10.3923/jse.2010.122.136 [20] Y. Singh, A. Kaur and R. Malhota, “Empirical Validation
of Object-Oriented Metrics for Predicting Fault Proneness Models,” Software Quality Journal, Vol. 18, No. 1, 2010, pp. 3-35. doi:10.1007/s11219-009-9079-6
[21] B. Baudry, Y. Le Traon and G. Sunyé, “Improving the Testability of UML Class Diagrams,” Proceedings of
In-ternational Workshop on Testability Analysis, Rennes, 2
November 2004.
[22] J. W. Sheppard and M. Kaufman, “Formal Specification of Testability Metrics,” IEEE AUTOTESTCON, Phila-delphia, 20-23 August 2001.
[23] S. R. Chidamber and C. F. Kemerer, “A Metrics Suite for OO Design,” IEEE Transactions on Software Engineer-ing, Vol. 20, No. 6, 1994, pp. 476-493.
doi:10.1109/32.295895
[24] S. R. Chidamber, D. P. Darcy and C. F. Kemerer, “Mana-gerial Use of Metrics for Object-Oriented Software: An Exploratory Analysis,” IEEE Transactions on Software
Engineering, Vol. 24, No. 8, 1998, pp. 629-637.
doi:10.1109/32.707698
[25] R. S. Freedman, “Testability of Software Components,”
IEEE Transactions on Software Engineering, Vol. 17, No.
6, 1991, pp. 553-564. doi:10.1109/32.87281
[26] J. M. Voas, “PIE: A Dynamic Failure-Based Technique,”
IEEE Transactions on Software Engineering, Vol. 18, No.
8, 1992, pp. 717-727. doi:10.1109/32.153381
[27] J. Voas and K. W. Miller, “Semantic Metrics for Software Testability,” Journal of Systems and Software, Vol. 20, No. 3, 1993, pp. 207-216.
doi:10.1016/0164-1212(93)90064-5
[28] J. M. Voas and K. W. Miller, “Software Testability: The New Verification,” IEEE Software, Vol. 12, No. 3, 1995, pp. 17-28. doi:10.1109/52.382180
[29] R. V. Binder, “Design for Testability in Object-Oriented
Systems,” Communications of the ACM, Vol. 37, No. 9, 1994, pp. 87-101. doi:10.1145/182987.184077
[30] T. M. Khoshgoftaar and R. M. Szabo, “Detecting Pro-gram Modules with Low Testability,” 11th International
Conference on Software Maintenance, Nice, 16 October
1995.
[31] T. M. Khoshgoftaar, E. B. Allen and Z. Xu, “Predicting Testability of Program Modules Using a Neural Net-work,” 3rd IEEE Symposium on Application-Specific
Systems and SE Technology, Richardson, 24-25 March
2000, pp. 57-62.
[32] J. McGregor and S. Srinivas, “A Measure of Testing Ef-fort,” Proceedings of the Conference on OO Technologies, Toronto, 17-21 June 1996.
[33] A. Bertolino and L. Strigini, “On the Use of Testability Measures for Dependability Assessment,” IEEE
Transac-tions on Software Engineering, Vol. 22, No. 2, 1996, pp.
97-108. doi:10.1109/32.485220
[34] Y. Le Traon and C. Robach, “Testability Analysis of Co-Designed Systems,” Proceedings of the 4th Asian Test
Symposium, ATS. IEEE CS, Washington, 1995.
[35] Y. Le Traon and C. Robach, “Testability Measurements for Data Flow Design,” Proceedings of the 4th
Interna-tional Software Metrics Symposium, New Mexico, 5-7
November 1997. doi:10.1109/METRIC.1997.637169 [36] Y. Le Traon, F. Ouabdessalam and C. Robach,
“Analyz-ing Testability on Data Flow Designs,” ISSRE’00, 2000. [37] A. Petrenko, R. Dssouli and H. Koenig, “On Evaluation
of Testability of Protocol Structures,” IFIP, Rueil-Mal- maison, 1993.
[38] K. Karoui and R. Dssouli, “Specification Transformations and Design for Testability,” Proceedings of the IEEE
Global Telecommunications Conference, London, 18-22
November 1996, pp. 680-685.
[39] S. Jungmayr, “Testability Measurement and Software Dependencies,” Proceedings of the 12th International
Workshop on Software Measurement, Magdeburg, 7-9
October 2002.
[40] J. Gao, J. Tsao and Y. Wu, “Testing and Quality Assur-ance for Component-Based Software,” Artech House Publisher, London, 2003.
[41] J. Gao and M. C. Shih, “A Component Testability Model for Verification and Measurement,” COMPSAC IEEE, 2005.
[42] T. B. Nguyen, M. Delaunay and C. Robach, “Testability Analysis Applied to Embedded Data-Flow Software,”
Proceedings of the 3rd International Conference on
Quality Software, Dallas, 6-7 November 2003, pp. 4-11.
doi:10.1109/QSIC.2003.1319121
[43] V. Chowdhary, “Practicing Testability in the Real World,”
International Conference on Software Testing, Verifica-
tion and Validation, IEEE CSP, Washington, 21-25 March
2009, pp. 260-268.
[44] R. A. Khan and K. Mustafa, “Metric Based Testability Model for Object-Oriented Design (MTMOOD),” ACM
SIGSOFT Software Engineering Notes, Vol. 34, No. 2,
[45] A. Kout, F. Toure and M. Badri, “An Empirical Analysis of a Testability Model for Object-Oriented Programs,”
ACM SIGSOFT Software Engineering Notes, Vol. 36, No.
4, 2011, pp. 1-5. doi:10.1145/1988997.1989020
[46] L. C. Briand, Y. Labiche and H. Sun, “Investigating the Use of Analysis Contracts to Improve the Testability of Object-Oriented Code,” Software—Practice and Experi-ence, Vol. 33, No. 7, 2003, pp. 637-672.
doi:10.1002/spe.520
[47] M. Badri and F. Touré, “Evaluating the Effect of Control Flow on the Unit Testing Effort of Classes: An Empirical Analysis,” Advances in Software Engineering, Vol. 2012, 2012, 13 p. doi:10.1155/2012/964064
[48] A. Mockus, N. Nagappan and T. T. Dinh-Trong, “Test Coverage and Post-Verification Defects: A Multiple Case Study,” 3rd International Symposium on Empirical
Soft-ware Engineering and Measurement, Lake Buena Vista,
15-16 October 2009. doi:10.1109/ESEM.2009.5315981 [49] B. Van Rompaey and S. Demeyer, “Establishing
Trace-ability Links between Unit Test Cases and Units under Test,” Proceedings of the European Conference on
Soft-ware Maintenance and Reengineering, Kaiserslautern,
24-27 March 2009.
[50] A. Qusef, G. Bavota, R. Oliveto, A. De Lucia and D. Binkley, “SCOTCH: Test-to-Code Traceability Using Slicing and Conceptual Coupling,” International
Confer-ence on Software Maintenance, Williamsburg, 29 March
2011.
[51] K. K. Aggarwal, Y. Singh, K. Arvinder and M. Ruchika, “Empirical Analysis for Investigating the Effect of Ob-ject-Oriented Metrics on Fault Proneness: A Replicated Case Study,” Software Process: Improvement and Prac-tice, Vol. 16, No. 1, 2009, pp. 39-62.
doi:10.1002/spip.389
[52] Y. Zhou and H. Leung, “Empirical Analysis of Ob-ject-Oriented Design Metrics for Predicting High and Low Severity Faults,” IEEE Transactions on Software
Engineering, Vol. 32, No. 10, 2006, pp.771-789.
[53] L. C. Briand, J. Daly and J. Wuest, “A Unified Frame-work for Cohesion Measurement in Object-Oriented Sys-tems,” Empirical Software Engineering—An
Interna-tional Journal, Vol. 3, No. 1, 1998, pp. 65-117.
[54] L. C. Briand, J. Wust, J. Daly and V. Porter, “Exploring the Relationship between Design Measures and Software Quality in Object-Oriented Systems,” Journal of Systems
and Software, Vol. 51, No. 3, 2000, pp. 245-273.
doi:10.1016/S0164-1212(99)00102-8
[55] T. Gyimothy, R. Ferenc and I. Siket, “Empirical Valida-tion of Object-Oriented Metrics on Open Source Software for Fault Prediction,” IEEE Transactions on Software
en-gineering, Vol. 3, No. 10, 2005, pp. 897-910.
[56] A. Marcus, D. Poshyvanyk and R. Ferenc, “Using the Conceptual Cohesion of Classes for Fault Prediction in Object-Oriented Systems,” IEEE Transactions on
Soft-ware Engineering, Vol. 34, No. 2, 2008, pp. 287-300.
doi:10.1109/TSE.2007.70768
[57] K. El Emam and W. Melo, “The Prediction of Faulty Classes Using Object-Oriented Design Metrics,” National Research Council of Canada NRC/ERB 1064, 1999. [58] D. W. Hosmer and S. Lemeshow, “Applied Logistic
Re-gression,” Wiley, New York, 2000. doi:10.1002/0471722146