Journal of Chemical and Pharmaceutical Research, 2017, 9(9):37-43
Research Article
CODEN(USA) : JCPRC5
ISSN : 0975-7384
37
Isolation and Characterization of Host Guest Complexes through
Spectroscopy and Liquid –Liquid Extraction Studies
Jyoti Tomar
1*, Praval Singh Chauhan
2and Uma Sharma
31School of Agriculture, ITM University, India 2Department Chemistry, ITM University, India 3
School of Studies in Chemistry and Biochemistry, Vikram University, India
_____________________________________________________________________________
ABSTRACT
A new method for the synthesis of Chromogenic ionophores; 4,4’–nitrophenyl-azo-O,O’-phenyl- 3, 6, 9-trioxaundecane-1, 10-dioate (R1), bis-[4,4’-nitrophenyl-azo-naphthyl-(2,2-dioxydiethyl ether)] (R2) and
non-cyclic ionophores; 1,8- bis -(2-naphthyloxy)-3,6-dioxaoctane (R3),
1,11-bis-(2-naphthyloxy)-3,6,9-trioxaundecane (R4), 1,5-bis- (2-naphthyloxy)-3-oxapentane (R5) has been constructed and their interaction
with lithium, sodium, potassium and calcium picrates has been studied. The Complexes were isolated in methanol and mixture of methanol and ethyl acetate. The stoichiometry of complexes was 1:1. Characterization of complexes was carried out by m.p., elemental analysis, IR, 1H NMR, FAB mass analysis. The ionophore R1 complexes with Na+ and Ca++, R2 and R5 with Li+ and Mg++ respectively while
R3 and R4 complexes with all metal ions. The same trend is observed in liquid –liquid extraction studies. As
the supramolecular interaction between host and guest is temporary, non-covalent and required less energy to break interaction the selectivity / specificity of these ionophores will be utilized in construction of ion selective electrodes and as metal ion indicators.
Keywords: Chromogenic ionophores; Non-cyclic ionophores; Metal-ligand complexes; Stoichiometry selectivity
_____________________________________________________________________________
INTRODUCTION
The crown ethers [1], cryptands [2]and podands [3] can interact with many guests including inorganic ions and neutral organic molecules through weak non-covalent interaction. The Chromogenic crown ethers have discovered by Nakamura et al. [4,5]. Nitrophenyl azo-15-crown-5 has been used as colorimetric regent for the determination of sodium and potassium [6]. The complexation properties of Chromogenic crown ethers [5,6] and non-cyclic ionophores (podands) have been investigated extensively. Interest in these compounds have been grown due to their importance in supramolecular chemistry [7]as they are selective for alkali, alkaline earth metal ions [8]and used as ion selective electrodes [9]. The complexing abilities of these ionophores can be increased by addition of aromatic end groups to simple glycols [10-12]. The aim of our work is to understand principles that are involved during complexation of these ionophores with metal ions i.e., stoichiometry of the complexes, effect of end group, chain length and charge of cation etc.
In this communication, we are reporting the synthesis of azo benzene bridged ionophores (R1 and R2) and
non-cyclic ionophores (R3-R5) having naphthyl end groups with different chain length and isolation of their
________________________________________________________________________
38
MATERIALS AND METHODS
The reagents used in the synthesis of ionophores (R1-R5) i.e., 4(4'-nitrophenyl-azo)-resorcinol,
4(4'-nitrophenyl-azo)-1-naphthol and 2-naphthol were purchased from Merck India and used as such while (3,6,9-trioxaundecandioic) acid, 2,2’dichloro-diethylether, 1,11-dichloro-3, 6,9-trioxaundecane and bis-(1,2-chloroethoxy ethane) were purchased from FLUKA Switzerland. Methanol, 1-butanol, DMSO and SOCl2 were purchased from Merck, India and used without purification. Hydrochloric acid, sodium
hydroxide and Magnesium sulphate were purchased from Aldrich, USA.
The metal salts as Metal Picrates (MX: Mn+ = Na+, K+, Ca++, Mg++, X- = Pic-) were prepared by reported method [13].Melting points were determined by melting point apparatus (Boss 165). Elemental analysis (C, H, N) were obtained from CDRI Lucknow using elemental analyzer (Carlo Erba 1108). Metal ions were estimated by flame photometer (Systronics 121). IR spectra were recorded on FTIR spectrophotometer (Perkin Elmer 70836) and 1H NMR spectra were recorded in D2O/CDCl3 using TMS as internal reference
at CDRI Lucknow on NMR spectrophotometer (Varian 350) at 300 MHz.
Synthesis of Azo Benzene Bridged Ionophores R1 and R2
Preparation of ionophore (R1); 4, 4’-nitrophenyl-azo-O, O’-phenyl-3, 6, 9-trioxaunde- cane 1, 10
dioate]:
Synthesis of ionophore (R1) has been carried out in two steps (Scheme 1):
Step I: Preparation of bis (3, 6, 9-trioxuandecandioic) acid chloride. A mixture (1:5) v/v of bis (3, 6, 9– trioxaundecandioic) acid (20 mL) and thionyl chloride (100 mL) was refluxed at 80°C for 6 h after refluxing, the product was distilled off at 70°C and characterized by TLC and spectral analysis.
Step II: 4(4’-nitrophenyl azo)-resorcinol 5.18 g (.019 mol) was dissolved in DMSO (25 mL) and NaOH 1.6 g (0.04 mol) in 20 mL water. The reaction mixture was stirred for 30 min. and bis-(3, 6, 9-trioxaundecandioic) acid chloride (5 mL) was added. The reaction mixture was refluxed at 80°C for 12 h. The product was neutralized by 4-5 drops of HCl (1M) and washed with deionised water. After this the product was vacuum filtered, recrystallized in methanol and characterized by mp, TLC and spectral analysis. Red solid (amorphous), m.p: 250°C, yield: 4.0 g (65%). FAB Mass: m/z 443 (molecular ion peak) calculated for C30H28N3O11; M.Wt: (445).
+
HO C O
O O O C O
OH Cl C O
O O O C O
Cl
SOCl2
N N OH
OH Cl C
O
O O O C O
Cl DMSO
NaOH
O O O C
C O O O
O N N
R1 O2N
O2N
Scheme 1:Synthesis of ionophore (R1)
Preparation of Ionophore (R2); bis [4,4’-nitrophenyl-azo-napthyl (2,2’-dioxydiethyl ether)]
39
Brown solid (amorphous), m.p: 270°C, Yield: 3.8 g (67%), FAB Mass: m/z 655(molecular ion peak) calculated for C30H28N3O11; M.Wt: (656).
O2N
O2N N N +
Cl O Cl
DMSO NaOH OH
N N
O
N N O
O
R2
NO2
Scheme 2: Preparation of ionophore (R2)
Synthesis of Non-cyclic Ionophores (R3-R5)
Preparation of ionophore R3; 1, 8-bis (2-naphthyloxy)-3, 6-di-oxaoctane:
In 150 mL of boiling 1-butanol solution naphthol 8.64 g (.06 mol), KOH 3.36 g (0.6 mol) and bis (1, 2-chloro ethoxy ethane) 4.68 mL (.030 mol) were added one by one. The reaction mixture was refluxed at 120oC for 20 h. After this fine precipitates (KCl) formed were filtered off, the solution was evaporated to dryness under vaccum. The residue was taken up in chloroform and washed several times with dilute NaOH and deionized water. The organic phase was separated, dried over MgSO4 and concentrated by
distillation under vaccum (Scheme 3).
m.p: 54oC; Brown solid; yield: 6.5 g (50%), FAB Mass: m/z 402(molecular ion peak) calculated for (C26H26O4) M.Wt; (402).
Synthesis of ionophore R4 and R5 was done by refluxing 1,11 dichloro-3,6,9 trioxaundecane 4.74 mL (0.29
mol) and 2,2'-dichloro diethyl ether 3.8 mL (0.02 mol) as above procedure.
OH
Cl O n Cl
+
O O n O
KOH 120oC
n=4 (R4)
n=3 (R3) n=2 (R5)
Scheme 3:Synthesis of ionophore R3
Ionophore R4; 1, 11-bis (2-naphthyloxy)- 3,6,9-trioxaundecane:
m.p: 80oC; White shiny crystals; yield: 5 g (41.6%), FAB Mass: m/z 446 (molecular ion peak) calculated for (C28H30O5) M. Wt.; (446).
Ionophore R5; 1, 5-bis (2-naphthyloxy) -3-oxapentane:
m.p: 132oC; White crystalline solid; yield: 4.0 g (33.4%), FAB Mass: m/z 356 (molecular ion peak) calculated for (C24H26O3) M. Wt.; (356).
Isolation Studies
________________________________________________________________________
40
analysis (C, H, N) and metal estimation were done by using flame photometer (Li+, Na+, K+, Ca++) and spectrophotometer (Mg++).
m
Total conc. of cation in organic phase
D
Total conc. of cation in aqueous phase
Extraction Studies: Liquid Liquid Extraction
In the liquid -liquid extraction [13]. studies, 10 ml of 1.0×10⁻² M aqueous metal salt solution was vigorously stirred with 10 ml of 1.0×10⁻⁴ M ionophore solution in nitrobenzene in a 50ml beaker using magnetic stirrer, the beaker was covered. The amount of cation in aqueous phase was initially determined by flame photometer. After 4 h of stirring the mixture was allowed to stand for 5 minutes for the separation of two phases. The depleted aqueous solution was removed and analyzed for metal content by flame photometer. (Li+, Na+, K+, Ca++) and spectrophotometer (Mg++). The amount of metal ion extracted by ionophore was found by measuring its difference in aqueous phase before and after extraction [14,15].
RESULTS AND DISCUSSION
By simple, cheap and convenient methods the ionophores were synthesized. The physical properties, analytical data of ionophores (R1-R5) and their complexes are given in Tables 1-3. The complexes were
[image:4.612.89.531.360.594.2]isolated in methanol and mixture of methanol + ethyl acetate and characterized by m.p. and spectral analysis. Metal estimation and elemental analysis indicates that the isolated complexes are of 1:1 stoichiometry.
Table 1: Physical characteristics and analytical data of isolated complexes of metal salts with ionophores (R1-R5)
Metal
Salt IP M:L Solvent m.p.
°C Yield
(%)
Molecular Formula
Elemental Analysis (%) C H N M
NaPic R1 1:01 MeOH 273 42 C26H21O16N9Na
F 70 3.5 28.01 4.3
C 70.11 4.7 28.31 5.4
Ca(Pic)2 R1 1:01 MeOH 225 39 C32H23O23N9Ca
F 86.25 4.92 27.5 8
C 86.29 5.16 28.51 8.9
LiPic R2 1:01 MeOH 152 48.23 C44H32O21N12Li F 78.02 4.04 25.2 3.62
C 80.36 4.8 5.57 3.65
NaPic R3 1:01 Ethyl acetate+ MeOH 68 45 C32H28O11N3Na
F 57.8 3.72 7.2 3.3
C 58.2 4.2 6.4 3.5
KPic R3 1:01 Ethyl acetate+ MeOH 70 47 C32H28O11N3K
F 57.4 4 6.4 5
C 57.3 4.1 6.2 5.8
Ca(Pic)2 R3 1:01 Ethyl acetate + MeOH 72 40 C38H30O18N6Ca F 51 3 9 4.16
C 57.73 3.3 9.3 0.18
NaPic R4 1:01 Ethyl acetate+ MeOH 41 42.2 C34H32O12N3Na
F 58.5 4.5 6.02 3.2
C 50.8 4.6 6.9 3.2
KPic R4 1:01 Ethyl acetate+ MeOH 45 48 C34H33O12N3 K
F 57.2 4.4 5.8 5.4
C 57.8 4.6 5.9 5.2
Ca(Pic)2 R4 1:01 Ethyl acetate+ MeOH 60 44.2 C40H34O26N6Ca
F 50.8 3.8 8 .20 4
C 50.8 3.6 8.9 4.2
Mg(Pic)2 R5 1:01
MeOH
85 41 C36H28O13N6Mg
F 57.3 3 7.2 3.3
C 57 3.7 7.4 3.2
The isolation results reveals that ionophore R1 complexes with sodium and calcium picrates while the
ionophore R2 complexes with lithium picrate (Table 1). These results are supported by liquid –liquid
extraction in the liquid -liquid study Ionophore R1 extracts sodium and calcium at greater extent while transport less. The IR spectra of ionophores R1 and R2 are shown in Table 2. The characteristic IR peaks of
ionophore R1 at 3074 cm -1
41
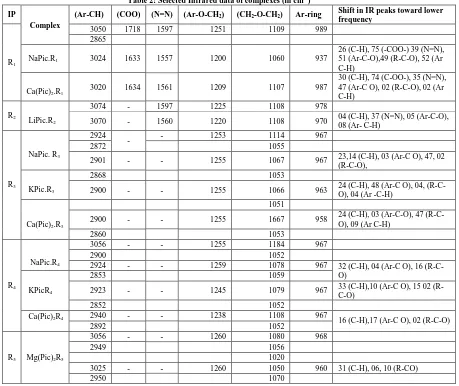
Table 2: Selected Infrared data of complexes (in cm-1)
IP
Complex
(Ar-CH) (COO) (N=N) (Ar-O-CH2) (CH2-O-CH2) Ar-ring Shift in IR peaks toward lower frequency
R1
3050 1718 1597 1251 1109 989
2865
NaPic.R1 3024 1633 1557 1200 1060 937
26 (C-H), 75 (-COO-) 39 (N=N), 51 (Ar-C-O),49 (R-C-O), 52 (Ar C-H)
Ca(Pic)2.R1 3020 1634 1561 1209 1107 987
30 (C-H), 74 (C-OO-), 35 (N=N), 47 (Ar-C O), 02 (R-C-O), 02 (Ar C-H)
R2
LiPic.R2
3074 - 1597 1225 1108 978
3070 - 1560 1220 1108 970 04 (C-H), 37 (N=N), 05 (Ar-C-O),
08 (Ar- C-H)
R3
NaPic. R3
2924
- - 1253 1114 967
2872 1055
2901 - - 1255 1067 967 23,14 (C-H), 03 (Ar-C O), 47, 02
(R-C-O),
KPic.R3
2868 1053
2900 - - 1255 1066 963 24 (C-H), 48 (Ar-C O), 04,
(R-C-O), 04 (Ar -C-H)
Ca(Pic)2.R3
1051
2900 - - 1255 1667 958 24 (C-H), 03 (Ar-C-O), 47
(R-C-O), 09 (Ar C-H)
2860 1053
R4
NaPic.R4
3056 - - 1255 1184 967
2900 1052
2924 - - 1259 1078 967 32 (C-H), 04 (Ar-C O), 16
(R-C-O)
KPicR4
2853 1059
2923 - - 1245 1079 967 33 (C-H),10 (Ar-C O), 15 02
(R-C-O)
2852 1052
Ca(Pic)2R4
2940 - - 1238 1108 967
16 (C-H),17 (Ar-C O), 02 (R-C-O)
2892 1052
R5 Mg(Pic)2R5
3056 - - 1260 1080 968
2949 1056
1020
3025 - - 1260 1050 960 31 (C-H), 06, 10 (R-CO)
2950 1070
It is observed that IR peaks of R1 at 1596 cm-1 (N=N), 1251 cm-1 (Ar-O-CH2) and 1109 cm-1 (CH2-O-CH2)
are shifted to 1557 cm-1, 1200 cm-1, 1060 cm-1 in sodium picrate-R1 and 1560 cm-1, 1209 cm-1, 1107 cm-1 in
calcium picrate-R1 complex. The shift (∆ν) of IR peaks towards lower frequency in NaPic-R1 complex due
to azo group (N=N), aromatic C-O (Ar-O-CH2) and aliphatic C-O stretching (CH2-O-CH2) is 39 cm -1
, 51 cm-1 and 49 cm-1 and in CaPic-R1 complex is 35 cm-1 (N=N), 42 cm-1 (Ar-O-CH2), 02 cm-1 (CH2-O-CH2).
From the results, it is found that the extent of shifting of IR peaks towards lower frequency is greater in NaPic-R1 complex, which indicates greater interaction of ionophore R1 with sodium picrate. The selectivity
of ionophore R1 can be explained by cavity fit concept [10], it may be suggested that the ionic radius of Na+
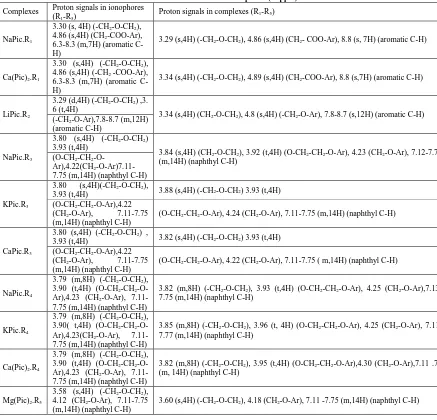
(0.97Å) and Ca++ (0.98 Å) matches with the cavity size of R1. The results are further supported by 1H NMR
spectral data (Table 3). The proton signals in ionophore R1 at δ 3.30 (CH2-O-CH2), δ 4.86 (CH2-COO-Ar),
6.3- 8.3 (Aromatic C-H) shifted slightly downfield in the metal complexes, which shows non covalent interaction of Na+ and Ca++ ions with ionophore R1.
Ionophore R2 complexes with lithium picrate. The characteristic IR peaks of ionophore R2 at 3024 cm-1
(C-H), 1597 cm-1 (N=N), 1225 cm-1 (Ar-O-CH2) and 1108 cm -1
(CH2-O-CH2) are shifted towards lower
frequency in metal complexes. Due to short chain length (di-ethylene glycol oxygen donor binding sites) ionophore R2 complexes with small size and high charge density lithium ion, in the same trend ionophore
R2 extract lithium at greater extent. The results are further supported by 1H NMR spectral data (Table 3).
The proton signals in ionophore R2 at δ 3.29 (CH2-O-CH2), δ 3.60 (CH2-O-Ar), 7.3-7.8 (Aromatic C-H) are
________________________________________________________________________
[image:6.612.92.529.90.510.2]42
Table 3: Selected 1H NMR of complexes (in ppm)
Complexes Proton signals in ionophores
(R1-R5)
Proton signals in complexes (R1-R5)
NaPic.R1
3.30 (s, 4H) (-CH2-O-CH2),
4.86 (s,4H) (CH2-COO-Ar),
6.3-8.3 (m,7H) (aromatic C-H)
3.29 (s,4H) (-CH2-O-CH2), 4.86 (s,4H) (CH2- COO-Ar), 8.8 (s, 7H) (aromatic C-H)
Ca(Pic)2.R1
3.30 (s,4H) (-CH2-O-CH2),
4.86 (s,4H) (-CH2 -COO-Ar),
6.3-8.3 (m,7H) (aromatic C-H)
3.34 (s,4H) (-CH2-O-CH2), 4.89 (s,4H) (CH2-COO-Ar), 8.8 (s,7H) (aromatic C-H)
LiPic.R2
3.29 (d,4H) (-CH2-O-CH2) ,3.
6 (t,4H)
3.34 (s,4H) (CH2-O-CH2), 4.8 (s,4H) (-CH2-O-Ar), 7.8-8.7 (s,12H) (aromatic C-H)
(-CH2-O-Ar),7.8-8.7 (m,12H)
(aromatic C-H)
NaPic.R3
3.80 (s,4H) (-CH2-O-CH2)
3.93 (t,4H)
3.84 (s,4H) (CH2-O-CH2), 3.92 (t,4H) (O-CH2-CH2-O-Ar), 4.23 (CH2-O-Ar), 7.12-7.75
(m,14H) (naphthyl C-H)
(O-CH2-CH2
-O-Ar),4.22(CH2
-O-Ar)7.11-7.75 (m,14H) (naphthyl C-H)
KPic.R3
3.80 (s,4H)(-CH2-O-CH2),
3.93 (t,4H) 3.88 (s,4H) (-CH2-O-CH2) 3.93 (t,4H)
(O-CH2-CH2-O-Ar),4.22
(CH2-O-Ar), 7.11-7.75
(m,14H) (naphthyl C-H)
(O-CH2-CH2-O-Ar), 4.24 (CH2-O-Ar), 7.11-7.75 (m,14H) (naphthyl C-H)
CaPic.R3
3.80 (s,4H) (-CH2-O-CH2) ,
3.93 (t,4H) 3.82 (s,4H) (-CH2-O-CH2) 3.93 (t,4H)
(O-CH2-CH2-O-Ar),4.22
(CH2-O-Ar), 7.11-7.75
(m,14H) (naphthyl C-H)
(O-CH2-CH2-O-Ar), 4.22 (CH2-O-Ar), 7.11-7.75 ( m,14H) (naphthyl C-H)
NaPic.R4
3.79 (m,8H) (-CH2-O-CH2),
3.90 (t,4H) (O-CH2-CH2
-O-Ar),4.23 (CH2-O-Ar),
7.11-7.75 (m,14H) (naphthyl C-H)
3.82 (m,8H) (-CH2-O-CH2), 3.93 (t,4H) (O-CH2-CH2-O-Ar), 4.25 (CH2
-O-Ar),7.13-7.75 (m,14H) (naphthyl C-H)
KPic.R4
3.79 (m,8H) (-CH2-O-CH2),
3.90( t,4H) (O-CH2-CH2
-O-Ar),4.23(CH2-O-Ar),
7.11-7.75 (m,14H) (naphthyl C-H)
3.85 (m,8H) (-CH2-O-CH2), 3.96 (t, 4H) (O-CH2-CH2-O-Ar), 4.25 (CH2-O-Ar),
7.11-7.77 (m,14H) (naphthyl C-H)
Ca(Pic)2.R4
3.79 (m,8H) (-CH2-O-CH2),
3.90 (t,4H) (O-CH2-CH2
-O-Ar),4.23 (CH2-O-Ar),
7.11-7.75 (m,14H) (naphthyl C-H)
3.82 (m,8H) (-CH2-O-CH2), 3.95 (t,4H) (O-CH2-CH2-O-Ar),4.30 (CH2-O-Ar),7.11 .75
(m, 14H) (naphthyl C-H)
Mg(Pic)2.R5
3.58 (s,4H) (-CH2-O-CH2),
4.12 (CH2-O-Ar), 7.11-7.75
(m,14H) (naphthyl C-H)
3.60 (s,4H) (-CH2-O-CH2), 4.18 (CH2-O-Ar), 7.11 -7.75 (m,14H) (naphthyl C-H)
We have isolated complexes of non-cyclic ionophore R3, R4 with Na+, K+, Ca++ and R5 with Mg++(Metal
Picrates). Ionophores R3, R4 and R5 have rigid naphthyl end group and varying tri, tetra and diethylene
glycol chain length respectively (Scheme 3). When these results were compared with liquid –liquid ectravtionn Ionophores R3, R4 and R5 extracts potassium at greater extent (Table 4) The results shown in
Table 1 indicate that complexing tendency is enhanced in ionophore R3 and R4. From IR spectra of
complexes, it is observed that characteristic IR peaks of ionophores due to C-H stretching, Ar-O-CH2 and
CH2 –O-CH2 are shifted towards lower frequency in complexes (Table 2).
The interaction of these ionophores (R3-R5) with metal salts is further supported by 1H NMR spectral data.
The proton signals in ionophores (R3-R5) at 3.52 -3.80 (CH2-O-CH2), 3.90-3.93 (-O-CH2-O-CH2 -Ar),
4.12-4.22 (O-CH2-Ar), 7.11 -7.75 (naphthyl C-H) are found to be shifted slightly downfield in the
complexes (Table 2).
On the basis of IR and 1H NMR spectral data, it is suggested that during complexation ionophores (R3-R5)
adopt pseudo cavity conformation. Ionophore R3 and R4 has four and five oxygen donor binding sites. Due
to the flexible chain length ionophores R3 and R4 complex with Na+, K+ and Ca2+ metal ions. Ionophore R5
43
conformation of non-cyclic ionophores (R3-R5) is the driving force for the metal ion complexation and due
[image:7.612.160.458.136.213.2]to the increment in chain length from diethylene to tetra ethylene, the selectivity changes from small size cation to larger size cations [6].
Table 4: Amount of metal cations extracted into an organic phase in 4 h by ionophores (R1–R5) in chloroform Metal salt
concentration = 1×10⁻² M; ionophore concentration = 1×10⁻³ M Metal salts Amount of cations extracted (in ppm) by ionophores
R1 R2 R3 R4 R5
LiPic 1.6 11 — 5.3 5.8
NaPic 12 2.7 16 4.2 1.8
KPic 7 4 95 26 20.5
Ca(Pic)2 15 5 — 12 7.5
Mg(Pic)2 — — 4 6 —
CONCLUSION
We have synthesized different end group bearing ionophores; azo benzene bridged ionophores (R1 and R2)
and 2-naphthol derived podands (R3-R5). From the results, it was found that the complexing abilities of
ionophores (R1-R5) have been affected on varying end groups and chain length. Ionophore R1 is selective
for Na+ and Ca++ As like Nitrophenyl azo-15-crown-5, ionophore R1 (Scheme I) may be used as extraction
colorimetric regent for the determination of these ions while R2 is specific for Li+. Ionophore R3 and R4
having different chain length adopt pseudocyclic conformation and complexes with all metal cations and selectivity is lost while due to short chain length R5 is specific for Mg++ions. As the supramolecular
interaction between host and guest is temporary, non-covalent and required less energy to break interaction the selectivity / specificity of these ionophores will be utilized in construction of ion selective electrodes and as metal ion indicators.
ACKNOWLEDGEMENTS
The authors would like to thank Madhyapradesh Council of Science and Technology Bhopal, India for financial assistance for the project no. 1082/CST/R&D/2012 and support of SAIF Punjab for spectral analysis is also acknowledged.
REFERENCES
[1] CJ Pedersen. J Amer Chem Soc. 1967, 89, 7017-7036.
[2] JM Lehn. Supramolecular Chemistry: Concepts and Perspectives, VCH, Weinheim, Germany, 1995.
[3] R Izatt; GA Clark; JS Bradshaw; JD Lamb; JJ Christansen. J Sep Purif Methods. 1986, 15(21), 24.
[4] H Nakamura; H Nishida; M Takagi; K Ueno. Anal Chem Acta. 1982, 139, 219–227. [5] B Tummler; G Maass; F Vogtle; E Weber. J Am Chem Soc. 1979, 101, 2588–2599. [6] J Tomar; A Awasthy; U Sharma. Desalination. 2008, 232, 102–109.
[7] J Tomar; N Joshi; A Awasthy; U Sharma. Emerging Trends in Separation Science and Technology. 2008.
[8] A Awasthy; M Bhatanagar; N Joshi; U Sharma. Ind J Chem. 2006, 45A, 1170–1172. [9] J Tomar; M Bhatanagar; U Sharma. Proc Natl Acad Sci. 2007, 76(1), 1–4.
[10] J Tomar; U Sharma. J Main Group Metal Chem. 2006, 29(3), 119–126. [11] D Mishra; U Sharma. Ind J Chem. 1996, 3, 245–249.
[12] A Awasthy; M Bhatanagar; J Tomar; U Sharma. J Bioinorg Chem Appl. 2006, 1–4. [13] D Mishra; U Sharma. J Main Group Metal Chem. 1997, 20(12), 761–765.
[14] D Mishra; U Sharma. Sep Purif Technol. 2002, 27(1), 51–57.