FORMULATION AND EVALUATION OF COLON TARGETED DRUG DELIVERY SYSTEM
CONTAINING ANTI DIABETIC AGENT
1*
Teelavath Vijayakumari,
2
Ravindranath
1
Department of Pharmaceutics, KGR Institute of Technology and Management, Rampally, Keesara,
2
Department of Pharmacy, University College of Technology,
ARTICLE INFO ABSTRACT
The main aim of the present Investigation was to develop colon targeted matrix tablets of Glipizide using various concentrations of selected polymers are Hydroxy propyl methyl cellulos cellulose and Guar gum. Tablets w
compression and post
accelerated stability studies are performed according to ICH guidelines temperature of 40
relative humidity of 75%±5% RH to study any physical changes and chemical decomposition of the drug, in this concern no formulatio
drugs, polymers and excipients were
drug was compatible with polymers and all excipients. Interaction between drug and optimized formulations were acertain by DSC Thermographs
interaction. Dissolution studies were performed for 12 hours in 1. 2 pH, 7.4 pH, 6.8 in phosphate buffer at the temperature of 37±0.5
fitted to various mathematical kinetic models and the drug release followed mixed order and Higuchi’s model. To study release mechanism of the drug from matrices the data were fitted to Koresmeyer
study showed that drug increasing the concentration of polymers resulted in a reduction in the release rate of the drug. A formulation containing combination of polymers showed that the dru
profile for Glipizide about 38.72% after 12 hrs, 40.66% after 12 hrs, 45.45% after 12 hrs for all formulations, this is an indicative of the retardation of drug release when polymer combination was changed.
Copyright © 2015 TeelavathVijayakumari et al. This
unrestricted use, distribution, and reproduction in any medium, provided the original work is properly cited.
INTRODUCTION
An appropriately designed controlled release drug delivery system can be major advances to solve problems with targeting drugs to a specific tissue or organ and controlling the rate of drug delivery to the target tissue or organ. The matrix tablets are an interesting option to develop an oral controlled release formulation. The present investigation mainly focuses on oral controlled release dosage forms and which type of polymers is suitable to formulate matrix tablets. Conventional dosage form releases the drug immediately and showing large distribution to all organs, so there is need to target the drug to specific sig with specific concentration. Colon targeted matrix tablet is one control release dosage form which release the drug in a continuous manner to the colon. The release of drug takes by both dissolution as well as diffusion control mechanism to maintain the plasma concentration of the drug
*Corresponding author: Teelavath Vijayakumari,
Department of Pharmaceutics, KGR Institute of Technology and Management, Rampally, Keesara, R.R Dist-501301, Telangana, India.
ISSN: 0975-833X
Article History:
Received 20th October, 2014
Received in revised form 21st November, 2014
Accepted 02nd December, 2014
Published online 31st January,2015
Key words:
Colon targeted drug, Glipizide matrix tablets, Glipizide, HPMC, Guar gum, Ethyl Cellulose.
RESEARCH ARTICLE
FORMULATION AND EVALUATION OF COLON TARGETED DRUG DELIVERY SYSTEM
CONTAINING ANTI DIABETIC AGENT
Vijayakumari,
1Mangilal, T.,
2Shyamsunder, R.,
2Jayaprakash
Ravindranath, A. and
2Rao Patnaik, K. S. K.
Department of Pharmaceutics, KGR Institute of Technology and Management, Rampally, Keesara,
R.R Dist-501301, Telangana, India
, University College of Technology, Osmania University, Hyderabad, Telangana, India
ABSTRACT
The main aim of the present Investigation was to develop colon targeted matrix tablets of Glipizide using various concentrations of selected polymers are Hydroxy propyl methyl cellulos cellulose and Guar gum. Tablets were prepared by direct compression method and both pre compression and post- compression parameters for all batches show
accelerated stability studies are performed according to ICH guidelines temperature of 40
relative humidity of 75%±5% RH to study any physical changes and chemical decomposition of the drug, in this concern no formulation shown any physical or chemical changes. The compatibility of drugs, polymers and excipients were studied by FT-IR Spectroscopy
drug was compatible with polymers and all excipients. Interaction between drug and optimized ormulations were acertain by DSC Thermographs and the
interaction. Dissolution studies were performed for 12 hours in 1. 2 pH, 7.4 pH, 6.8 in phosphate buffer at the temperature of 37±0.50C at 100rpm. The
fitted to various mathematical kinetic models and the drug release followed mixed order and Higuchi’s model. To study release mechanism of the drug from matrices the data were fitted to Koresmeyer-Peppas model. In –vitro release profile of Glipizide from all polymers which are used in study showed that drug increasing the concentration of polymers resulted in a reduction in the release rate of the drug. A formulation containing combination of polymers showed that the dru
profile for Glipizide about 38.72% after 12 hrs, 40.66% after 12 hrs, 45.45% after 12 hrs for all formulations, this is an indicative of the retardation of drug release when polymer combination was changed.
This is an open access article distributed under the Creative Commons Att use, distribution, and reproduction in any medium, provided the original work is properly cited.
An appropriately designed controlled release drug delivery system can be major advances to solve problems with targeting specific tissue or organ and controlling the rate of drug delivery to the target tissue or organ. The matrix tablets are an interesting option to develop an oral controlled release formulation. The present investigation mainly focuses on oral elease dosage forms and which type of polymers is suitable to formulate matrix tablets. Conventional dosage form releases the drug immediately and showing large distribution to all organs, so there is need to target the drug to specific sign concentration. Colon targeted matrix tablet is one control release dosage form which release the drug in a e release of drug takes by dissolution as well as diffusion control mechanism to
tion of the drug
Department of Pharmaceutics, KGR Institute of Technology and Management, 501301, Telangana, India.
for an extended period of time with minimized local or systemic unwanted effects (Vinod Dube
delivery of drugs to the colon for systemic action or a local effect is valuable in a variety of situations; these include treatment of the topical diseases these are Chron’s disease, ulcerative colitis and infectious disease for colon, irritable colon syndrome, colon cancer and potentially for the oral delivery of peptides. Colon targeting glipizide
can be reached by different approac
formulation system, for which the drug release is control by different pH conditions, transit time and microbial flora
(Poonam Kushwaha et al., 2010: Dinesh Kaushik
Nitin Saigal et al., 2009). Glipizide is an antidiabetic ag
one of the most commonly prescribed drug for the treatment of patients with type II diabetes mellitus. In spite of its favorable clinical response in chronic therapy with Glipizide, suffers from certain specific problems of high dose (1.5
International Journal of Current Research
Vol. 7, Issue, 01, pp.12057-12073, January, 2015
INTERNATIONAL
FORMULATION AND EVALUATION OF COLON TARGETED DRUG DELIVERY SYSTEM
Jayaprakash, D.,
Department of Pharmaceutics, KGR Institute of Technology and Management, Rampally, Keesara,
Osmania University, Hyderabad, Telangana, India
The main aim of the present Investigation was to develop colon targeted matrix tablets of Glipizide using various concentrations of selected polymers are Hydroxy propyl methyl cellulose, Ethyl prepared by direct compression method and both pre-compression parameters for all batches showed the suitable ranges. Short term accelerated stability studies are performed according to ICH guidelines temperature of 400±20 and
relative humidity of 75%±5% RH to study any physical changes and chemical decomposition of the n shown any physical or chemical changes. The compatibility of IR Spectroscopy and the results showed that the drug was compatible with polymers and all excipients. Interaction between drug and optimized and the results showed that there is no interaction. Dissolution studies were performed for 12 hours in 1. 2 pH, 7.4 pH, 6.8 pH, respectively C at 100rpm. The dissolution data so obtained was fitted to various mathematical kinetic models and the drug release followed mixed order and Higuchi’s model. To study release mechanism of the drug from matrices the data were fitted to release profile of Glipizide from all polymers which are used in study showed that drug increasing the concentration of polymers resulted in a reduction in the release rate of the drug. A formulation containing combination of polymers showed that the drug release profile for Glipizide about 38.72% after 12 hrs, 40.66% after 12 hrs, 45.45% after 12 hrs for all formulations, this is an indicative of the retardation of drug release when polymer combination was
is an open access article distributed under the Creative Commons Attribution License, which permits
an extended period of time with minimized local or
(Vinod Dube et al., 2011). The
delivery of drugs to the colon for systemic action or a local effect is valuable in a variety of situations; these include diseases these are Chron’s disease, ulcerative colitis and infectious disease for colon, irritable colon syndrome, colon cancer and potentially for the oral
targeting glipizide via oral route
can be reached by different approaches and different formulation system, for which the drug release is control by different pH conditions, transit time and microbial flora
., 2010: Dinesh Kaushik et al., 2009:
Glipizide is an antidiabetic agent and one of the most commonly prescribed drug for the treatment of patients with type II diabetes mellitus. In spite of its favorable clinical response in chronic therapy with Glipizide, suffers from certain specific problems of high dose (1.5-2.0 g/day),
The situation is complicated further with a decrease in
absorption of the drug with food that delays tmax up to 40 mins,
(Tapan Kumar et al., 2007: Margret Chandira et al., 2010:
Basavaraj et al., 2011). The primary objective of present
investigation is to develop control release matrix tablets of Glipizide to improve bioavailability, to prevent changes of concentration of the drug in plasma, to reduce the dose dumping and to examine the effects of combination of
polymers on in-vitro drug release. Glipizide matrix tablets
were prepared by using polymers such as Guar gum, Ethyl cellulose, Hydroxy propyl methyl cellulose are used in combination to study the drug release kinetics and find out the
effects of the polymer with the Glipizide (Bagyalakshmi et al., 2011; Kamlesh et al., 2011; Akash Yadhav et al., 2011)
MATERIALS AND METHODS
Glipizide was a gift sample from Sun Pharmaceutical Industries Ltd, India. Hydroxy propyl methyl cellulos, Ethyl
cellulose, Guar gum from Loba Chemie, India,
microcrystalline cellulose, magnesium stearate and talc from S.D. Fine Chem. Ltd, Mumbai, India. Other materials and
solvents were used analytical grade. In-vitro analysis of the
prepared tablets was carried out as per the requirements of official pharmacopoeia for matrix tablets.
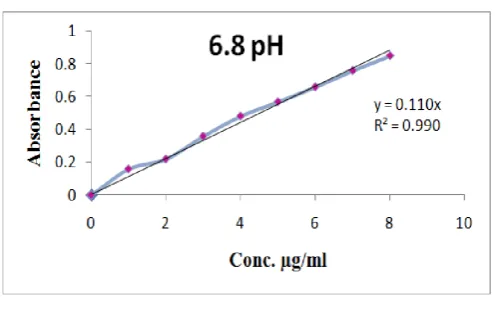
Standard Curve for Glipizide 100 mg of Glipizide was accurately weighed and dissolved in 100 ml of distilled water to prepare the first stock solution that is pH 1.2. 1ml of above solution was taken and diluted to 100 ml with the same solvent to prepare second stock solution. The aliquot amount of stock solution II was further diluted with first stock solution to get 1, 2 , 3, 4, 5, 6µgs of drug per ml of the final solution. After that the absorbance was measured with a UV spectrophotometer at 233nm against pH 1.2 as a blank. The same procedure was repeated by phosphate buffer pH 7.4 and 6.8. The absorbance obtained were shown in Tables 2-4. Calibration curve was plotted and shown in Figures 1-3 respectively.
Fig. 1. Calibration curve of glipizide in 1.2 pH buffer
[image:2.595.310.558.244.399.2]Fig. 2.Calibration curve of glipizide in 7.4 pH buffer
Fig. 3.Calibration curve of glipizide in 6.8 pH buffer
Preparation of Glipizide succinate
Glipizide was dissolved in methanol and water of ratio 5:1 with constant stirring. A solution of succinic acid in ethanol was added for one hour drop wise under a nitrogen atmosphere temperature at 20ºC. Crystallization of salt commenced shortly after the addition of the succinic acid solution. The crystals was filtered off, washed with ethanol and dried under vacuum to form the Glipizide succinate (2:1). The obtained salt was
free flowing with a melting point of 205-2080C (Sanket D
Gandhi et al., 2010).
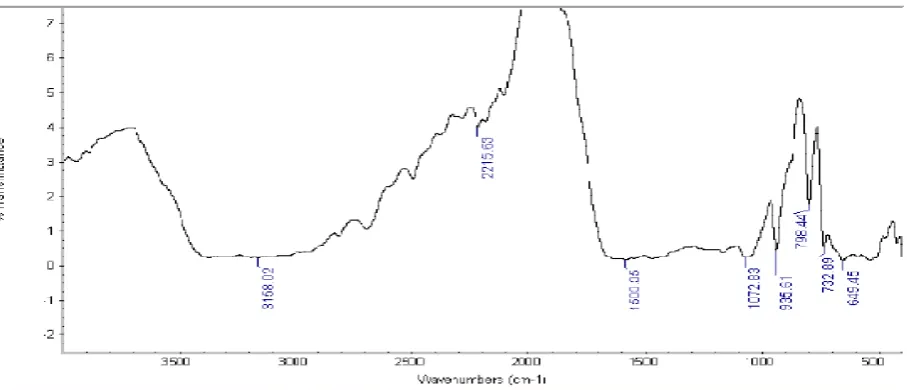
FTIR studies
The I.R. spectrum of Glipizide, Polymers and optimized formulations were recorded individually. The disc was made using 1 mg of each samples in 100 mg potassium bromide
individually and the spectras were recorded between 4000 cm-1
– 400 cm-1 using Shimadzu FTIR Spectrophotometer and
results were shown in Figures 4 –12 (Pavia et al., 2002)
Differential Scanning Calorimetry
DSC Thermographs of Glipizide and optimized formulations
were recorded individually between 30.0oC to 300.0oC at the
rate of 20.0oC per minute under the environment of nitrogen
Fig. 4 FT-IR spectra of Glipizide
[image:3.595.54.526.62.545.2]Fig. 5. FT-IR spectra of ethyl cellulose
[image:3.595.62.524.364.757.2]Fig. 7. FT-IR spectra of hpmc
Fig. 8. FT-IR spectra of glipizide with hpmc
Fig. 10. FT-IR of glipizide with guar gum
Fig. 11. FT-IR spectra of succinic acid
Preparation of Glipizide Matrix Tablets
Glipizide and all Excipients was selected for final weights of formulation (f1-f12) for the compression of matrix tablets as shown in Table 1
Evaluation for pre-compression parameters (Aulton, 2002)
Angle of repose The static angle of repose was measured according to the fixed funnel and freestanding cone method. A funnel was clamped with its tip 2 cm above a graph paper placed on a flat horizontal surface. The granules were carefully poured through the funnel until the apex of the cone thus formed just reached the tip of the funnel. The mean diameters of the base of the powder cones were determined and the tangent of the angle of repose was calculated using the following equation:
tan = h / r, = tan-1[h /r]
Where
= Angle of repose h = Height in cm r = Radius.
Five measurements were made for each sample and results were shown in Table 5.
Bulk Density (Db) It was measured by pouring the weighed
powder into a measuring cylinder and the volume was calculated by using following equation and the results were depicted in Table 6:
Db = (Mass powder)/Bulk volume of the powder
Tapped density (Dt) The tapped volume was measured by
tapping the powder to constant volume and calculated by using following equation and the results were depicted in Table 6:
Dt = (Mass of powder)/(Tapped volume of the powder)
Carr’s index It helps in measuring the force required to break the friction between the particles and the hopper and it is calculated by using following formula and results were shown in Table 6:
Carr’s index= (Tapped density-Bulk density)/(Tapped de ensity) X100
[image:6.595.103.501.53.443.2]Hausner’s Ratio It reveals the flow property of the powder material. It is the ratio of tapped density to bulk density of the
Fig. 13. Themogram of drug glipizide
powder and measured by employing the following formula and results were depicted in Table 6.
Hausner ratio = Dt / Db
Where
Dt = Tapped density
Db = Bulk density
Preparation of Glipizide matrix tablets
Matrix tablets containing 500mg of Glipizide along with
various amounts of polymers and other excipients were prepared by direct compression technique. In this first step, the drug and ingredients with the exception of magnesium stearate were blended in a tubular mixer for 5 minutes and magnesium stearate was added. The desired amount of the blend was directly compressed into tablets using rotary tablet compression machine (Multi punch machine). Before compression, the surface of the die and punch were lubricated with magnesium stearate and all the preparations were stored in airtight container at room temperature for further studies.
Evaluation of glipizide matrix tablets
The matrix tablets prepared were evaluated for the following
parameters (Lachman et al., 1991)
Weight Variation Test 20 tablets of each formulation were weighed using an electronic balance and the test was performed according to the official method given in IP and results were shown in Table 6.
Hardness Hardness, which is now more appropriately called crushing strength is expressed usually as the load (force) required to crush a tablet placed between two jaws forcing each other, one of which moves towards the other. Tablet hardness usually affects drug dissolution and release and it may affect bioavailability. Hardness determinations are made during tablet production and are used to determine the need for pressure adjustment on tablet punching machine. If the tablet is too hard, it may not disintegrate in the required period of time to meet the dissolution specifications; if it is too soft, it may not be able to withstand the handling during subsequent processing such as coating or packaging and shipping operations. The force required to break the tablet is measured in kilograms and a crushing strength of 4Kg is usually
considered to be the minimum for satisfactory tablets. Twenty
tablets were randomly selected and each tablet was tested for hardness using Digital Hardness Tester results were as shown in Table 6.
Friability
20 tablets were weighed then placed in the friabilator chamber. The tablets were subjected to combined effect of abrasion and shocks by utilizing a plastic chamber that revolve at a speed of 25 rpm drop form a height of 6// per revolution for 4 minutes. The 20 tablets were then collected and cleaned with a brush and weighed. The percentage of weight loss was calculated using the following formula and the values are presented in Table 6.
%Loss = (weight before – weight after)/(weight before)X100
Drug Content
Standard solution 100 mg of pure Glipizide drug was dissolved in water in a volumetric flask and the volume was made up to 100ml mark with the same solvent and sonicated for 5 minutes.
Sample solution
20 tablets from each batch were randomly selected and were weighed accurately and then finely powdered. To a powder equivalent to 100mg of Glipizide about 70ml of water was added and dissolved with the aid of shaker for 15 minutes sufficient quantities of water was added to produce 100ml in a volumetric flask mixed well and filtered. To 1ml of the filtrate methanol was added to produce 100ml. The absorbance of the resulting solution was measured at the 233nm using blank in the reference cell.
In-vitro Dissolution studies
The prepared Glipizide matrix tablets were evaluated for their integrity in the physiological environment of the stomach and small intestine under conditions mimicking mouth to colon
transit. The water bath was thermo stated at 370C ± 0.50C. The
paddle was set to rotate at 100 rpm. At every 1 hour samples of 5ml were withdrawn from the dissolution medium and replaced with fresh medium to maintain the volume constant and maintain sink conditions and the sample solution was analyzed at 233nm by using double beam U.V-Visible spectrophotometer (SHIMADZU-1700). The amount of drug present in the samples was calculated with the help of
calibration curve constructed from standard (Indian
pharmacopoeia et al., 2010).
In-vitro release rates of glipizide matrix tablets
(Korsemeyer et al., 1983)
The results of in-vitro release profile obtained for all the
formulations were plotted in modes of data treated as follows and results were given in Figures 20-24:
Zero- order Kinetic model – Cumulative % drug released
versus Time.
First- order Kinetic model –Log cumulative % drug
remaining versus Time.
Higuchi’s model-Cumulative % drug released versus the
square root of time.
4.Korsmeyer equation/Peppa’s model-Log cumulative
percent drug release versus log time.
Stability studies
Fig. 15. Comparision of Cumulative% Release Vs Time Profile of Formulations F1, F2 And F3
Fig. 16. Comparision of cumulative% release vs time profile of formulations f4, f5 and f6
Fig. 17. Comparision of cumulative% release vs time profile of formulations f7, f8 and f9 0
10 20 30 40 50 60 70
0 200 400 600 800
%
C
D
R
time(min)
F1
F2
F3
0 10 20 30 40 50 60 70
0 200 400 600 800
%
C
D
R
time(min)
F4
F5
F6
0 10 20 30 40 50 60
0 200 400 600 800
%
C
D
R
Time (min)
F7
F8
[image:8.595.138.458.520.705.2]Fig. 18. Comparison of cumulative% release vs time profile of formulations f10, f11 and f12
Fig. 19. Comparision of cumulative% release vs time profile of formulations f1-f12
Fig. 20. Comparative zero order release profile of formulations (f1 to f12) 0
10 20 30 40 50
0 200 400 600 800
%
C
D
R
Time(min)
F10
F11
F12
0 10 20 30 40 50 60 70
0 100 200 300 400 500 600 700 800
%
C
D
R
time(min)
Series1
Series2
Series3
Series4
Series5
Series6
Series7
Series8
Series9
Series10
0 10 20 30 40 50 60 70 80
0 200 400 600 800
%
C
D
R
time(min)
Zero order
F1F2
F3
F4
F5
F6
F7
[image:9.595.116.481.523.734.2]Fig. 21. Comparative first order release profile of formulations (f1 to f12)
Fig. 22. Comparative higuchi release profile o formulations (f1 to f12)
Fig. 23. Comparative hixson crowel cube root release profile of formulation (f1to f12) 0
0.5 1 1.5 2
0 200 400 600 800
Lo
g
cu
m
u
la
ti
ve
%
d
ru
g
re
m
ai
n
Time(min)
F2
F3
F4
F5
F6
F7
F8
F9
0 10 20 30 40 50 60 70
0 5 10 15 20 25 30
%
C
D
R
√T(min)
Higuchi model
F1F2
F3
F4
F5
F6
F7
F8
F9
0 0.2 0.4 0.6 0.8 1 1.2 1.4 1.6 1.8 2
0 1 2 3 4
Lo
g
%
C
D
R
Log Time(min)
Korsmeyer Peppa’s model
F1F2
F3
F4
F5
F6
F7
F8
F9
[image:10.595.85.512.504.725.2]Fig. 24. Comparative korsmeyer
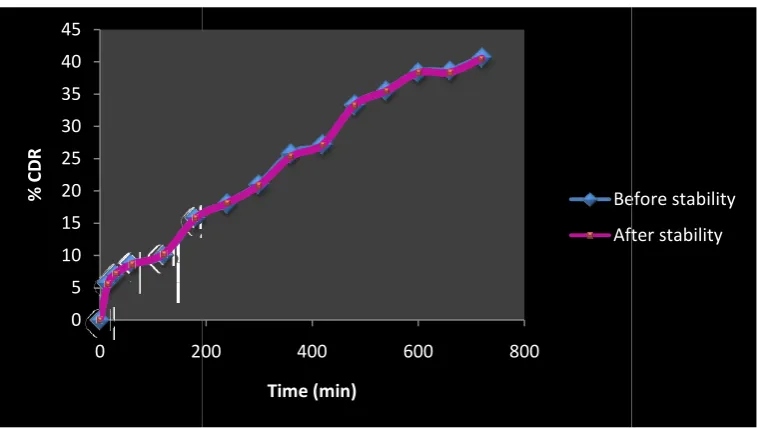
Fig. 25. Cumulative % drug release of f11 (stability studies) at room temperature
Fig. 26. Cumulative % drug release of f12 (stability studies) at room temperature 0
0.2 0.4 0.6 0.8 1 1.2 1.4 1.6 1.8 2
0
Lo
g
%
C
D
R
Korsmeyer Peppa’s model
0 5 10 15 20 25 30 35 40 45
0 200
%
C
D
R
0 5 10 15 20 25 30 35 40 45
0 200
%
C
D
R
Comparative korsmeyer-peppas release profile of formulation (f1 to f12)
Cumulative % drug release of f11 (stability studies) at room temperature
Cumulative % drug release of f12 (stability studies) at room temperature
1 2 3 4
Log Time(min)
Korsmeyer Peppa’s model
200 400 600 800
Time(min)
Before stability
After stability
200 400 600 800
Time (min)
Before stability
After stability
peppas release profile of formulation (f1 to f12)
Cumulative % drug release of f11 (stability studies) at room temperature
Cumulative % drug release of f12 (stability studies) at room temperature F1
F2
F3
F4
F5
F6
F7
F8
F9
Before stability
After stability
Before stability
[image:11.595.114.493.536.751.2]They were then stored at 25ºC and 60% RH, 30ºC and 65 RH, 40ºC and 75% RH for 3 months and evaluated for their permeation study and results were shown in
Figures 25-28 (ICH et al., 2008).
RESULTS AND DISCUSSION
Calibration Curve of Glipizide
The absorbance was measured in a UV spectrophotometer at 233 nm. The obtained absorbance were shown in Table 2 and graph plotted was shown in the Figure 1 and standard calibration curve with slope 0.081 and regression value R 0.999 was obtained. The absorbance was measured in a UV
spectrophotometer at 233 nm. The obtained absorbance were
shown in Table 3 and graph plotted was shown in the Figure 2. Standard calibration curve with slope 0.130 and regression
value R2 of 0.989 was obtained and all above results were
[image:12.595.117.483.59.267.2]comparable with standard data.
[image:12.595.114.484.299.509.2]Fig. 27. Cumulative % drug release of f11 (stability studies) AT 40ºC/75%RH
Fig. 28 Cumulative % drug release OF F12 (stability studies) AT 40ºC/75% RH
0 5 10 15 20 25 30 35 40 0 200 % C D R 0 5 10 15 20 25 30 35 40 45 0 200 % C D R
They were then stored at 25ºC and 60% RH, 30ºC and 65% RH, 40ºC and 75% RH for 3 months and evaluated for their permeation study and results were shown in Tables 9-11 and
spectrophotometer at The obtained absorbance were shown in Table 2 and graph plotted was shown in the Figure 1 and standard
calibration curve with slope 0.081 and regression value R2 of
0.999 was obtained. The absorbance was measured in a UV The obtained absorbance were shown in Table 3 and graph plotted was shown in the Figure 2. Standard calibration curve with slope 0.130 and regression of 0.989 was obtained and all above results were
Calibration Curve of Glipizide in 6.8 pH buffer
The absorbance was measured in a UV spectrophotometer at 233nm against 6.8 pH buffer. The absorbance so obtained were tabulated in Table 4 and Calibration curve was plotted and shown in Figure 3 and standard calibration curve with slope 0.110 and regression value R
comparable with standard data.
FT-IR spectrum and DSC Study
Drug and polymers were identified and peak values by performing FT shown in Figures 4-12. The FT
presence of any additional peaks for new functional groups, indicating that no chemical interaction between drug and polymers.
Cumulative % drug release of f11 (stability studies) AT 40ºC/75%RH
28 Cumulative % drug release OF F12 (stability studies) AT 40ºC/75% RH
200 400 600 800
Time(min)
Before stability
After stability
200 400 600 800
Time(min)
Before stability
After stability
Calibration Curve of Glipizide in 6.8 pH buffer
The absorbance was measured in a UV spectrophotometer at 233nm against 6.8 pH buffer. The absorbance so obtained were 4 and Calibration curve was plotted and 3 and standard calibration curve with slope
0.110 and regression value R2 of 0.991 was obtained were
comparable with standard data.
IR spectrum and DSC Study
Drug and polymers were identified and conformed from the rming FT-IR studies and results were
The FT-IR spectrum not shown the presence of any additional peaks for new functional groups, indicating that no chemical interaction between drug and
Cumulative % drug release of f11 (stability studies) AT 40ºC/75%RH
28 Cumulative % drug release OF F12 (stability studies) AT 40ºC/75% RH
Before stability
After stability
Before stability
Table 1. Formulations containing and various concentrations of excipients
Ingredients F1
(mg/tab) F2 (mg/tab)
F3 (mg/tab)
F4 (mg/tab)
F5 (mg/tab)
F6 (mg/tab)
F7 (mg/tab)
F8 (mg/tab)
F9 (mg/tab)
F10 (mg/tab)
F11 (mg/tab)
F12 (mg/tab)
500 500 500 500 500 500 500 500 500 500 500 500
Ethyl cellulose
150 100 75 - - - 75 - 75
HPMC - - - 75 150 100 - - - 75 75 -
Guar gum - - - 75 100 150 - 75 75
Magnesium stearate
2.4 2.4 2.4 2.4 2.4 2.4 2.4 2.4 2.4 2.4 2.4 2.4
Talc 5 5 5 5 5 5 5 5 5 5 5 5
MCC q.s q.s q.s q.s q.s q.s q.s q.s q.s q.s q.s q.s
Total weight 850 850 850 850 850 850 850 850 850 850 850 850
Table 2.Spectrophotometric data for the estimation of glipizide in 1.2 pH
S.No CONC (µg/ml) ABSORBANCE AVG S.D
Trial 1 Trial 2 Trial 3
1 0 0 0 0 0 0
2 1 0.081 0.089 0.081 0.0836 0.0046
3 2 0.163 0.169 0.163 0.1650 0.0034
4 3 0.243 0.254 0.243 0.2466 0.0063
5 4 0.325 0.343 0.325 0.3310 0.0103
6 5 0.406 0.403 0.406 0.4050 0.0017
7 6 0.482 0.489 0.482 0.4843 0.0040
8 7 0.565 0.599 0.599 0.5763 0.0196
9 8 0.648 0.667 0.667 0.6543 0.0109
Table 3.Spectrophotometric data for the estimation of glipizide in 1.2 pH
S.No CONC (µg/ml) ABSORBANCE AVG S.D
Trial 1 Trial 2 Trial 3
1 0 0 0 0 0 0
2 1 0.199 0.198 0.199 0.1986 0.0005
3 2 0.298 0.296 0.310 0.3013 0.0075
4 3 0.398 0.397 0.398 0.3980 0.0010
5 4 0.499 0.587 0.527 0.5276 0.0513
6 5 0.689 0.697 0.688 0.6888 0.0085
7 6 0.789 0.799 0.804 0.8043 0.0181
8 7 0.893 0.897 0.893 0.8931 0.0041
[image:13.595.47.509.357.465.2]9 8 0.986 0.993 0.992 0.9925 0.0056
Table 4. Spectrophotometric data for the estimation of glipizide in 6.8 pH
S.No CONC (µg/ml) ABSORBANCE AVG S.D
Trial 1 Trial 2 Trial 3
1 0 0 0 0 0 0
2 1 0.199 0.198 0.198 0.1590 0.0005
3 2 0.266 0.247 0.204 0.2198 0.0391
4 3 0.319 0.367 0.384 0.3582 0.0312
5 4 0.461 0.489 0.492 0.4812 0.0141
6 5 0.529 0.587 0.567 0.5683 0.0274
7 6 0.643 0.699 0.668 0.6584 0.0326
8 7 0.701 0.788 0.789 0.7582 0.0409
[image:13.595.54.538.630.756.2]9 8 0.801 0.832 0.868 0.8488 0.0402
Table 5. Pre compression evaluation parameters
Formulation Bulk density(gm/cc) Tapped density(gm/cc) Carr’s Index (%) Hausner’s Ratio Angle of Repose (θ)
F1 0.750±0.0020 0.8486±0.0051 11.624±0.310 1.131±0.0039 18.79±1.09
F2 0.654±0.0135 0.7416±0.0210 11.762±0.679 1.133±0.0087 20.64±0.629
F3 0.730±0.0015 0.8456±0.0102 13.628±1.228 1.157±0.0163 22.43±1.060
F4 0.624±0.0011 0.7113±0.0120 12.212±1.631 1.139±0.0212 20.26±1.692
F5 0.693±0.0035 0.793±0.0030 12.568±0.116 1.143±0.0015 21.58±1.030
F6 0.716±0.0052 0.838±0.0056 14.588±1.070 1.170±0.0147 22.45±1.062
F7 0.648±0.0045 0.734±0.0034 11.715±0.683 1.132±0.0087 20.02±1.486
F8 0.655±0.0030 0.754±0.0026 13.089±0.507 1.150±0.0067 27.02±0.470
F9 0.626±0.0023 0.727±0.0040 13.923±0.608 1.161±0.0082 26.95±1.291
F10 0.621±0.0079 0.721±0.0102 13.893±1.966 1.161±0.0262 24.93±1.095
F11 0.654±0.0026 0.754±0.0026 13.262±0.046 1.152±0.0006 25.54±1.015
compared with pure drug thermogram, results were shown in Figures 13 and 14. No interaction was found between drug and polymers and the characteristic peak of drug is not observed in the formulation. Hence it indicates the physical nature of the drug is not changed in the formulation, it indicating that no significant change in the chemical integrity of the drug.
Preformulation studies
Melting Point Determination Melting point of Glipizide was determined by standard method as capillary method and was
found to be in the range 205-2080C, which complied with IP
standards, thus indicating the purity of the drug sample as the same compared with the standard.
Flow properties
Angle of repose: All formulations were between 18-27 shown in Table 5, indicating reasonable flow property and all formulations were found to fit with respect to flow property.
Carr’s index: was between 11 to13 shown in Table 5, indicating all formulations was found to be within the limits.
Hausner’s Ratio: was between 1.131 to 1.170 shown in Table 5, indicating that all formulations was found to be within the limits.
Weight variation: The weight variation for all formulations was shown in Table 6. The results of weight variation of tablets in all formulations were found to be in the range of 847.80±0.603 to 853.2±1.362 mg indicating that the weight variation is within the pharmacopoeial limits.
Hardness: The hardness for all formulations were shown in the 6, hardness was found to be in the range of 6.2±0.34 to 6.59±0.1 indicating that is within the pharmacopoeia limits.
Friability: The friability of all formulations was shown in the Table 6 and ranges from 0.0133±0.003 to 0.097±0.0209 indicating that the variability of all formulations was less than 1%.
Thickness: Thickness of all formulations was depicted in the Table 6. The results thickness of all formulations found to be in the range of 4.11±0.18 to 4.78±0.20.
Drug content: The percentage drug content of all formulations was found in the range of 97.06±0.92 to 100.15±0.52, which was all within the acceptable limits of official standards.
In vitro drug release studies
[image:14.595.38.556.435.562.2]The in-vitro release study was carried out in three different dissolution media, namely, in simulated gastric fluid at pH 1.2 for 2 hrs then replaced by simulated intestinal fluid for next 3 hrs at 7.4pH and then followed by simulated colonic fluid at 6.8 pH for next 7hrs.
Table 6. Results of post compression characteristics
Formulation Bulk density(gm/cc) Tapped density(gm/cc) Carr’s Index (%) Hausner’s Ratio Angle of Repose (θ)
F1 853.2±1.362 6.3±0.07 0.0507±0.017 4.11±0.18 99.03±1.67
F2 852.68±2.116 6.32±0.09 0.0387±0.016 4.70±0.22 99.15±0.89
F3 852.18±0.560 6.5±0.17 0.040±0.0147 4.54±0.18 98.98±0.77
F4 852.57±1.019 6.2±0.34 0.0524±0.025 4.78±0.20 99.80±0.13
F5 851.08±1.060 6.4±0.35 0.0370±0.0178 4.56±0.18 100.25±0.08
F6 850.51±0.896 6.59±0.1 0.097±0.0209 4.11±0.11 97.06±0.92
F7 848.60±0.976 6.5±0.17 0.024±0.0120 4.54±0.21 99.82±1.35
F8 848.55±1.02 6.4±0.04 0.0250±0.0167 4.70±0.16 100.06±0.77
F9 849.20±0.577 6.3±0.05 0.0133±0.003 4.16±0.20 99.92±0.20
F10 850.16±1.486 6.5±0.17 0.0383±0.0086 4.52±0.22 98.37±0.67
F11 847.80±0.603 6.4±0.04 0.0407±0.0057 4.72±0.10 100.7±0.52
[image:14.595.50.550.590.745.2]F12 851.92±0.545 6.2±0.34 0.0233±0.0174 4.28±0.18 99.87±0.052
Table 7. Cumulative percentage drug release of f1 to f12
Time (min) F1 F2 F3 F4 F5 F6 F7 F8 F9 F10 F11 F12
0 0 0 0 0 0 0 0 0 0 0 0 0
15 7.4444 7.000 6.0333 9.2777 9.6444 8.222 6.222 7.444 7.655 5.9111 5.788 6.1444
30 9.930 8.261 9.9224 10.607 11.053 9.267 8.701 9.9302 10.264 7.5661 7.054 7.0230
60 13.762 9.973 10.721 13.999 15.225 10.652 10.638 13.985 14.432 9.8413 8.7600 8.8840
120 15.172 10.917 14.258 21.854 21.865 14.155 13.363 16.284 17.512 11.162 10.041 10.455
180 22.755 13.284 17.949 27.238 30.226 17.056 16.622 20.270 20.975 16.390 15.820 12.502
240 28.003 24.918 20.332 32.026 36.831 22.757 20.175 23.151 22.821 18.141 18.123 15.824
300 30.649 27.962 25.704 35.109 39.179 27.382 22.016 27.362 27.445 20.941 20.991 18.057
360 38.010 34.271 32.403 44.024 44.100 35.210 30.563 33.295 33.309 27.084 25.838 23.914
420 39.281 41.494 35.198 47.455 48.840 39.002 32.448 37.894 36.436 33.123 27.207 26.826
480 43.912 43.766 38.253 53.358 53.442 43.878 38.188 41.782 38.352 35.430 33.430 29.836
540 47.832 48.831 41.896 57.901 55.204 47.634 41.832 44.054 40.359 38.323 35.555 31.798
600 51.690 51.550 46.623 58.951 57.137 52.474 45.985 46.746 42.213 41.230 38.346 33.606
660 55.404 53.628 52.847 61.395 59.816 57.257 48.852 49.043 46.367 44.070 38.653 35.832
The amount of drug released from formulations F1, F2, F3, F4, F5, F6, F7, F8, F9, F10, F11, F12 in gastric condition after 2hrs were 15.15%, 10.91%, 14.26%, 21.84%, 21.85%, 14.155%, 13.35%, 16.27, 17.51%, 11.16%, 10.05% and 10.44% respectively.
[image:15.595.69.525.76.212.2]The amount of drug released from formulations F1, F2, F3, F4, F5, F6, F7, F8, F9, F10, F11, F12 in intestinal condition after 3hrs were 30.63%, 27.95%, 25.71%, 35.11%, 39.16%, 27.37%, 22.00%, 27.35%, 27.44%, 20.95%, 20.98% and 18.04% respectively.
Table 8. Mathematical modeling and drug release kinetics of formulation f1 tof12
Formulation code Drug Release Kinetics
R2 R2 R2 n R2
F1 0.991 0.995 0.978 0.996 0.422 0.990
F2 0.977 0.983 0.945 0.983 0.437 0.937
F3 0.994 0.984 0.952 0.989 0.467 0.979
F4 0.972 0.988 0.984 0.985 0.499 0.992
F5 0.953 0.985 0.993 0.977 0.483 0.991
F6 0.994 0.985 0.946 0.990 0.432 0.959
F7 0.991 0.985 0.947 0.989 0.454 0.982
F8 0.982 0.989 0.974 0.988 0.498 0.990
F9 0.979 0.991 0.984 0.988 0.474 0.993
F10 0.989 0.989 0.954 0.990 0.428 0.981
F11 0.987 0.989 0.964 0.989 0.473 0.979
[image:15.595.78.517.332.496.2]F12 0.990 0.991 0.951 0.991 0.442 0.967
Table 9. Drug content data after stability study
S.No Time Formulation (Content estimation in%) at room temperature Formulation (Content estimation in%) at 40ºC/75%RH
F11 F12 F11 F12
1 15 Days 98.95 99.85 98.83 99.76
2 30 Days 98.49 98.99 98.36 98.89
3 45 Days 98.38 98.78 98.26 98.72
4 60 Days 98.24 98.62 97.45 98.58
Table 10. In-vitro drug release of tablets stability study of formulation f11 and f12 at room temperature
Time in min F11 Formulation F12 Formulation
Before stability studies After stability studies Before stability studies After stability studies
0 0 0 0 0
15 5.788889 5.739 6.144444 6.132
30 7.054383 7.0118 7.023025 7.194
60 8.760062 8.6953 8.884074 8.878
120 10.04167 10.0124 10.45525 10.491
180 15.82072 15.7654 12.5024 12.432
240 18.12303 18.1636 15.82471 15.289
300 20.99149 20.937 18.0574 18.174
360 25.83897 25.7456 23.9146 23.634
420 27.20716 27.143 26.82687 26.213
480 33.32761 33.284 29.83642 29.256
540 35.55397 35.456 31.79824 31.624
600 38.36443 38.267 33.60642 33.554
660 38.65306 38.196 35.83278 35.779
[image:15.595.58.543.526.690.2]720 40.66034 40.598 38.72506 38.756
Table 11. In-vitro drug release of tablets stability study of formulation F11 AND F12 AT 4OºC/75%RH
Time in min F11 Formulation F12 Formulation
Before stability studies After stability studies Before stability studies After stability studies
0 0 0 0 0
15 5.788889 5.601 6.144444 6.132
30 7.054383 7.196 7.023025 7.194
60 8.760062 8.593 8.884074 8.845
120 10.04167 10.256 10.45525 10.435
180 15.82072 15.763 12.5024 12.467
240 18.12303 18.112 15.82471 15.236
300 20.99149 20.847 18.0574 18.174
360 25.83897 25.298 23.9146 23.667
420 27.20716 27.165 26.82687 26.287
480 33.32761 33.284 29.83642 29.297
540 35.55397 35.4858 31.79824 31.623
600 38.36443 38.394 33.60642 33.554
660 38.65306 38.343 35.83278 35.779
were 58.55%, 55.64%, 53.77%, 61.87%, 60.80%, 58.80%, 50.35%, 49.37%.47.25%, 45.45% 40.66%, and 38.71%, respectively and results showed in Table 7 and Figures 15-19,indicating that the drug release from the formulations decreased with an increase in the amount of polymer added in each formulation. Formulation F11 and F12 shows slow release compared to all formulations and found to be good candidate for colonic drug delivery.
Release kinetics of Glipizide
All the formulations shown linearity with respect to zero order and first order kinetics as shown in Table 8 and Figures 20-24. The regression values of the Zero order kinetics of Formulations F1, F2, F3, F4, F5, F6, F7, F8, F9, F10, F11, F12 were 0.992, 0.977, 0.995, 0.971, 0.954, 0.994, 0.991, 0.982, 0.979, 0.989, 0.987 and 0.995 respectively. The regression values of first order kinetics of Formulations F1, F2, F3, F4, F5, F6, F7, F8, F9, F10, F11, F12 were 0.995, 0.983, 0.985, 0.988, 0.985, 0.986, 0.985, 0.989, 0.988, 0.992, 0.989 and 0.993 respectively. From the regression values was found that the drug release follows mixed order kinetics.
To ascertain the drug release mechanism, the in-vitro data
were also subjected to Higuchi’s model. R2 values of
formulations F1, F2, F3, F4, F5, F6, F7, F8, F9, F10, F11 and F12 were 0.977, 0.946, 0.953, 0.985, 0.994, 0.945, 0.947, 0.973, 0.985, 0.954, 0.966 and 0.952 respectively. The formulations were subjected to Peppas plots, ‘n’ value ranges from 0.422 to 0.499 indicating that the drug release was by non-Fickian diffusion mechanism.
Stability studies
After the stability studies the formulations were subjected to content estimation and the results were shown in Tables 9-11 and Figures 25-28. The best formulations F11 and F12
subjected to stability studies at 400C /75% RH and room
temperature for 2 months. Then the tablets were analyzed for
physical change, drug content estimation and in-vitro
dissolution studies at an interval of 15 days. Results were showed that after analyzed there was no change in case of physical appearance, no significant differences in the drug content and dissolution study. Comparison of drug release profiles of formulations before stability and after stability was shown in the Tables 9 and 11. It was found that formulations were stable throughout the study period.
Conclusion
Glipizide, an oral hypoglycemic agent, is one of the most commonly prescribed drug for the treatment of patients with type II diabetes mellitus (Non- Insulin Dependent Diabetes Mellitus), and belongs to class II of Biopharmaceutical classification System (BCS).All the prepared formulations were evaluated for both pre-compression and post-compression parameters such as tablet thickness, hardness, friability, weight variation and drug content, the values obtained were found to be satisfactory and they comply with
conditions like simulated gastric fluid pH 1.2, intestine fluid pH 7.4 and simulated colonic fluid pH 6.8 for a period of 12hrs. The results of dissolution studies indicated that formulations F11 and F12 produced better control in colonic conditions with 40.65% and 38.71% of drug release over a period of 12hrs in comparison to other formulations. The dissolution data so obtained was fitted to various mathematical kinetic models and the drug release followed mixed order and Higuchi’s model. To study release mechanism of the drug from matrices the data were fitted to Koresmeyer-Peppas model and the release mechanism involved was non-Ficknian diffused (Anomalous transportation).
From above highlight it can be concluded that the polymer
plays a major role in the design of Control Drug Delivery System with matrix tablets. The study reveals that the release of drug was low when the matrix tablet contained polymers with increasing concentration and combination. Hence it clearly indicated that the necessity of combining different classes of polymer to get an acceptable pharmacokinetic
profile in the fluctuating in vivo environment.
REFERENCES
Akash Yadhav and Dinesh Kumar Jain, 2011. Formulation and evaluation of gastroretentive floating microballoons of
anti diabetic drug. Asian Journal of Pharmacy and Life
Sciences, 1(2):ISSN 2231-4423.
Aulton, M.E. 2002. The Science of dosage form design; Churchill living stone; 2nd edition; page 414-18.
Bagyalakshmi, J., Phani Krishna, Y. and Ravi T. K. 2011. Bilayer tablet formulation of metformin hydrochloride and glipizide: A novel approach in the treatment of diabetes, International Journal of Pharmaceutical Sciences Review and Research, 2011;8(2): 035.
Basavaraj, K. Nanjwade, Sunil, R. Mhase, F.V. Manvi, 2011. Formulation of extended-release metformin HCl matrix
tablets. Tropical Journal of Pharmaceutical Research,
10(4):375-383.
Beckett, A.H. and Stenlake, J.B. 2004. Practical
Pharmaceutical Chemistry, Part II. CBS Publishers, Delhi, Fourth Edition 2004: 72-75.
Dinesh Kaushik, Satish Sardana, Dina Nath Mishra. 2009. Implication of biodegradable and bioadhesive systems in
colon delivery. International J of Pharmaceutical
Sciences and Drug Research, 1(2):55-62.
ICH Q1A (R2) Stability testing guidelines: Stability Testing of new drug substances and products.[online]. [Cited, 2008, Nov, 10]; Availablefrom: URL:http://www.tga.health. gov.au/docs/pdf/euguide/inch/273699r2en.pdf.
Indian pharmacopoeia. Vol 2. Controller of publications. Ministry of health and family welfare. Delhi; 2010.p. 48-52.
Kamlesh J. Wadher, Rajendra B. Kakde and Milind J. Umekar, 2011. Formulation of sustained release metformin hydrochloride matrix tablets: influence of hydrophilic
polymers on the release rate and in-vitro evaluation.
Korsemeyer, R.W. and Peppas, N.A. 1983. Macromolecular and modeling aspects of swelling – controlled systems. In Mansdrofsz, rosemann TJ, ad, Controlled Release Delivery systems. New York, Ny: Marcel Dekker; 1983:77.
Lachman, L., Liberman, H.A. and Joseph, C.K. 1991. Pharmaceutical Dosage Forms, 3rd Ed., Varghese Publishing House, Bombay, 1991; p.317-50.
Margret Chandira et al. 2010. Formulation and evaluation of
Extended release tablets containing metformin HCl. International Journal of Chem. Tech Research, 2(2):1320-1329.
Nitin Saigal, Sanjula Baboota, Alka Ahuja and Javed Ali. 2009. Site specific chronotherapeutic drug delivery
systems: A patent review. Recent Patents on Drug
Delivery and Formulation, 3: 64-70.
Pavia, D.L., Lampman, G.M. and Kriz, G.S. 2002. Introduction to Spectroscopy. Washington: library of congress catalogue, 26-27.
Poonam Kushwaha, Sheeba Fareed and Sanju Nanda, 2010. Promising approaches to target drug delivery to colon. International J. of Pharmaceutical Sciences, 2(3):669-679.
Sanket D Gandhi, Priyanka R Pandya, Girish K Jani, Nishant N Upadhyay and Upendra Nagaich, 2010. Formulation development and evaluation of colon targeted tablets of
secnidazole for the treatment of amoebiasis. International
Journal of Pharmaceutical Sciences Review and Research, 5(3): 64-71.
Tapan Kumar et al. 2007. Formulation and optimization of
sustained release matrix tablet of metformin HCl using
response surface methodology. The Pharmaceutical
Society of Japan, 127(8):1281-1290.
Vinod Dube, Payghan S.A. and D’souza, J.I. 2011. Development of colon targeted Lornoxicam matrix tablet. International J. of Pharmaceutical Research and Development, 3(6):226-232.