RESEARCH ARTICLE
APPLICATION OF GEOGRAPHIC INFORMATION SYSTEM (GIS) IN INDUSTRIAL LAND
CAPABILITY INDEX MAPPING OF A DEVELOPING COUNTRY. A CASE STUDY OF ENUGU
AREA, SOUTH-EASTERN NIGERIA
Onunkwo-A, A
1*., Uzoije, A. P
2and Onyekuru, S.O
31,3Department of Geosciences Federal University of Technology, Owerri, South East Nigeria.
2Department of Environmental Engineering, Federal University of Technology Owerri South East Nigeria
ARTICLE INFO ABSTRACT
It was projected that the population of Enugu area will grow at approximately 300% by the year 2020. The information is further strengthened by the projected 3,237,298 population figure of the area. This implies that there is the expectation of overpopulation of the area in future. Unemployment and lowering of people’s standard of living are always associated with over population. It therefore, becomes necessary to map out areas on a sustainable basis and most suitable for the sighting of industries to employ the teeming population. Land capability index mapping using Geographic Information System (GIS) principles was used for this study. The study was undertaken using Arc View 3.2a academic, Excel statistical soft-ware and auto card software of GIS. A total of 12 land use determinants were selected as thematic data layers and basic factors influencing the choice of industrial land use. Soil characteristics and geology were integrated into the thematic maps to facilitate the weighting of the basic determinants. The thematic layers were weighted on a scale of 0%-100% and 0-2 inclusive, using the criteria obtained from field work and laboratory investigation. The thematic layers were subjected to overlay using arc view soft ware overlay model builder. The operation yielded a layer of preferred industrial land use options in a map form. 3 areas of varying suitabilities (Area 7,8 and 9) resulted from this operation. Area 7 occupies 10% of the study area suitable for industrial land use options; area 8 occupies 70% and has low suitability for industrial land use while area 9 occupies 20% of the land unit unsuitable for industrial land use.
Copy Right, IJCR, 2011, Academic Journals. All rights reserved
INTRODUCTION
Population explosion in developing world has generated acute unemployment and low standard of living. There is the need to establish industries to employ the teeming population. It is necessary to make effective use of the available lands especially in developing countries where land tenure and population impose land scarcity. Enugu, the area under study is within the heart of Ibo community of southeastern Nigeria, where land is scarce due to over population and land tenure system (Dutra and Hober, 1998). Unemployment in Enugu area of Nigeria was projected to increase at about 300% by the year 2020. This is further strengthened by the projected 3237298 population figure of Enugu state of Nigeria. Going by this bad state of a affairs, there is an urgent need to locate areas on most sustainable basis for the establishment of industries to employ the teeming population.
*Corresponding author: [email protected]
Geographic Information System (GIS) is one of the best approaches for this type of project, since its application has been widely acclaimed to facilitate efficient decision making and planning (Holland and Smith, 2003). GIS consists of a set of computerized tools and procedures that can be used to effectively store, retrieve overlay correlate, manipulate, analyse , display and disseminate land related information (Kang 2002). Pearce and Turner (1990), observed that unplanned land development has resulted in severe environmental damage and declining quality of life for many people. Dimitri and Crynine (2003), observed that the development of any land area for industrial set up requires detailed geological and engineering studies as to ascertain the capability of the land for the purpose. Landuse planning is accomplished through the use of a variety of factors. These factors can be divided into four categories as physical (Geological and topography), economic, social and political factors (Chapin 1965). According to Arthur and Irwin, 1982),
ISSN: 0975-833X
Available online at http://www.journalcra.com
International Journal of Current Research
Vol. 3, Issue, 8, pp.100-105, August, 2011
INTERNATIONAL JOURNAL OF CURRENT RESEARCH
Article History:
Received 8th
May, 2011 Received in revised form
16th
June, 2011
Accepted 18th
July, 2011
Published online 5th August, 2011
Key words:
industrial buildings should be located in an area that will minimize the negative impacts on the natural environment. Other factors to be considered include slope, flood plain, surface and ground water resource, and soil factor and geostructural instabilities
MATERIALS AND METHODS
Description of Study area
The study area is located between latitudes 6 16' N and 6
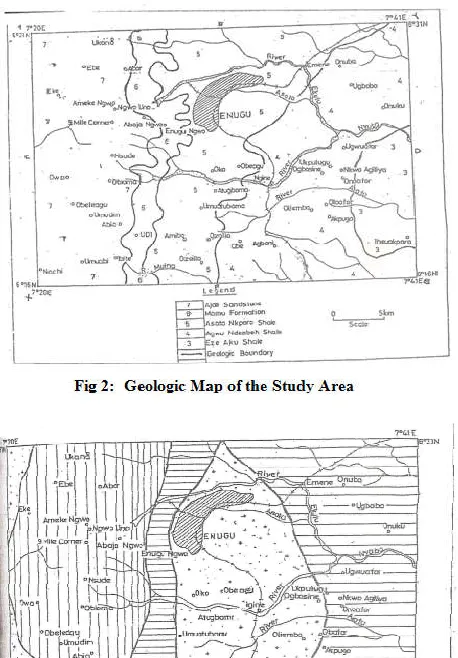
[image:2.612.318.547.55.384.2]31'N and longitude 7 20' E and 7 41' E covering an area extent of about 630km3 Fig 1. It is also located within the rainforest-belt of Nigeria and has annual rainfall of about 1100mm a year, (Iloeje 1981). The most striking feature within the study area is Enugu –Awgu escarpment. The escarpment was formed by the resistant sandstones of Mamu Formation. Drainage system is controlled by the escarpment, which forms the most important water shed separating the cross river drainage system to the east from a network of streams flowing west towards Anambra drainage basin (Ofomata, 1985). Egboka, (1993) described the drainage basin as dentritic. Geologically, the study area lies in Anambra basin of South-eastern Nigeria. The basin is of cretaceous to tertiary age (Reyment, 1965, Murat, 1972). Five formations underlie the area namely Ezeaku Formation (Turonian), Awgu Ndiabo shale (Santonian) Nkporo Formation (Campanian – Maastrichtian) Mamu Formation (middle Maastrichtian) and Ajali sandstone (late Maastrichtian). The stratigraphic succession and geology of the area is shown in Table 1 and Fig 2.
The hydrogeology of the area indicates that the major water bearing unit is Ajali sandstone that underlies areas to the west with deep static water table of about 30m to 40m (Nwankwor
[image:2.612.316.551.240.465.2]et al., 1988). Egboka, (1993) observed the occurrence of aquifer within Mamu Formation, while aquitards occur within Nkporo Formation / Enugu shale. These aquitards are fractured and are tapped by hand dug wells that show high coliform counts (Ezeanyim, 1988). The main soil types in the area are ferralithic, forralithic, hydromorphic and lithosoils Fig 3.
These soils were derived from Enugu shale and Ajali sandstone (Ogbukagu, 1976). The soils derived from Enugu shale are expansive and have hydraulic conductivity values of about 10-5 m/s (Egboka and Onyebueke, 1999) making them poor construction materials.
Sampling Techniques and Analytical Methods
Soil samples were collected at Owa, Ngwo, Ugwuafor, Agbani and Enugu Township from pits dug at a depth of 5 metres using auger. They were placed in polythene bags, and transported to laboratory for analysis. Method of random sampling was adopted in which 6 (six) soil samples covering the entire soil types of the area were collected. The collected soil samples were subjected to the following analysis using specified methods and equipments: Atterberg limit tests ( using Cassagrande apparatus and Hammer methods) particle size distribution ( using British electric shaker machine), porosity and permeability ( using falling head method and permeameter), Consolidation test was performed using consolidometer. Shear strength was carried out using triaxial shear box and finally compressive strength.
Fig 3: Soil Map of the Study Area
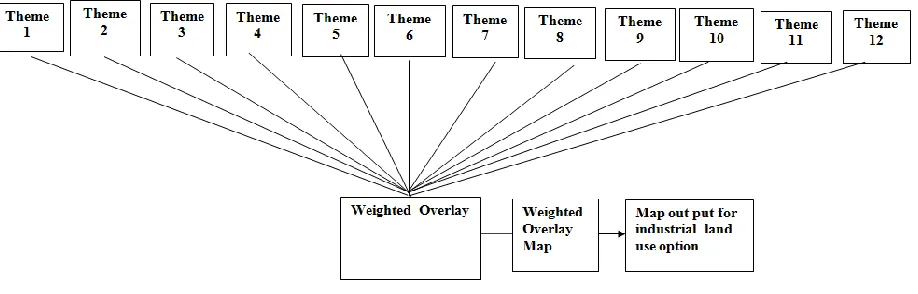
[image:2.612.70.286.394.579.2]Analysis was done using ASTM D, 4318-98 (2000) and ASTM, 1988 Standard specifications. All analytical procedures are shown in (Robert, 2001) Twelve (12) thematic maps of the landuse determinants within Enugu area obtained from different sources were employed as landuse determinants. These include, slope map, elevation map, soil depth map, soil class map, geologic map, drainage map, surface water map, depth to water table map, soil erosion map, flooded/ landslide map, fault map and escarpment map. These maps are the thematic data layers for GIS operation. The equipments used for GIS analysis include integrated land and water information system (ilwis) arc view 3.2a academic, geographic positioning system (GPS eterex 76), excel statistical soft ware, autocard soft ware and geocal. The thematic maps were converted to GIS compatible format by scanning, digitization, georeferencing, projection, polygonization and conversion to common scale of 1:10,000. The thematic layers were saved in different layers in readiness for GIS analysis.
RESULTS AND DISCUSSION
The results of laboratory field and literature studies are shown in Table 2. The table is a reference guide in taking a decision in the rating of the basic determinants of landuse factors. From the table, while the forralithic soil is poorly graded, the hydromorphic and ferralithic soils are well graded. Forralithic and lithosoil tilt towards sandy clay while that of ferralithic and hydromorphic soils tilt towards silty clay. Soils that tilt towards sand have high shear and compressive strength while those tilting towards silt have high attenuative power in handling waste effluents ( Gauley and Krone, 1966, Krynine and Judd, 1957). The result shows that while the clay fraction of hydromorphic soil is 13%, that of feralithic soil is 13.5%. From these, and employing the relation Activity of clay (A) = PL/ p1 ……(1)
Liquidity of Clay L1 = w –pL……..(2)
P1
where p1 is Plasticity Index w, natural moisture content and PL is plastic limit. The activity indices of ferralithic and hydromorphic soils were calculated to be 1.86 and 2.04, while their liquidity indices were calculated as - 0.23 and -0.40. the result of this calculation indicates that the two soils hydromorphic and ferralithic soils are expansive and weak therefore unsuitable for industrial buildings ( Robert et al. 2001). Permeability and porosity result show that while
permeability and porosity of hydromorphic soil measured 1.97 x 10⁻² cm/sec and 0.31 that of ferralithic soil measured 1.89 x 10⁻² cm/sec and .30. The forralithic and hydromorphic soils have 1.92 x 10⁻², .31 and 1.97 x 10⁻², .31. The laboratory
[image:3.612.78.537.271.418.2]investigations of Atterberg limits employing ASTMD. 4318-98 (2000) standard methods show that forralithic soil has liquid limit 26.06% plastic limit 19.75%, plasticity index 0.31%, Hydromorphic soil has liquid limit 43.35% plastic limit 16.89%, plasticity index 26.46%, ferralithic soil has liquid limit 39.84%, plastic limit 14.70% and plasticity index 25.14, while lithosoil has liquid limit 28.06%, plastic limit 20.45% and plasticity index of 7.61. The result clearly shows that the liquid limit and plasticity indices for hydromorphic and ferralithic soils are high indicating an inherent swelling capacity of the soils ( Seed et al., 1962, Ola, 1981). Expansive clays are known to be problematic in building industry (Anon, 1981). The consolidation result for time deformation reading shows that for hydromorphic soil, the void ratio (e) was
Table 1. Generalized Sedimentary Sequence in southeastern Nigeria (after, Reyment, 1965)
AGE FORMATION LITHOLOGY
Maastrichtian 65-68 ma
Ajali Formation
Friable Sandstone with cross bedding. Middle Maastrichtian
68-78ma
Mamu Formation Alternating Sequence of
sandstone clay stone and shale with coal seams. Campanian
78-82 ma
Nkporo / Enugu Shale
Dark grey shale with clayey shale with clay lenses.
Santonian 78-82 ma
Awgu Formation
Bluish grey shale with clay lenses
Turonian 82-92 ma Ezeaku
Formation
Black shale with clay and limestone lenses.
calculated as 0.92, while the coefficient of volume settlement/ consolidation (cv) gave 1.12. For ferralithic and forralithic soils, the void ratio ( ℓ )and coefficient of volume settlement/ consolidation (Cv) are 0.934, 1.3 and 0.94, 0.63. From these results the settlement readjustment of forralithic soil is smaller indicating soil best suited for industrial buildings (Ola , 1981). The shear strength of the soils were calculated using the relation according to Chapin 1965.
τ = C + δn tan θ ………(3)
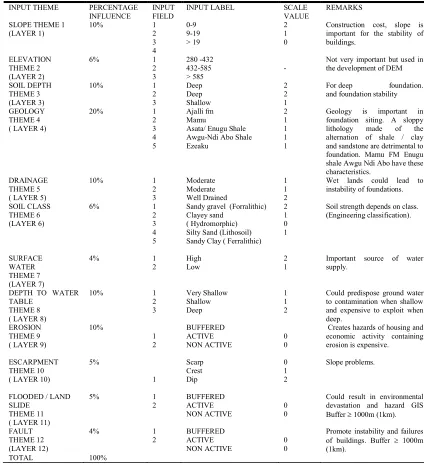
Table 3: Organization of thematic data layers for industrial landuse
INPUT THEME PERCENTAGE
INFLUENCE
INPUT FIELD
INPUT LABEL SCALE
VALUE
REMARKS
SLOPE THEME 1 (LAYER 1)
10% 1
2 3 4 0-9 9-19 > 19 2 1 0
Construction cost, slope is important for the stability of buildings.
ELEVATION THEME 2 (LAYER 2)
6% 1
2 3 280 -432 432-585 > 585 -
Not very important but used in the development of DEM
SOIL DEPTH THEME 3 (LAYER 3)
10% 1
2 3 Deep Deep Shallow 2 2 1
For deep foundation.
and foundation stability
GEOLOGY THEME 4 ( LAYER 4)
20% 1
2 3 4 5 Ajalli fm Mamu
Asata/ Enugu Shale Awgu-Ndi Abo Shale Ezeaku 2 1 1 1 1
Geology is important in
foundation siting. A sloppy
lithology made of the
alternation of shale / clay and sandstone are detrimental to foundation. Mamu FM Enugu shale Awgu Ndi Abo have these characteristics.
DRAINAGE THEME 5 ( LAYER 5)
10% 1
2 3 Moderate Moderate Well Drained 1 1 2
Wet lands could lead to instability of foundations.
SOIL CLASS THEME 6 (LAYER 6)
6% 1
2 3 4 5
Sandy gravel (Forralithic) Clayey sand
( Hydromorphic) Silty Sand (Lithosoil) Sandy Clay ( Ferralithic)
2 1 0 1
Soil strength depends on class. (Engineering classification).
SURFACE WATER THEME 7 (LAYER 7)
4% 1
2
High Low
2 1
Important source of water supply.
DEPTH TO WATER TABLE
THEME 8 ( LAYER 8)
10% 1
2 3 Very Shallow Shallow Deep 1 1 2
Could predispose ground water to contamination when shallow and expensive to exploit when deep.
EROSION THEME 9 ( LAYER 9)
10% 1 2 BUFFERED ACTIVE NON ACTIVE 0 0
Creates hazards of housing and economic activity containing erosion is expensive.
ESCARPMENT THEME 10 ( LAYER 10)
5% 1 Scarp Crest Dip 0 1 2 Slope problems.
FLOODED / LAND SLIDE
THEME 11 ( LAYER 11)
5% 1
2 BUFFERED ACTIVE NON ACTIVE 0 0
Could result in environmental devastation and hazard GIS
Buffer 1000m (1km).
FAULT THEME 12 (LAYER 12)
4% 1
2 BUFFERED ACTIVE NON ACTIVE 0 0
Promote instability and failures
of buildings. Buffer 1000m
(1km).
[image:4.612.89.513.281.745.2]analysis. Employing equation 3 and parameters C and tan θ from graph of shear versus normal stress, the shear strength for hydromorphic, forralithic, ferralithic and lithosoils are 85.56KN/m2 , 96.09 KN/m2, 87.82KN/m3 and 88.36KN/m3
respectively. The shear strength of hydromorphic and ferralithic soils are lower than forralithic and lithosoils , also the angle of internal friction is high for forralithic soils indicating a high shear strength (Aria 2003). Hydromorphic and ferralithic soils show high cohesion there is likelihood of shear failure when subjected to load like industrial buildings since saturated clays fail if subjected to vibration ( Braja, 1988). The result of compressive strength shows that
forralithic soil has compressive strength of 9.10KN/m2 with test load of 14.43KN/m2, ferralithic soil 2.10KN/m2 test load 20.16 KN/m2. Hydromorphic soil 2.176 KN test load 56.0 KN/m2, while lithosoil has 3.24KN/m2 with test load of 21.34 KN/m2 . Earlier, Terzaghi and Peck (1967) observed that any rock or soil mass with compressive strength between 2KN/ m2 and 7KN/m2 is weak, while those above these values are strong. Based on this , forralithic soil is stronger. The moisture-density curve indicates optimum moisture content of 11.02% and maximum dry density of 1.51kg/m3 for ferralithic soil , that of hydromorphic soil has 13.01 and 1.52kg/m3 while forralithic soil has 14.0 and 1.90kg/m3. Forralithic soil satisfied conditions for accommodating heavy industrial buildings ( Terzaghi and Peck, 1967). The lower dry density and higher moisture content of the hydromorphic and ferralithic soils indicated higher affinity for water which makes them expansive and weak (Aria, 2003). The result of soils engineering classification, employing grain size and Atterberg limit result using unified soil classification system (USCS) shows that forralithic soil is classified as Ml-cl ( silt / sand, poorly graded ) hydromorphic soil Sp-cl ( silty caly and poorly graded), ferralithic soil is Sw-cl ( silty caly and well graded) while lithosoil is silty and poorly graded. The above results are relevant guides in rating of landuse determinants.
12 thematic maps of the landuse determinants obtained from different sources were employed for GIS operation. These include slope map, elevation map, soil depth map, soil class map, geology map, drainage map, surface water map, depth to water table map, erosion map, flooded / land slide map, fault map and escarpment map. These maps are the thematic data layers for GIS operation. The thematic layers were organized as input data necessary for over lay operation. Table 3. The
percentage influence which adds up to 100% signifies the degree of importance of the theme to the land determinant factor. The table is a computer statement where scale values were selected based on the results of laboratory and field studies, of fig 2 are the capability ratings assigned to each environmental factor based on a scale of 0-2 inclusive making up three classes of suitable (2), low suitability (1) and unsuitability (0). The result of overlay operation fig 4 yielded a layer of industrial landuse map fig 5. The map shows various areas of suitabilities designated areas 7, 8 and 9 respectively. Area 7 occupies 10% of the study area suitable for industrial landuse, area 8 occupies 70% and has low suitability for industrial landuse, while area 9 occupies 20% of the entire area unsuitable for industrial landuse.
Evaluation and Conclusion
The study shows that high proportion of Enugu land unit has low suitability for industrial land uses. The few areas that are suitable are located within the western segments and to a small extent the east. Some of the available lands are unsuitable due to fault, erosion, landslide flooding and to some extent the scarp face of the escarpment. Areas to the west, south west and south east are highly favoured for industrial landuse options. Comparison of the results of the study against the existing landuse clearly exposed to limitations of the landuse of the area. Adherence to this research would minimize the occurrence of material hazards, hence the quality of lives of the greater number of Enugu residents would be raised in the most cost effective manner possible.
REFERENCES
Arthur D.H. and Irwin, R 1982. Geology in environmental Planning Graw-Holl Inc, N.Y. 320-350.
Aria W.R. 2003. Principles of Geotechnics, env. Prot. Service Canada 24-30
ASTM, 1988 Annual Book of ASTM Standards Philadelphia, 1988, Copy rights. American Society for testing and materials 1916, Race Street Philadelphia PA 19103 reprinted with permission pp 430-524
ASTM D 4318-98 (2008) ASTM Standard Vol. 04.08 rock and Soil Standard test for liquid limit, plastic limit and plasticity index of soils, West Conshohocken P.A. pp 546-558
ASTM D. 4767-95 (2000). Annual book of ASTM Standards Vol 04:08 rock and soil Stanadard No 4767-95 Standard test method for consolidated undrained Triaxial Compression test for cohesive soils, West Conshohocken P.A. pp 882-891
Chapin F.J. 1965. Urban landuse planning, Illnois University Press illnois USA , PP 34-48.
Dutra I.V. and Hober R (1998). Primary Forest and Land cover. Brazil Proceedings on international geosciences and remote sensing symposium USA PP 25-35.
Dimitri, P and Krynine, W (2003). Principles of Engineering geology and geotechnics, S.K. Jain for Cbs Publishers and distributors, New Delhi pp 111-122.
Egboka B.C.E., 1993. Water resources problem in the Enugu area of Enugu State Nigeria. Journal of Mining geology vol 20 pp 1-6.
Egboka , B.C.E. and Onyebueke, F.O. 1999. Acute Hydrogeological problems vis a vis planning and
management of developing economy. A case study of Enugu area, Nigeria pp 10-12.
Ezeanyim, E.C. 1988. Hydrogeology of Enugu area and environs , unpublished M.Sc thesis, University of Nigeria Nsukka pp 34-40.
Gauley D.N. and Krone, R.B. Soil Mantle as a waste treatment system, University of California Berkely California Serial Report no 6607 pp 120-131
Holland, D.A. and Smith, S.L. 2003. The effect of changing grid size in creation of Laser Scanner, Digital Surface Models in Geo Computation Oxford University Press PP 230-240.
Iloeje, N.P. 1981. A new geography of Nigeria (A new revised edition) Published in Great Britain by William Clowes (Beccles) Ltd. London pp 85-120.
Kang V.C. 2002. Introduction to geographic information system , Tata M.C. Graw-Hill Publishing Company. Ltd New Delhi pp 20-25
Krynine, D.P. and Jude W.R. 1957. Principles of Engineering Geology and Geotechniques, MC Graw-Hill Book Company pp 47-60.
Murat, R.C. 1972. Stratigraphy and Paleogeography of Cretaceous and Lower Tertiary in Southern Nigeria, African Geology, Ibadan University Press pp 251-266.
Nwankwor, G.I., Okeke O.C. and Ahiarakwem C.A. 2004 Land Capability Index Mapping of Enugu area and environs for presidential landuse options. Advances in geo sciences vol 2 No 1 Cape Publishers International Ltd, 27 Alaenyi-Street, Owerri pp 4-64
Ofomata, G.E.K 1985. Technical report on feasibility study of erosion vulnerability areas in the eastern part of Nigeria, Ethiope Publishing House Benin pp 35-37.
Ola P.C. 1981: Geotechnical properties of soft rocks. International Journal on Engineering Geology USA Vol 2 pp 25
Pearce D.W. and Turner R.K. 1990. Economics of natural resources the environment, harvest wheat sheaf London pp 21-28
Reyment R.A. 1965 Aspect of the geology of Nigeria, Ibadan University Press pp 25-38.
Robert W.D. Krebs , D and Richard D.W. 2001. High way materials , M.C. Graw Hill Book Company, New York pp 211-224
Seed , H.B. Wood W. and Lundgren, R.J. 1962. Prediction of swelling potential for compacted Clays ASCE. J Soil Mechanics pp 53-57.
Terzaghi, K and Peck R.B. 1967. Soil Mechanics in Eng. Practice 2nd Ed. John Wiley and Sons Publishers, New York pp 35-50.