Automatic error classification with multiple error labels
Maja Popovi´c ADAPT Centre Dublin City University
Ireland
David Vilar Amazon Germany
Abstract
Although automatic classification of ma-chine translation errors still cannot provide the same detailed granularity as manual er-ror classification, it is an important task which enables estimation of translation er-rors and better understanding of the ana-lyzed MT system, in a short time and on a large scale. State-of-the-art methods use hard decisions to assign single error labels to each word. This work presents first re-sults of a new error classification method, which assigns multiple error labels to each word. We assign fractional counts for each label, which can be interpreted as a con-fidence for the label. Our method gener-ates sensible multi-error suggestions, and improves the correlation between manual and automatic error distributions.
1 Introduction
Translations produced by machine transla-tion (MT) systems have been evaluated mostly in terms of overall performance scores, either by manual evaluations (ALPAC, 1966; White et al., 1994; Graham et al., 2017; Federmann, 2018) or by automatic metrics (Papineni et al., 2002; Lavie and Denkowski, 2009; Snover et al., 2006; Popovi´c, 2015; Wang et al., 2016). All these overall scores give an indication of the general performance of a given system, but they do not provide any additional information. Translation error analysis, both manual (Vilar et al., 2006; Farr´us et al., 2010; Lommel et al.,
c
2019 The authors. This article is licensed under a Creative Commons 4.0 licence, no derivative works, attribution, CC-BY-ND.
2014b) as well as automatic (Popovi´c and Ney, 2011; Zeman et al., 2011), as a way to identify weaknesses of the systems and define priorities for their improvement, has received a fair amount of attention in the MT community. Although automatic error classification still cannot deal with fine-grained error taxonomies, it represents a valuable tool for fast and large scale translation error analysis. With the emergence of neural MT systems, first insights about the differences between the neural approach and the then state-of-the-art statistical phrase-based approach were obtained by using automatic error classification. Bentivogli et al. (2016) analyzed four MT systems for English into German by comparing different TER (Snover et al., 2006) scores and sub-scores, and Toral and S´anchez-Cartagena (2017) applied the WER-based approach proposed by Popovi´c and Ney (2011) for a multilingual and multi-faceted evaluation of eighteen MT systems for nine translation directions including six languages from four different families.
reference: in some placesrents will even rise
hypothesis: in some placeseven grow rents
Possible ambiguties:
• which words should be tagged as reordering errors, “rents” or “even”?
• “rise”/“grow” can be reordering errors too, and lexical errors at the same time
• are “will”, “rise” and “grow” lexical errors, or “will” and “rise” are missing words and “grow” is an extra word?
Figure 1: Examples of potentially ambiguous error labels both for human annotators as well as for automatic tools: the decision about lexical errors vs missing and extra words, and determining an exact span for reordering errors.
span should be tagged as a reordering issue), or it may be the case that a generated word should be assigned more than one error (e.g. a lexical and a reordering error). Examples of such cases can be seen in Figure 1.
In this work we propose to expand the auto-matic error classification approach by suggesting multiple error categories for each word. Addition-ally, with each error category we are able to as-sign a (fractional) count which intuitively can be interpreted as a confidence for each error category. Since, to the best of our knowledge, this represents the first attempt of multi-label automatic classifi-cation, we first explore what kind of multi-error suggestions are generated by our method. We then compare our results with manual error annotations and with the method based on a single WER align-ment. As translation corpora with manual error analysis allowing multiple labels are not yet avail-able, we evaluate our method by computing the correlation of the global distribution of errors with human assigned labels. We also try to gain insights about the behaviour of the system and find out that the system makes sensible multi-error suggestions.
2 Error classification method
As starting point for our method we take the approach proposed by Popovi´c and Ney (2011) which is based on a combination of WER and PER statistics on different forms of the words (sur-face, base forms). WER is defined as (a nor-malized version of) the edit distance (Levenshtein,
1966), whereas PER is Position-independent word Error Rate which does not take the word order into account. The described method identifies actual words which contribute to WER as well as to two types of PER called “Reference PER” (RPER) and “Hypothesis PER” (HPER) corresponding to recall and precision. The dynamic programming (DP) al-gorithm for WER enables a simple and straight-forward identification of each word which con-tributes to the edit distance. The WER operations are called “substitutions”, “deletions” and “inser-tions”. The PER metric is based on reference and hypothesis word counts without distinguish-ing which words are deletions, which insertions, and which are substitutions. Therefore two alter-native PER-based measures which correspond to the recall and precision are introduced, RPER and HPER. The RPER errors are defined as the words in the reference which do not appear in the hy-pothesis, and the HPER errors are the words in the hypothesis which do not appear in the refer-ence. Once the WER, RPER and HPER erors have been identified, the base forms for each word are used in order to distinguish the following five error classes:
• inflectional error (”infl”): a word which con-tributes to WER and PER, but its base form does not
• reordering error (”ord”): a word which con-tributes to WER but not to PER
• missing word (”miss”): a WER deletion which also contributes to RPER
• extra word (”ext”): a WER insertion which also contributes to HPER
• lexical error (”lex”): a WER substitution which also contributes to RPER/HPER
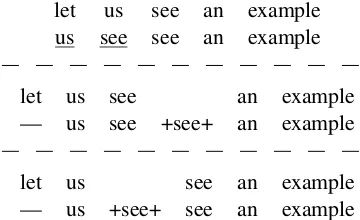
op-let us see an example us see see an example
let us see an example — us see +see+ an example
[image:3.595.88.268.73.183.2]let us see an example — us +see+ see an example
Figure 2:Three possible alignments with edit distance 2 be-tween the reference “let us see an example” and the hypothe-sis “us see see an example”. Insertions are marked as +inser-tion+, deletions as — and substitutions are underlined.
Figure 3:Distribution of error categories using different cri-teria for selecting the best WER alignments. The height of the bars corresponds to the percentage of each error (words classified as correct are not included), the different colors cor-respond to different implementations.
eration checked in the code) and does not have any linguistic motivation.
While this discussion may appear academic at first sight, it does have an important effect when these alignments are used for defining error cat-egories. Figure 3 illustrates this effect, where we show 6 different strategies for defining WER align-ments (based on different precedence of checking “insertion”, “deletion” and “substitution” opera-tions).
On the other hand, the fact that a word can be involved in different WER operations can give ad-ditional information to be used for error classifica-tion. In this work we take into account all optimal WER alignments and collect statistics of all possi-ble edit operations for each word. We collect the alignment statistics (the counts of each operation for each word) using dynamic programming with memoization (using a Depth-First Search strat-egy). Further combination with PER counts is
ap-plied in the same way as in (Popovi´c and Ney, 2011), but instead of combining it with one single WER operation, it is combined with each possible WER operation on the given word thus providing all possible error classes for this word.
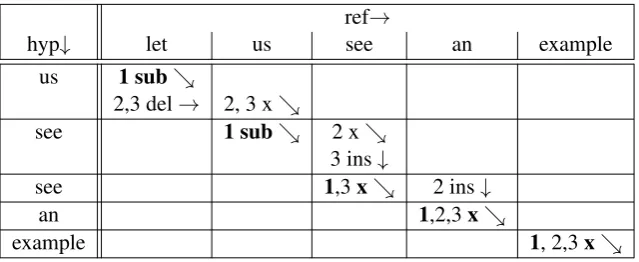
All possible paths for minimal edit distance be-tween the reference and the hypothesis from the example from Figure 2 are presented in Table 1. Minimal edit distance is 2, and it can be reached by three paths. The standard version of the error clas-sification method described in (Popovi´c and Ney, 2011) takes only one path into account, therefore each word in the reference and in the hypothesis is labelled with only one edit operation and thus with one error class. The method proposed in this work collects the edit operations from all paths in the following way:
• deletions are counted only for reference words
• insertions are counted only for hypothesis words
• for each reference word, label counts are col-lected from each cell in its column in the DP trellis
• for each hypothesis word, label counts are collected for each cell in its row in the DP trellis
In this way, in the example in Table 1 the hy-pothesis word “see” at the second position has one “substitution” label (from the cell aligned with the reference word “us”) as well as one “x”1 and one “insertion” (from the cell aligned with the refer-ence word “see”). The referrefer-ence word “see” has two labels “x” (one from the first hypothesis word “see” and one from the second one), however no “insertion” operations.
For each word, each edit operation together with associated PER counts defines an error category as described above. Fractional counts for each er-ror class are obtained by dividing the count of the given error class with the total count of all encoun-tered classes for this word. In our example, the first hypothesis word “see” has three error labels “x” (no edit operations, correct word), “sub” (substitu-tion) and “ins” (inser(substitu-tion) and each of them is seen once. Thus, the total count for this word is 3, and probability for each class is 1
3 = 0.33.
1We denote with “x” the “match” operation, i.e. when the
[image:3.595.73.291.251.419.2]ref→
hyp↓ let us see an example
us 1 sub&
2,3 del→ 2, 3 x&
see 1 sub& 2 x&
3 ins↓
see 1,3x& 2 ins↓
an 1,2,3x&
[image:4.595.140.460.70.201.2]example 1, 2,3x&
Table 1: Three possible paths in the dynamic programming trellis for minimal edit distance for the Example from Figure 2: path1 = ”sub sub x x x”, path2 = ”del x x ins x x” and path3 = ”del x ins x x x”. Standard WER takes only one path (e.g. path1 in bold) into account.
When collecting statistics over a segment or a full corpus, in order to compute the error distri-butions these fractional counts are summed over all words. Thus, the total amount of errors can be a fractional number as well. Note that we can still normalise it by the total number of words in the segment/document to obtain a normalized er-ror rate, as the fractional counts for each word sum up to 1.
Table 2 presents single and multiple error labels for the potentially ambiguous error categories from Figure 1. It can be seen that the multi-label method assigns multiple error cases to the words which can be ambiguous even for a human annotator.
3 Evaluation setup
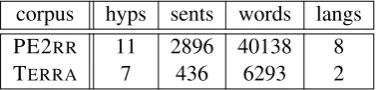
We applied the new method as well as the single WER path method described in (Popovi´c and Ney, 2011) to the publicly available test sets from the TERRA corpus (Fishel et al., 2012) and PE2RR corpus (Popovi´c and Arˇcan, 2016) designed for evaluating automatic error classification. In ad-dition to translation hypotheses and post-edits (PE2RR) or references (TERRA), manual error an-notations are also available. The statistics of the test corpora are shown in Table 3.
The main differences between the two data sets are (i) post-edited MT hypotheses are available in PE2RR (and standard reference translations in TERRA), (ii) manual error annotation in PE2RRis based on correcting automatically assigned labels whereas in TERRA it is performed from scratch. All results are reported separately for each of the data sets.
4 Distribution of error labels
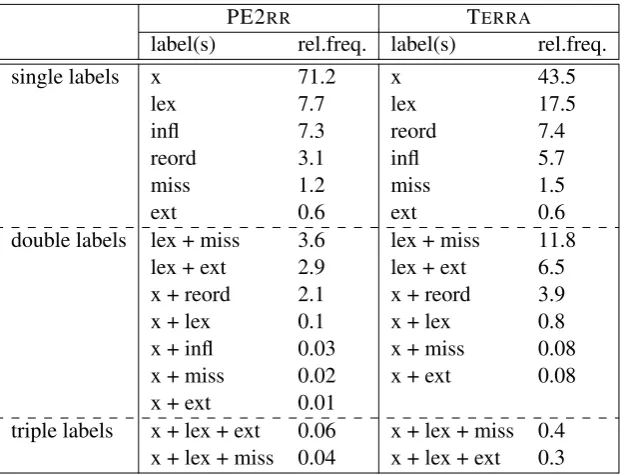
Our first experiment aims to explore the nature and frequency of the error label suggestions generated by the new method. The distributions of error la-bels in the form of relative frequencies are shown in Table 4 for both test sets.
Apart from some small variations, the main ten-dencies are the same for the two test sets. The majority of multiple labels are double labels, the most frequent ones being “lex+miss”, “lex+ext” and “x+reord”. They involve the single labels which are, as mentioned in the introduction, re-ported to be difficult to disambiguate, even for hu-man annotators. Other types of double labels can make sense in certain circumstances but are sig-nificantly less frequent. Two types of triple labels are found, too, “x+lex+ext” and “x+lex+miss”, but their frequency is also low.
reference rents will even rise
single labels reord lex reord lex
multiple labels reord lex+miss x+reord lex+miss frac. counts 1.00 0.50+0.50 0.25+0.75 0.67+0.33
hypothesis even grow rents
[image:5.595.140.461.71.182.2]single labels reord lex reord multiple labels x+reord lex+ext reord frac. counts 0.33+0.67 0.75+0.25 1.00
Table 2:Example from Figure 1 with single error labels and with multiple error labels together with their fractional counts.
corpus hyps sents words langs PE2RR 11 2896 40138 8
TERRA 7 436 6293 2
Table 3:Statistics of the used error annotated corpora: num-ber of different translation hypotheses, numnum-ber of sentences in all hypotheses, number of running words in all hypotheses, and number of different language pairs.
5 Comparison with manual error annotations
5.1 Pearson correlations
An automatic error classification method can be used to detect weak and strong points of individual translation systems, as well as to compare differ-ent translation systems. In order to estimate and compare the reliability of the error classification methods we compute the Pearson correlation with human annotations in two different ways:
• interClass
For each translated segment, correlation with the manual annotation is calculated over all error classes.
• interHyp
For each error class, correlation with man-ual annotation is calculated over all transla-tion segments.
We compare two methods: single error la-bels (single) and our proposed multi-label method (frac). For each of the methods, the ex-tracted error counts are compared with the error counts obtained by manual annotation. For com-puting error counts on the segment level, we just sum the (fractional) counts.
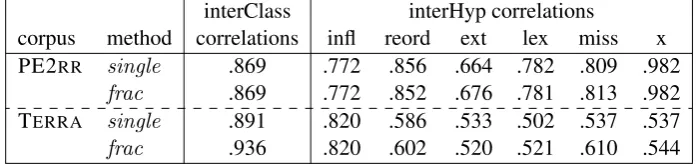
The correlation coefficients are presented in Ta-ble 6. The interClass correlation coefficients are very high for both methods on both corpora, with our proposed frac method having better correla-tion on the TERRAcorpus. For the interHyp
corre-lations, there is no difference for inflectional errors between both test sets. Reordering (reord) and lex-ical (lex) errors as well as correct words (x) have similar correlations on PE2RR and improved cor-relations on TERRA, whereas the correlation for missing words is improved on both corpora. Cor-relation for extra words, however, increased on PE2RR data but decreased on TERRA data. Pre-vious work (Popovi´c and Burchardt, 2011) defined this error class as not reliable enough, so further and deeper analysis focused on this class would be a possible direction for future work.
It can be noted that the majority of improve-ments are achieved on TERRA data, where only standard reference translations are available, and no post-edited MT hypotheses. This scenario rep-resents a more difficult task for automatic classifi-cation (as mentioned in Section 3), and it also rep-resents a more realistic scenario – one reference translation can be used for large-scale evaluations involving many different MT systems, whereas producing a post-edited version for each MT sys-tem would be very time- and resource-consuming.
5.2 Analysis of differences
The most intuitive method for further analysis of differences between the single and frac ap-proaches would be to calculate precision and recall for each error label. However standard precision and recall are not convenient metrics for evaluat-ing our method since the manual annotations con-sist of only one label, so that adding multiple labels would be penalised by this metric (specifically by the precision term).
Thus, in order to better understand the differ-ences between the single and frac methods, we conducted an ad-hoc analysis. For each word that was assigned more than one error category, we dis-tinguish two cases:
[image:5.595.88.280.221.266.2]PE2RR TERRA
label(s) rel.freq. label(s) rel.freq.
single labels x 71.2 x 43.5
lex 7.7 lex 17.5
infl 7.3 reord 7.4
reord 3.1 infl 5.7
miss 1.2 miss 1.5
ext 0.6 ext 0.6
double labels lex + miss 3.6 lex + miss 11.8 lex + ext 2.9 lex + ext 6.5 x + reord 2.1 x + reord 3.9
x + lex 0.1 x + lex 0.8
x + infl 0.03 x + miss 0.08
x + miss 0.02 x + ext 0.08
x + ext 0.01
[image:6.595.144.456.70.307.2]triple labels x + lex + ext 0.06 x + lex + miss 0.4 x + lex + miss 0.04 x + lex + ext 0.3
Table 4:Relative frequencies of multiple error labels for PE2RR and TERRA.
PE2RR TERRA frac counts % % lex + miss 0.50 + 0.50 62.4 52.3
lex>miss 28.8 40.4 lex<miss 8.8 7.3 lex + ext 0.50 +0.50 59.9 42.7
lex>ext 34.5 53.1 lex<ext 5.6 4.2 x + reord 0.50 + 0.50 38.1 31.6
x>reord 0.3 0.8 x<reord 61.6 67.6
Table 5:Most frequent multiple error labels and the relation between their fractional counts.
was incorrect and the expanded method is able to add the correct label.
Adding noise The single label was already cor-rect, therefore the additional labels generated by our method do not improve the system. Statistics about these two categories are shown in Table 7. Improvements are dependent of the cor-rect error category so no global conclusion can be drawn. The single label method tends to in-correctly label missing and extra words as lexi-cal errors. In this case the additional error labels are helpful, whereas for the true “lex” category they are adding noise. In addition to that, the new method helps identifying correct words which the single method tags as reordering errors.
For both “lex+miss” and “lex+ext”, about 15-40% instances are adding information, however
even more instances are adding noise (25-60%). The most frequent case is when both manual and single label are “lex” (in which case no additional suggestions are needed), followed by the manual “ext” or “miss” tagged as “lex” (where additional “miss” or “ext” label can be helpful). The third frequent case is when the correct label is “miss” or “ext”, and the least frequent case is helping to iden-tify “lex” when it is labelled as “ext” or “miss”.
interClass interHyp correlations
corpus method correlations infl reord ext lex miss x PE2RR single .869 .772 .856 .664 .782 .809 .982
[image:7.595.124.474.73.156.2]frac .869 .772 .852 .676 .781 .813 .982 TERRA single .891 .820 .586 .533 .502 .537 .537 frac .936 .820 .602 .520 .521 .610 .544
Table 6:Pearson correlations comparison between error classes (interClass) and between translation hypotheses (interHyp)
multiple fracis PE2RR TERRA
labels single man adding % %
lex+miss miss lex inform. 11.4 7.5 lex miss inform. 26.0 12.3 lex lex noise 28.6 21.1 miss miss noise 25.3 9.8 lex+ext ext lex inform. 12.6 4.7 lex ext inform. 19.6 8.1 lex lex noise 39.2 21.1
ext ext noise 18.2 4.7
x+order reord x inform. 24.2 59.4 x reord inform. 1.5 2.3
x x noise 7.9 16.8
reord reord noise 66.1 19.9
Table 7:Percentage of multiple labels which adds information (ifsinglelabel is incorrect but one in the double label is) and
those which do not.
6 Summary
In this paper we proposed an automatic error clas-sification method for machine translation based on edit distance which assigns multiple error labels to each word and enables calculating error label prob-abilities. The main findings of our experiments are:
• The most frequent multiple error labels are “lex+miss” and “lex+ext”, followed by “x+reord”. These error categories have been reported by human annotators to be difficult to differentiate, thus our method seems to generate sensible multi-error suggestions and to model this effect correctly.
• The use of fractional counts increases the correlation of error distribution with human judgements, especially for the more difficult and more realistic TERRA test set. We ex-plain this as a useful confidence-like measure for the labels, which correlates with the un-certainty on human labels.
The described work offers several possibilities for future work taking better advantage of the
frac-tional counts. One issue we encountered when evaluating our method is that the available data sets for the evaluation of error classification methods have single labels. We tried to evaluate our ap-proach assigning to each word the label with the highest fractional count, but this did not lead to an increase in accuracy (despite the better corre-lation with error distribution judgements). Given the fact that human annotators’ feedback indicates a potential for assigning multiple labels, one in-teresting direction would be to generate new data sets supporting this labelling scheme and compute standard measures like precision and recall on this data.
Despite of not having ideal evaluation condi-tions, preliminary manual inspection of the as-signed labels gives us confidence that the method will be useful and interesting for further research.
Acknowledgments
13/RC/2106) and co-funded under the European Regional Development Fund.
References
ALPAC. 1966. Language and machines. Computers in translation and linguistics.
Bentivogli, Luisa, Arianna Bisazza, Mauro Cettolo, and Marcello Federico. 2016. Neural versus Phrase-Based Machine Translation Quality: a Case Study. InProceedings of the 2016 Conference on Empirical Methods in Natural Language Processing (EMNLP 2016), pages 257–267, Austin, Texas, November.
Farr´us, Mireia, Marta Ruiz Costa-Juss`a, Jos´e Bernardo Mari˜no, and Jos´e Adri´an Rodr´ıguez Fonollosa. 2010. Linguistic-based Evaluation Criteria to Iden-tify Statistical Machine Translation Errors. In Pro-ceedings of the 14th Annual Conference of the Eu-ropean Association for Machine Translation (EAMT 2010), pages 167–173, Saint-Raphael, France, May.
Federmann, Christian. 2018. Appraise evaluation framework for machine translation. InProceedings of the 27th International Conference on Computa-tional Linguistics (COLING 2018): System Demon-strations, pages 86–88, Santa Fe, New Mexico, Au-gust.
Fishel, Mark, Ondˇrej Bojar, and Maja Popovi´c. 2012. Terra: a Collection of Translation Error-Annotated Corpora. InProceedings of the Eighth International Conference on Language Resources and Evaluation (LREC 2012), pages 7–14, Istanbul, Turkey, May.
Graham, Yvette, Timothy Baldwin, Alistair Moffat, and Justin Zobel. 2017. Can machine translation sys-tems be evaluated by the crowd alone. Natural Lan-guage Engineering, 23(1):3–30.
Klubiˇcka, Filip, Antonio Toral, and V´ıctor M. S´anchez-Cartagena. 2018. Quantitative fine-grained human evaluation of machine translation systems: a case study on English to Croatian. Machine Translation, 32(3):195–215.
Lavie, Alon and Michael J. Denkowski. 2009. The METEOR Metric for Automatic Evaluation of Ma-chine Translation. Machine Translation, 23(2-3):105–115, September.
Levenshtein, Vladimir Iosifovich. 1966. Binary Codes Capable of Correcting Deletions, Insertions and Reversals. Soviet Physics Doklady, 10:707–710, February.
Lommel, Arle, Maja Popovi´c, and Aljoscha Burchardt. 2014a. Assessing inter-annotator agreement for translation error annotation. In Proceedings of the LREC Workshop on Automatic and Manual Metrics for Operational Translation Evaluation, Reykjavik, Iceland, May.
Lommel, Arle Richard, Aljoscha Burchardt, and Hans Uszkoreit. 2014b. Multidimensional quality metrics (mqm): A framework for declaring and describing translation quality metrics. Tradum`atica: tecnolo-gies de la traducci´o, pages 455–463, 12.
Papineni, Kishore, Salim Roukos, Todd Ward, and Wie-Jing Zhu. 2002. BLEU: a Method for Automatic Evaluation of Machine Translation. InProceedings of the 40th Annual Meeting of the Association for Computational Linguistics (ACL 2002), pages 311– 318, Philadelphia, PA, July.
Popovi´c, Maja and Mihael Arˇcan. 2016. PE2rr Cor-pus: Manual Error Annotation of Automatically Pre-annotated MT Post-edits. InProceedings of the 10th International Conference on Language Resources and Evaluation (LREC 2016), Portoroˇz, Slovenia, May.
Popovi´c, Maja and Aljoscha Burchardt. 2011. From human to automatic error classification for machine translation output. In Proceedings of the 15th In-ternational Conference of the European Association for Machine Translation (EAMT 2011), Leuven, Bel-gium, May.
Popovi´c, Maja and Hermann Ney. 2011. Towards au-tomatic error analysis of machine translation output. Computational Linguistics, 37(4), December.
Popovi´c, Maja. 2015. chrF: character n-gram F-score for automatic MT evaluation. In Proceedings of the Tenth Workshop on Statistical Machine Transla-tion (WMT 2015), pages 392–395, Lisbon, Portugal, September.
Snover, Matthew, Bonnie J. Dorr, Richard M. Schwartz, and Linnea Micciulla. 2006. A study of transla-tion edit rate with targeted human annotatransla-tion. InIn Proceedings of the 7th Conference of Association for Machine Translation in the Americas (AMTA 2006), pages 223–231, Cambridge, MA, August.
Toral, Antonio and V´ıctor Manuel S´anchez-Cartagena. 2017. A Multifaceted Evaluation of Neural versus Statistical Machine Translation for 9 Language Di-rections. InProceedings of the 15th Conference of the European Chapter of the Association for Compu-tational Linguistics (EACL 2017), Valencia, Spain, April.
Vilar, David, Jia Xu, Luis Fernando D’haro, and Her-mann Ney. 2006. Error analysis of statistical ma-chine translation output. InProceedings of the 5th International Conference on Language Resources and Evaluation (LREC 2006), Genoa, Italy, May.
White, John, Theresa OConnell, and Francis OMara. 1994. The ARPA MT evaluation methodologies: evolution, lessons, and future approaches. In Pro-ceedings of the 1994 Conference of Association for Machine Translation in the Americas (AMTA 1994), pages 193–205.