An evaluation of river catchment quality in relation to
restoration issues.
AHMED, Badria S.
Available from Sheffield Hallam University Research Archive (SHURA) at:
http://shura.shu.ac.uk/19204/
This document is the author deposited version. You are advised to consult the
publisher's version if you wish to cite from it.
Published version
AHMED, Badria S. (2004). An evaluation of river catchment quality in relation to
restoration issues. Doctoral, Sheffield Hallam University (United Kingdom)..
Copyright and re-use policy
Return to Learning Centre of issue
Fines are charged at 50p per hour
2 6 JUL
J U X V U l 1 V / - L i
ProQuest Number: 10694084
All rights reserved
INFORMATION TO ALL USERS
The qua lity of this reproduction is d e p e n d e n t upon the qua lity of the copy subm itted.
In the unlikely e v e n t that the author did not send a c o m p le te m anuscript and there are missing pages, these will be noted. Also, if m aterial had to be rem oved,
a n o te will in d ica te the deletion.
uest
ProQuest 10694084
Published by ProQuest LLC(2017). C o pyright of the Dissertation is held by the Author.
All rights reserved.
This work is protected against unauthorized copying under Title 17, United States C o d e M icroform Edition © ProQuest LLC.
ProQuest LLC.
789 East Eisenhower Parkway P.O. Box 1346
An Evaluation of River Catchment Quality in
Relation to Restoration Issues.
Badria. S. Ahmed
(A thesis submitted in partial fulfillment of the requirements of
Sheffield Hallam University for the degree of Master of
Philosophy)
Contents
ABSTRACT V
ACKNOWLEDGEMENTS VI
CHAPTER 1: INTRODUCTION 1
1. Introduction 2
1.1 Introduction 2
1.2 Study Area 3
1.3 Water Quality Control In UK 5
1.4 The History of The Rother and its Valley 6
1.4.1 Rhdne-Poulenc Chemicals Ltd. (Staveley Chemicals Ltd.) 13
1.5 Geological Information System (GIS) 16
1.5.1 The Origins and History of GIS 16
1.6 Research Programme 17
1.7 Aims and Objectives 18
1.7.1 Plan of Work 19
CHAPTER 2: LITERATURE REVIEW 20
2. Literature Review 21
2.1 Introduction 21
2.2 The Environment and the Attempts to Determine the Degree of Pollution 21
2.3. The Restoration of Contaminated Land 29
2.4 The River Rother 33
2.5 Initiatives Relating to the Restoration of the River Rother 37
2.6 Standards for soil contamination 39
CHAPTER 3: THE HEAVY METALS 42
3.1 An overview of Heavy Metals in the Natural Environment 43 3.2 Comments on the Chamalenitis of the environmentally significant Heavy Metals 45
3.2.1 Cadmium 45
3.2.2 Toxicity of Cadmium 46
3.2.3 Copper 46
3.2.4 Toxicity of Copper 48
3.2.5 Lead 49
3.2.6 Toxicology of Lead 50
3.2.7 Mercury 50
3.2.8 Toxicology of Mercury 52
3.2.9 Minamata Disease 54
3.2.10 Nickel 55
3.2.11 Toxicology of Nickel 56
3.2.12 Zinc 57
3.2.13 Toxicity of Zinc 58
3.3 Heavy Metals in the Environment and their sources 59
3.4 Sources of Heavy Metals 60
CHAPTER 4: METHODOLOGY 63
4. Methodology 64
4.1 Introduction 64
4.2 The Research Sampling Plan 65
4.2.1 Visiting the River 65
4.2.2 Sample Locations 66
4.2.6 Summary of Method 71
4.3 Sample Analysis 71
4.3.1 Mercury Analysis - 73
4.4 Atomic Absorption Spectroscopy (AAS) 73
4.4.1 Instrumental Parameters Used 73
4.5 Inductively Coupled Plasma ICP 74
4.5.1 ICP Properties 74
CHAPTER 5: RESULTS AND THEIR INTERPERTATION. 75
5. Results 76
3.2 Presentation of Tables and Figures 76
5.2 Interoperation of Results 100
5.2.1 Levels of contaminations 100
5.2.2 Trigger values of contamination 102
I) tu p t o n 103
II) WHITTINGTON MOOR 1 103
III) WHITTINGTON MOOR 2 103
IV) STAVELEY 103
V )HAGUE 103
VI) RENISHAW 104
VII) KILLAMARSH 104
VIII) BEIGHTON 104
IX) CATCLIFFE 104
X) ROTHERHAM 104
XI) DON 1 105
XII) DON 2 105
CHAPTER 6 : DISCUSSION 106
6. Discussion 107
6.1 Introduction 107
6.2 The DEFRA Standards 113
6.3 The New Dutch List 117
6.4 Recommendations 119
6.4.1 Clean Up Technology 119
6.4.2 Re-use of the contaminated sites 120
CHAPTER 7: CONCLUSION 123
7. Conclusion 124
7.1 Limitations 127
7.2 Recommendations for further studies 127
REFERENCES 129
Tables and Figures:
Table 1-1 Old and new classification 6
Table 1-2 The estimation of loss levels of mercury from the chlor-alkali system 13 Table 1-3 List one substance as detailed in Directive 76/464/EEC. 15 Table 2-1 The use of land after reclamation (1982 - 1988). 32 Table 2-2 The use of land after reclamation (1988 - 1993) 32
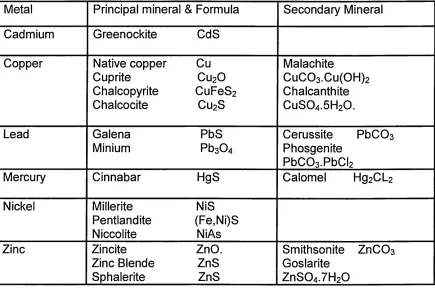
Table 3-1 Heavy metals minerals 43
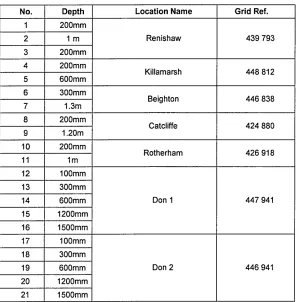
Table 4-1 First phase site description and sub-samples sites 66 Table 4-2 Second phase site description and sub-samples sites 67
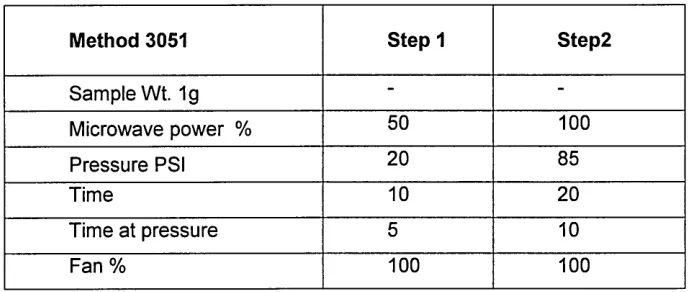
Table 4 3 The parameter of the microwave oven 71
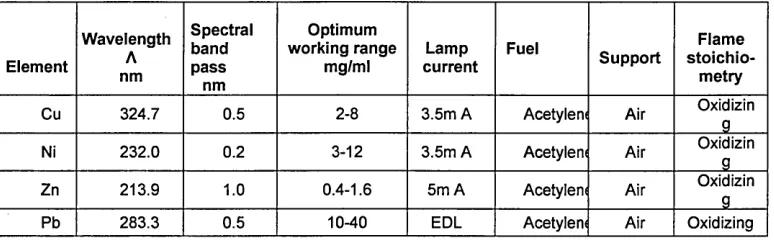
Table 4-4 Atomic Absorption Spectrometry parameters 73
Table 4-5 Inductively Coupled Plasma properties. 74
Table 5-1 Sample sites used for phase 1 analysis 78
Table 5-2 Table containing total chemical analysis data from phasel study 81 Table 5-3 Table of data and illustrative graphs showing the heavy metals concentrations in floodplain soils of phase 1 surface samples between Tupton and Hague 82
Table 5-4 Site No. 1: TUPTON. 83
Table 5-5 Site No. 2 WHITTINGTON MOOR 1 84
Table 5-6 Site No. 3- WHITTINGTON MOOR 2 85
Table 5-7 Site No. 4 - STAVELEY 86
Table 5-8 Site No. 5- HAGUE 87
Table 5-9 Sample sites used for phase 2 analysis. 88
Table 5-10 Table containing total chemical analysis data from phase 2 study. 91 Table 5-11 Table of data and illustrative graphs showing the heavy metals concentrations in floodplain soils of phase n surface samples between Renishaw and Rotherham 92
Table 5-12 Site No. 1 RENISHAW 93
Table 5-13 Site No. 2 KILLAMARSH 94
Table 5-14 Site No. 3 BEIGHTON. 95
Table 5-15 Site No. 4 CATCLIFFE 96
Table 5-16 Site No. 5 ROTHERHAM. 97
Table 5-17 Site No. 6 DON 1 98
Table 5-18 Site No. 7 DON 2 99
Table 5-19 Kelly Indicators of contamination 100
Table 5-20 Results of phase 1 samples before upstream flooding and phase 2 samples
Following major flood 101
Table 5-21 The New Dutch list of trigger values of heavy metals 102 Table 6-1 comparative results obtained from different studies in Rother catchment 110 Table 6-2 Indicative levels of contamination for Lead and Zinc. 111
Figure 1-1 Map showing the River Rother from Clay Cross to Rotherham 4 Figure 1-2 The distribution of industrial sites along the River Rother in 1850. * 9 Figure 1-3 The distribution of industrial sites along the River Rother in 1900. 10 Figure 1 -4 The distribution of industrial sites along the River Rother in 1960. 11 Figure 1-5 The distribution of industrial sites along the River Rother in 2000. 12 Figure 1-6 Levels of mercury in discharged water entering the River Rother 15
Figure 3-1 Cadmium Cd 45
Figure 3-2 Copper Cu 46
Figure 3-3 Lead Pb 49
Figure 3-4 Mercury Hg 50
Figure 3-5 Nickel Ni 55
Figure 3-6 Zinc Zn 57
Figure 4-1 A map showing the samples at first and second phases. 68 Figure 5-1 A map show the sample sites between Tupton and Hague 79 Figure 5-2 Sketch plan for sites 1-5 of phase 1 sample sites. 80 Figure 5-3 A map show the sample sites between Renishaw and Rotherham. 89 Figure 5-4 Sketch plan for sites 1-5 of phase 2 sample sites. 90 Figure 6 -1 Graph to illustrate the position of the two contamination zones along
the River Rother. 111
Abstract
Soil samples from the surface and subsurface of the floodplain of the River Rother were analysed for selected heavy metal concentrations at 12 locations along the river in order to discover whether the high concentrations, reported in previous studies from 1982 to 2002, had changed. The aim was to review the levels of heavy metal contamination along the floodplain of the Rother.
Thirty-seven soil samples were taken along the River floodplain, at different sites and from different depths, collected in two phases. Samples collected, were dried, ground, digested and analysed by Atomic Absorption (AA) and Inductively Coupled Plasma (ICP) techniques.
While the results from up-stream sites were mainly satisfactory, according to the New Dutch List Standard and Kelly Indices, the results obtained from downstream sites were variable probably due to a flood event (November 2002) and/or earlier tipping of wastes.
Previous research identified a major heavy metal contamination plume within the sediments along the Rother. By 1995 the plume appears to have divided with one part migrating faster and therefore separating from the second (Duty, 1995). This is further supported by the evidence presented for lead and zinc (Figure 6.1). The present study confirms the two plumes at Renishaw and at Catcliffe indicating a further migration even over the short timescale.
Natural hydrological cleansing processes will continue to operate but may accelerate with increases in periods of heavy rainfall causing more flood episodes to occur. Even though there is metal contamination it is not having a deleterious effect on the biodiversity present along the river corridor.
Recommendations for reclamation are presented for the purpose of cleaning up the contamination and reusing the derelict land in some meaningful way. The areas of heavy contamination have been subject to major clean-up processes involving not only the removal or burial of the metals but re-landscaping the sites to make them suitable for active recreation. Examples of such reclamation have been completed at Poolsbrook and Rother Valley Country Park and are still being carried out at the present time at the Avenue site and at Orgreave.
The implications for the future use of the river corridor as part of the leisure and tourism scene look very good as the worst sites are reclaimed and the others are given over to passive recreation and conservation.
Acknowledgements
I would like to express my gratitude to my supervision team
Dr. Ian Rotherham, Dr. Frank Spode, Keith Woodhouse for their valuable advice, help and encouragement throughout this research. Also, my thanks to Joan Butt, Julian Gillott and Paul Collins.
Many thanks are expressed to Prof. Alan Griffith, Dr. Paul Stephenson, Anne Wilson, Susan Biggin and all Unit 9 staff for being friendly.
I would also like to thank the Environment Agency and Sheffield Public Library for their valuable information.
1. Introduction
1.1 Introduction
The industrial revolution and associated developments in the United Kingdom during the eighteenth and the nineteenth centuries are recognized as having a huge impact on the environment (Goudie, 1977). Associated with these impacts significant contamination occurred on land and water around the affected sites (Goudie, 1977), especially in areas where heavy industrial plants were established.
Since heavy metals do exist naturally in the environment, emitted from natural sources, they are generally of low concentrations. However, greatly increased concentrations may occasionally cause a problem. This may lead to their incorporation into the food chain by methylation, which occurs in side reactions in plants and in contaminated sediments. One of the most disturbing aspects of this phenomenon is not the incorporation of the heavy metals into the food chain at ambient water pollution levels, but of their incorporation into concentration gradients that occur in both plants and bio-concentration (DoE, 1976).
The River Rother and its catchment was one such area affected (EA, 1990s reports). As a sequence of industrial developments in the late eighteenth century and early nineteenth century led to a period of gross pollution of this environment it was converted to a grossly polluted river with associated river landscape features substantially degraded.
A number of studies have been carried out over the last twenty years to measure and evaluate the heavy metals and other contamination of the sediments of the Rother and the other associated local rivers. These include the rivers Hipper, Whitting, Drone, and Doe Lea.
Trent catchment to the south-east (Figure 1-1 shows the River Rother Clay Cross to Rotherham).
1.2 Study Area
The River Rother, which lies within the southern operating division of the Environment Agency (EA) and Yorkshire Water pic - formerly Yorkshire Water Authority (YWA), flows from the south of Chesterfield to Rotherham (Murfin,
1988).
Figure 1-1 Map showing the River Rother from Clay Cross to Rotherham
Rotherham
I | Canklow
Catcliffe | |
Woodhouse [
Beighton j~]
Killamarsh
H Renishaw
Staveley
Chesterfield
Clay Cross Q ]
1.3 Water Quality Control in UK
Responsibility for controlling water pollution has been exercised by different organizations in different parts of the United Kingdom. In mainland Scotland, it rests with the seven river purification authorities, and the Scottish Islands Councils. In Northern Ireland, protection of river quality is a function of the Department of the Environment for Northern Ireland.
In England and Wales, control of water pollution was until recently the responsibility often water authorities, which were established in 1974 but on 1st September 1989 this responsibility passed to the National Rivers Authority (NRA) as a new independent body established under the provisions of the Water Act 1989.
As well as its pollution control activities, the NRA’s responsibilities included the management of water resources, the protection of land and property from flooding, the promotion of nature conservation and recreational activities, and the maintenance and development of inland fisheries.
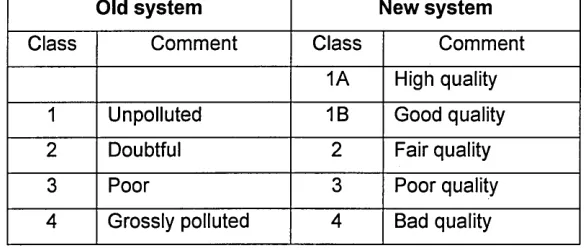
Since 1958 a series of surveys has been carried out to assess the quality of rivers water, canals and estuaries in England and Wales. A survey was completed in 1990 that used a classification scheme in which four quality categories were identified (table 1-1).
1n April 1996 the NRA became the Environment Agency (EA) but retained the same activities and responsibility of controlling the water resources in England.
The 1990 River Quality Survey showed that river and estuary quality in the UK was generally very high (Anon, 1996). The National Rivers Authority (NRA) reported that of nearly 40,000 kilometres of rivers surveyed in England and Wales, almost 90% was classified as being of good or fair quality.
Old system New system
Class Comment Class Comment
1A High quality
1 Unpolluted 1B Good quality
2 Doubtful 2 Fair quality
3 Poor 3 Poor quality
4 Grossly polluted 4 Bad quality
Table 1-1 Old and new river classification (Environment in Trust. 1990).
This research considers the pollution in light of Netherlands Standards for Soil Contaminations, the Department for Environment, Food and Rural Affairs (DEFRA) standards, and inorganic contaminants of soils in England and Wales (1998) (see Appendix 5).
1.4 The History of the Rother and its valley:
Industrial pollution of the River Rother dates back to the middle of the eighteenth century after the industrial revolution started in England. This had a huge impact in both Derbyshire and Yorkshire. The area abounds with water resources such as rivers, and energy resources such as coal. In the early eighteenth century, the Rother and Upper Don Valleys were still providing some of the finest countryside in the area.
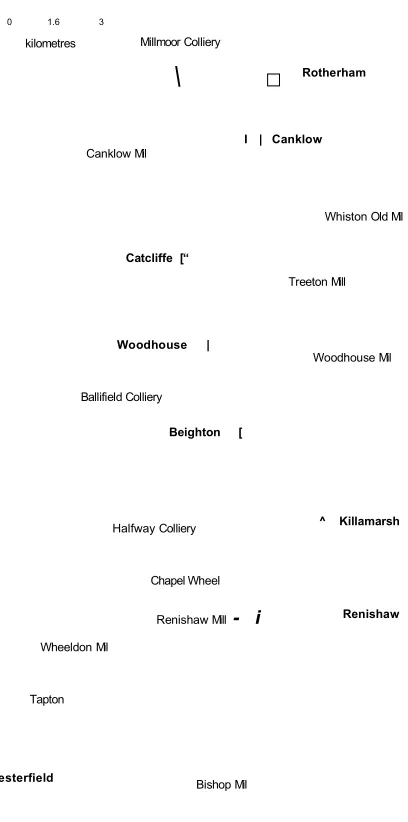
[image:16.612.121.413.20.145.2]Much of the industrial pollution of the past has come from steel, mining, chemical works and sewage treatment works. The following pages contain maps showing the historical background to Rother industrial purposes. (Fig 1-2, 1-3, 1-4 and 1-5).
In 1850 (Fig 1-2), the River Valley was dominated by water-powered mills, some of which were corn mills while others were used for iron and steel trades. Some collieries, such as Grassmoor, Halfway, Ballifield and Millmoor, were in operation by 1850 and were discharging mine waters to the Rother.
The valley formed the routeway of the Great Central Railway Company to build its line linking Nottingham with Chesterfield and Sheffield prior to 1850.
During the later part of the nineteenth century massive industrialization took place, led by the Victorians, who sank collieries and created iron and steel works along the Rother Valley. Coal processing was commonplace for the production of coke.
All these industries used water from the river and also discharged their waste back into the river.
During the Victorian period the Midland Railway Company expanded its system by adding new lines between Derby, Clay Cross, Chesterfield and Rotherham. This line serviced most of the collieries along the Rother valley and facilitated the export of the coal to other parts of Britain.
Increases in the working population was catered for by an expansion in house building and the development of improved sewage systems leading to increased discharges from the various sewage works sited along the valley floor.
smaller industrial and business parks or for recreational space, such as at Poolbrook and Rother Valley Country Park.
Other sources of pollution that now affect the water quality in the area are abandoned mine waters, contaminated land and agriculture. In addition to the industrial contamination sources was the combined effect of organic pollution (Table 3) resulting from inadequately treated sewage (Firth, 1997).
Figure 1-2 The distribution of industrial sites along the River Rother in 1850.
0 1.6 3
kilometres Millmoor Colliery
\
□
RotherhamI | Canklow
Canklow Mil
Whiston Old Mil
Catcliffe [“
Treeton Mill
Woodhouse |
Woodhouse Mil
Ballifield Colliery
Beighton [
^ Killamarsh
Halfway Colliery
Chapel Wheel
Renishaw
Renishaw Mill - i Wheeldon Mil
Tapton
Chesterfield Bishop Mil
Wlngerworth Mil
Grassmoor Mill
srassmoor Colliery
^ M il
Figure 1-3 The distribution of industrial sites along the River Rother in 1900.
Rotherham
Canklow
Catcliffe | |
Orgreave Colliery
Coke Works ■Treeton Colliery
Woodhouse f
Woodhouse Mill
iedgrave Mil
Beighton Q
Holbrook Mil
Q Killamarsh
^ Renishaw
Tapton Mill
~] Staveley
Chesterfield Bishop Mil
Baytharpe Colliery
Iron Works
Grassmoor Mil
Grassmoor Colliery
Clay Cross Q
(§) Calliery
Figure 1-4 The distribution of industrial sites along the River Rother in i960.
Rotherham
I | Canklow
British Steet
Handsworth Colliery
tcliffe Q
(♦)— Treeton Colliery Orgreave Colliery ®
Coke Works
Woodhouse [
Beighton Brookhouse Colliery Shirebrook Colliery
High btoor Colliery Beighton [
Haltway Colliery
Barrowhili Colliery ^ Renishaw
Staveley Works
''Renishaw Colliery Sheepbridge Works
Chesterfield Ireland Colliery
Williamthorpe Colliery
B olsover Colliery
Engineering Works
Avenue Coke Works
srassmoor Colliery
Clay Cross Q
Crown copyright Ordnance Survey. An Edina Digimap / JISC supplied service.
Figure 1-5 The distribution of industrial and reclaimed sites along the river Rother in 2000.
Rotherham
Killamarsh
Kilometre.? J Canklow
Orgreave Opencast M ne Reclamation
C a tclrtfe
Rother valley Country Park Woodhouse [ |
Beighton [_
S taveley W orks
Sheepbndge Industnal Park
Chesterfield
Poolbrook Country Park
| £ j l
Renishaw
Staueley
Ao/enue Industrial Park
Clay Cross | |
Industrial Plants j J g Reclaimed Sites
J , M il Colliery ^ Sewage W orks
1.4.1 Rhone-Poulenc Chemicals Ltd. (Staveley Chemicals Ltd.)
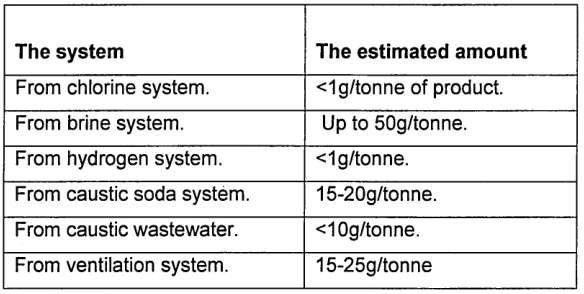
Rhone-Poulenc Chemicals Ltd., formerly Staveley Chemicals, occupies a single site covering an area of 75 hectares and houses administrative offices and four principle manufacturing units: sulphuric acid and chlor-alkali plant, benzole-benzene refinery and dichloroaniline plant (Anon., 1993).
The most significant on the site was the chloro-alkali plant, established in 1921, which produced several kinds of chemicals for trade purposes including chlorine, caustic soda, hydrogen and sodium hypochlorite. These are reagents utilized in chemical manufacture, water treatment, disinfection and bleaching. The pollution occurred because the plant was discharging its effluent into the river following insufficient treatment (Duty, 1995).
The annual levels of the mercury amount lost from the chloro-alkali system have been estimated to be:
The system The estimated amount
[image:23.612.142.434.360.507.2]From chlorine system. <1g/tonne of product. From brine system. Up to 50g/tonne. From hydrogen system. <1g/tonne. From caustic soda system. 15-20g/tonne. From caustic wastewater. <10g/tonne. From ventilation system. 15-25g/tonne
Table 1-2 The estimation of loss levels of mercury from the chloro- alkali system (Duty 1995).
Pathways of mercury loss from the plant may be as follows (Biokon, 1978):
1. Dissolved mercury escapes with the gaseous chlorine and hydrogen, and the aqueous sodium hydroxide products.
2. Mercury vapour is lost from the intermediate and end boxes of the electrolysis equipment.
4. Mercury dissolved in wash water requires separate treatment.
The total losses from a typical system have been estimated to be 200g per tonne of chlorine the equivalent to a 5% loss of the annual inventory (Harrison, 1992). It was estimated that the total mercury burden on the Rother might have been over 4 tonnes of mercury since the plant was established in 1921.
In recognition of the problems associated with pollutants in general, The European Community introduced Directive 76/464/EEC, known as the (Dangerous Substances Directive). The European Community issued two Directives relating to mercury emission into water in the early 1980s (Barfield, 2001). The Directive, which is of greatest interest, is (Dangerous Substances Directive 76/464). This Directive seeks to establish a framework for the elimination or reduction of specified pollutants in inland, coastal and territorial waters.
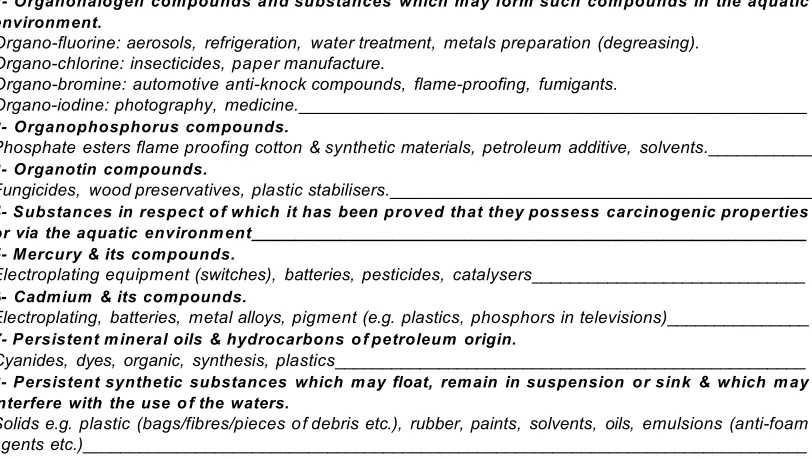
The Directive spawned several pollutant specific papers. The proposal that affected the Rother was the Council Directive on the control of list one substances (Table 3) particularly the directive 82/176, (proposed 14/6/79), “Limit values and quality objectives for mercury discharges by the Chlor-alkali Electrolysis industry”.
This Directive is concerned with only mercury from List One.
1- Organohalogen compounds and substances which may form such compounds in the aquatic environment.
Organo-fluorine: aerosols, refrigeration, water treatment, metals preparation (degreasing). Organo-chlorine: insecticides, paper manufacture.
Organo-bromine: automotive anti-knock compounds, flame-proofing, fumigants.
Organo-iodine: photography, medicine.______________________________________________________
2- Organophosphorus compounds.
Phosphate esters flame proofing cotton & synthetic materials, petroleum additive, solvents.___________
3- Organotin compounds.
Fungicides, wood preservatives, plastic stabilisers._____________________________________________
4- Substances in respect of which it has been proved that they possess carcinogenic properties or via the aquatic environment_______________________________________________________________
5- Mercury & its compounds.
Electroplating equipment (switches), batteries, pesticides, catalysers_____________________________
6- Cadmium & its compounds.
Electroplating, batteries, metal alloys, pigment (e.g. plastics, phosphors in televisions)_______________
7- Persistent mineral oils & hydrocarbons of petroleum origin.
Cyanides, dyes, organic, synthesis, plastics__________________________________________________
8- Persistent synthetic substances which may float, remain in suspension or sink & which may interfere with the use of the waters.
[image:25.612.81.487.21.250.2]Solids e.g. plastic (bags/fibres/pieces of debris etc.), rubber, paints, solvents, oils, emulsions (anti-foam agents etc.)_____________________________________________________________________________
Table 1- 3 List One substances as detailed in Directive 76/464/EEC, including examples of origin (Blanksby & Doncaster, 2000).
The T M R effectiveness
87 88 89 90 91 92 93 94 95 96 97
Year
Figure 1-6 Levels of mercury in discharged water entering the River Rother
In other words, implementation of controls following the EC Directive has succeeded in bringing mercury levels in the river water down to acceptable levels. However, the mercury levels in the river Rother sediments were still high in the late 1980s (Murfin, 1988).
full recovery of the Rother to an acceptable amenity standard could not occur in the near future.
The Environment Agency (EA), which was formerly called the National Rivers Authority (NRA), had a big role to play in improving the Rother by setting tough standards for effluent discharges in relation to quality objective and standards set for the receiving waters.
1.5 Geographical Information System (GIS)
It is useful to introduce the Geographical Information System (GIS), in terms of background to the system and its potential to publish the maps used to represent the history of the Rother and its valley. Also the program is used to show the sites along the River.
The Geographical Information System (GIS) is a computer-based system to input, store, manipulate, analyse and output spatially referenced data. The program can be used aid to the study of ecological phenomena (Wadsworth and Treweek, 1998).
Maps have always per-formed an important role in environmental study and will no doubt continue to do so. It is therefore worth considering what it is that makes GIS potentially more useful than straightforward paper maps in the study of ecological phenomena.
1.5.1 The Origins and History of GIS
Historically maps have been used to obtain spatial information about the world. In fact, until relatively recently, the paper maps, sometimes with a memoir, were the only form of spatial database that existed. Maps have been around since the dawn of civilization and GIS with its roots in mapping technology has a surprisingly long history (Maguire et a!., 1991) (Wadsworth and Treweek, 1998).
of these limitations. As well as making it quicker, easier and cheaper to produce and update maps, additional benefits of automation soon became apparent. These included the ability to create maps for specific users, experiment with different graphic representations, facilitate interactions between statistical analyses and mapping and more easily control the effects of classification and generalisation on the quality of input data.
While GIS evolved out of the application of computers to cartography, GIS and digital cartography should not be considered identical. A GIS does not actually contain maps: rather it contains the information from which maps can be generated. A GIS can also be distinguished from database management systems or from visualization packages through its specialized capability for spatial analysis. As well as new ways to produce maps, new ways to collect and process data have appeared over the last few decades. These include satellites, which provide synoptic information over large areas at frequent intervals, and global positioning system (GPS), which allow for the collection of point data without the need for an extensive and expensive ground control network. For environmental scientists, the availability of new sources of data combined with the GIS technology needed to store, interpret and display it has opened up whole new areas of research and application.
1.6 Research Programme
The major aim of this research is the evaluation of the quality of floodplain sediments along the valley of the River Rother in relation to the contamination and recovery of a major industrial river catchment.
1.7 Aims and Objectives
The research has a number of primary aims:
The first is to enhance the understanding of the role of industrial contamination in the functioning of the river catchment, and its implications for conservation and economic regeneration.
This aim has three main secondary components:
1. To evaluate the contaminated floodplain soils in a major river catchment; 2. To assess the pollution impact of aquatic habitats and adjacent
floodplain;
3. To understand the implications of the historical aspects of (1) and (2) for any resolution of the environmental conditions of the catchment, and in particular for conservation, leisure and tourism use.
To achieve these several aims key objectives were set:
1. To carry out a desk study and literature search of previous work on the Rother;
2. To evaluate the location of industrial contamination sources along the catchment;
3. To examine the links between the historical contamination and the present day environment;
4. To review information on the contamination up to the present time;
5. To carry out site sampling of the River Rother watercourse (selected floodplain soil samples);
6. the development of a “model” to determine the downstream migration of pollutant and any influence of trapped contamination.
At the outset of this project, the River Rother had recently suffered a 1 in 100 years flood episode.
1.7.1 Plan of Work
In order to organise the necessary work and achieve the project objectives, a plan was made with two broad areas of work: theoretical and practical. The theoretical work included the critical literature review, information analysis and a detailed site assessment.
For the determination of appropriate methodology, the focus was to find an appropriate sampling strategy, and assess appropriate methods of analysis for critical pollution and carry out necessary evaluation.
The practical work included visiting the sites and both collecting and analysing the samples.
Core samples were taken from the sediments at the selected sites along the river floodplain. These were as near as possible to those sites used in earlier studies.
Plan of work:
Literature Review: (see Chapter 2, p. 21, and Chapter 3, p. 43) Developing Methodology: (see Chapter 4, p. 64)
Sampling Techniques: (see Chapter 4, p. 65) Analysis Techniques: (see Chapter 4, p. 70)
A scene-setting chapter ranging over the attributes of the River Rother and the history of industrialization along the valley which has caused the heavy metal pollution of the flood-plain sediments.
2. Literature Review
2.1. Introduction
The River Rother and its tributaries have a reputation for being one of the most contaminated rivers in England. In the late 1980s 33km of its length were classified as "poor" (Edwards, 1990). As a result, many studies have been carried out to survey the river sediments and its floodplain for heavy metal contamination.
Heavy metal contamination on a global scale is widely distributed in both surface and underground sediments such as rivers, lakes and wells. This reflects industrial developments around the world especially in the industrialised countries. Many studies have been carried out on this issue.
This literature review is organised historically in order to help the reader follow the sequence of published work and that done, in the area, over five year intervals. Work to address contaminants in local water sources has been similarly arranged in chronological order.
2.2 The Environment and the Attempts to Determine the Degree of
Pollution
The decision to evaluate the quality of the soil and water resources started in the middle of this century. The assessment of previous industrial sites and their contamination problems was the main goal for many researchers who were concerned with environmental issues. However, the environmental issues were taken from different aspects in order to assess their importance to the human need and safety. The researchers deal with this issue according to their interests and concerns.
“Like ecology, the environmental science is multi- and interdisciplinary” (Ehrlich
et al., 1977). The author builds his book on three main sub-disciplines of environmental science and they are: population, resources and environment.
function of two factors: the human growth population and the environmental impact per person. These factors vary greatly among and within countries, mainly depending on the nature and level of industrialisation (Freedman, 1995).
The natural resources that are available to sustain human activities include; nonrenewable resources that exist in a limited supply, which are consumed by mining and use, and renewable natural resources that can provide a flow of materials or energy that are sustainable over the longer time. This can happen if the resources are managed correctly. However, unsuitable management or over-exploitation of any potentially renewable resource may corrupt it irrevocably.
The third sub-discipline is the environment. This sub-discipline of the environmental science deals with the ways in which the integrity of the biosphere, and of purely human environments, is affected by various anthropogenic and natural influences (Freedman, 1995).
The author (op.cit) states “the effects of pollution, disturbance and other stresses on natural and managed ecosystem are the primary subject material of this book. Although the purview of “environment” also includes the direct effects of pollution and other stresses on the health of humans, and their constructed environments in some respects these are not ecological issues because they do not deal with natural ecosystems and wild species” (Freedman, 1995, p. 1-2). Nevertheless, a number of key aspects of these anthropocentric topics were addressed, especially with respect to air contamination, toxic elements, pesticides and warfare.
Balogh et a l (1999) was a study that took place on Lake Pepin. This is a natural lake on the Upper Mississippi river in the USA. In order to determine historical trends in mercury (Hg) accumulation in the lake, sediment core samples were taken for analysis. It was found that the whole-basin Hg accumulation rates increased from 3 kg/yr before European settlement
(ca. 1830) to maximum of 357 kg/yr in 1960s.
The authors state ’’the recent Hg accumulation rate (110 kg/ yr, 1990-1996) was experimentally indistinguishable from measured Hg loadings in the River entering the Lake, indicating that accumulation rates in Lake Pepin correspond quantitatively to river loadings” (Balogh etal., 1999, p.3298).
The current growth rate represents that there is a decline of approximately 70% from the peak value, reflecting large decreases in Hg inputs to the Mississippi River from industrial and public point sources in the metropolitan Minneapolis/ St. Paul area upstream. A sum of 18.1 t of Hg has been deposited in the Lake since 1800; half of that (9.0 t) was deposited between 1940 and 1970, when regional growth accelerated quickly but pollution control mechanisms were insufficient. Point sources accounted for approximately 60% of the Hg accumulating in Lake Pepin in the 1960s. However, these inputs have been practically eliminated since that time.
This study showed the cumulative relation between the rapid regional growth and the increase of the mercury pollution in the river sediments.
In his study, Eastwood (1987), described lead and its sources in the environment. Soil sampling and surveying (sampling technique) were based on taking transects and point samples from within a 1 km reference grid proved to be popular and were used efficiently.
Soil depth was an important factor in this research where different depths were taken in order to determine the lead concentration at different depths.
Polythene bags were used to collect soil samples. Air-drying was recommended, because the oven drying tended to increase moisture absorption. The results of tests recommended that soil should be kept moist and aerobic during storage, in order to facilitate restoration to a metastable state on addition of water, which is of particular importance in the analysis of plant existing lead. Flame atomic spectroscopy was considered to be the most popular technique, with flameless technique increasing in popularity.
In the north of France, large amounts of heavy metals such as zinc, lead and cadmium in suburban areas have become an increasing problem for several years (Frangi and Richard, 1997). The main aim of the author’s paper was to present the cartography of pollution by heavy metals to analyse the scale of contamination. The pollution was fairly high as a result of the discharge from metallurgical industries of heavy metal in numerous chemical forms during the smelting of non-ferrous metals.
The study area is situated in the north of France between Lens and Douai (Nord Pas de Calais, France), which covers about 100km2 and involves approximate 60, 000 people. Natural content of heavy metals in soil in this area is estimated to be at < 40 ppm for lead and <0.6 ppm for cadmium (Luttringer and de Cormis, 1979). All along the same axis, 150 samples were taken and located at 1, 1.5, 2,3, 4, 5, 6, and 7 km from the main source.
The authors reported that: the results were treated statistically to demonstrate both concentration and spatial distribution. The soil samples were analysed by standard techniques of The France Normalisation Association (norm AFNOR NF X 31147). The concentrations of lead and cadmium were measured by flame atomic absorption spectrometry (Hitachi model AAS 180-70) and the accuracy is of 10% for the lead and 5% for the cadmium. The spatial representation of lead and cadmium concentrations shows the degree of the pollution and its distribution.
during a field experiment. The spatial representation resulting from these studies enables the researchers to associate a concentration to each spatial point at a given time” (Frangi and Richard, 1997, p.77).
A spatial and temporal study would enable the researchers to evaluate the evolution of the contamination level. It would be possible to use biomonitoring, X-ray fluorescence, or to associate both methods. A monitoring network providing regular data would enable the researchers to combine in-situ
measurements with GIS to create thematic maps. The implementation of different kinds of measurements with GIS would improve our understanding of the dynamics of pollution. Finally, information on data required at regular intervals would allow the researchers to quantify the transported amounts and to follow the extent of the polluted zone, by use of an appropriate model, also to anticipate and to take appropriate decisions concerning public health.
As norms were expressed in total contents without distinction between chemical species, the metal concentration in the environment is not the only parameter that must be accounted for in the evaluation of risks and the improvement of the regulations. For this reason, the AFNOR norm U44-041, which is applied to the spreading in agricultural soils of sludge resulting from wastewater treatment stations, cannot express a real level of pollution, as it does not take into account bio-availability. Therefore it is essential to define other parameters, such as speciation, physical and chemical properties of soil and water to obtain a real idea of the extent of the contamination.
Bitterfeld region covering ca. 3700km2. Detailed analyses of the soil-borne contamination pattern using a sequential extraction scheme showed a generally low mobility and potential bioavailability, which can be traced back to the relatively high average pH of the soils. In this paper, the researchers had used different techniques to analyse and measure the heavy metals in soil such as:
• The acid-soluble fraction of metals in the soils was measured using the aqua regia dissolution method.
• The solutions obtained were measured with inductively coupled atomic emission spectrometry (ICP-AES).
• Quantitative analysis of the entire metal content was pre-formed using angular depressive X-ray fluorescence analysis (WDXRF).
• Sequential extraction was used to better estimate the contaminant potential caused by pollution.
• The very low concentrations of heavy metals (like Cd, Pb) in the solutions were measured using graphite furnace atomic adsorption spectrometry (GF-AAS).
• The other elements were determined with (ICP-AES)”.
This paper represented valuable techniques to determine the concentration of heavy metals in soils, providing an opportunity to review some of them in order to use them in this research.
also clearly increased in the mined areas due to an increase in adsorption sites. The groundwater in the immediate surroundings of old mines that processed ore on-site is heavily contaminated while the aquifer serving the town of Chloride actually remained unaffected by any contamination from the upstream historical mining areas. Roesener (op. cit) reports, “Three explanations can be considered for the very low concentration of heavy metals in the Chloride groundwater. The first explanation would be the influence of specific solubility and mobility of heavy metals in soil and groundwater on their transfer (Brummer
et al., 1986; Schachtschable et al., 1992; Hutter, 1994). Therefore the heavy metals could be immobilized in the soil by chemical reaction and adsorption. A second possible explanation is a dilution effect after the rainy season in the spring. A third explanation would be that there is no groundwater flow from the nearby mining district east of Chloride to the town's aquifer. This seemed the most likely reason, as the groundwater in the proximal mountain foothill zone is found in the fractured and weathered zone of the Precambrian igneous and metamorphic rocks” (ADWR, 1990).
Mining sites are one of the very dangerous locations for chemical contamination. This is because the abandoned tailings can extend contaminants in surrounding regions and can affect soil, water and wildlife adversely (Barafieri and Dadea, 1998). Samples were collected next to and away from the mine tailings. The whole concentrations in contaminated sites represent the starting point with the aim of evaluating the pollution levels.
In this paper, a simplified procedure of sequential extraction was used for the analysis of heavy metal mobility. The results were compared with a model of three levels of risk for hazard evaluation based on the mobile species obtained with the sequential extraction mentioned before.
The authors conclude that the area examined was not highly contaminated so risks for humans could be limited, however, the spread of these toxic metals in the longer term in nearby areas can increase the levels of contamination thereby compromising soil quality.
pollution was a nearby chlor-alkali plant. The results of experiments indicated that some of the reactive mercury is changed into organo-mercurials by micro organisms. The major transformation process of mercury occurs in the bed load sediments. Organo-mercurials are released from bed-load sediments into the river water because of low adsorption characteristics of solid matter. The release of some surfactants from sugar mill waste into the river causes a local increase of mercury in the water. Also there was an obvious decrease in organic mercury in the bed-load sediment at the end of the research, which may indicate a process of reduction via surfactants.
This study represented the mercury pollution problem in the rivers and its catchments and provided information about the mercury changing into organo-mercurials by microorganisms that helped to understand the phenomena.
In 1999 Marice et al. report that mercury contamination due to the amalgamation of gold in small-scale mining is an environmental problem of increasing concern, mainly in tropical regions like the Amazon, where a new boom of such gold mining started in the 1970s. In Brazil, research into these problems has been carried out for many years, but there is no existing data for Bolivia. This article surveys mercury contamination of a Bolivian river system in the Amazon drainage basin, measured through samples of water, fish, and human hair. High concentrations in fish and human hair from consumers of carnivorous fish species are reported. The possible health risk from eating was obvious in people living downstream of gold-mining activities, but not in the mining population itself.
from the pollution source. A method for the determination of the major migration forms of mercury in river water was proposed. A procedure for the determination of organic and inorganic forms of mercury at a level of 0.2 mg/l was developed.
The study showed obviously the relation between mercury pollution and, the hydrological regime and the distance travelled from the pollution source.
2.3 The Restoration of Contaminated Land
Papassiopi et al. in 1997 started research aimed to assess the use of EDTA for the elimination of heavy metals from contaminated soils in Greece. Soil samples were taken from contaminated sites. These sites were past mining and smelting activities in Lavrion, Greece. The samples were calcareous and contained variable levels of contaminants, ranging from 35,000 down to 500 mg/kg in Pb. The extraction of lead was found to vary for different soil samples (from 50% to 98%). Zinc and cadmium extraction was under 50% for the majority of samples examined. The residual concentrations of metals that followed the two stage treatments were above the limits that were set by the international organisations for soils. However, the metals that were able to leach out were efficiently removed and treated soils were all acceptable in terms of toxicity.
The authors (op.cit) report, “This experimental work has demonstrated that the soil matrix is of great importance for the overall evaluation of the EDTA leaching as a cost effective remedial option. The simultaneous dissolution of calcite was found to consume approximately 90% of the available EDTA”. Therefore, it was concluded that for the treatment of calcareous soils, the criteria design and the estimated cost should be based on the calcite content of the soil.
Corps of Engineers, working in conjunction with the EPA and other appropriate federal, state and local agencies (Deason, 2001).
The lower Passaic River in New Jersey, which is located in the heart of the U.S.A. industrial revolution that began in the late 19th century, was identified as a guide project area for the Urban River Restoration Initiative.
In 2000, the first step to activate the initiative on the lower Passaic River was undertaken.
The author (op.cit) reports:” since publication of the landmark National Research Council report Contaminated Marine Sediments: Assessment and Remediation in 1989, much has been learned about how to address contaminated urban waterways. One of these learning points is that remedial technologies alone will not solve the problem. Solution must consider aspects of source reduction, natural attention, insitu containment and treatment, dredging, ex-situ treatment and other technological and institutional tools. All these solution components must be considered in the context of appropriate human health and ecological risk considerations, cost-benefit considerations, and a host of other relevant waterway restoration factors”.
Because of the extent of the contamination problem and its important reflux on the environment generally, many attempts of treating and redeveloping derelict and contaminated sites has been published. Published works primarily address the technical issues and give limited attention to the financial issues involved, such as Cairney (1987) and Fleming (1991).
Contaminated sites have formerly been used for a large range of purposes, often over a period of several centuries. Throughout this time, the use may well have changed and quite often buildings may have been constructed over the remains of earlier developments (Syms, 1997).
treatment” (DoE, 1986), the Department of the Environment presents a view similar to that of Fleming.
In 1987, Kivell noted that, the total area of dereliction in England had increased from 43,300 hectares in 1974, to 45,700 hectares in 1982, according to review prepared by the Department of the Environment. This increase happened in spite of the major programmes of reclamation that dealt with 17,000 hectares during the same time period (Syms, 1997). However, the equivalent review showed a reduction to 41,456 hectares by 1988 (DoE, 1991), at the same time as the 1993 survey indicated an additional reduction to 39,600 hectares of land being recorded as derelict in England (DoE, 1995).
The derelict land survey gives only a small part of the overall view. There are numerous locations that are still in use, or may be semi-derelict, which experience the same instability or contamination problems such as those locations that are officially classed as derelict. Kivell gave Stoke-on-Trent as an example.
In 1984, Stoke-on-Trent identified 332 hectares of derelict land, but added 291 hectares likely to become derelict, where existing industrial activities are expected to close down shortly. A further 538 hectares was classed as neglected land (Kivell, 1987).
Estimates suggest that 50,000 - 100,000 sites may be considered to be contaminated covering about 50,000 hectares. However, only a small percentage of these is likely to pose an immediate threat to community health or the environment (Hobson, 1991). The 1988 survey of the Department of the Environment gave information of the post reclamation use of almost 12,000 hectares of derelict land that was reclaimed between 1982 and 1988 A similar analysis was given in the report on the 1993 survey (Syms, 1997).
Land use By local authority with grant By local authority without grant By other
agencies * Total
Industry 901 44 622 1 567
Commerce 118 11 460 589
Residential 294 79 675 1 048
Sub total (hard end use) 1313 134 1757 3 204
Sport and recreation 793 96 251 1 140
Public open space 3 078 251 475 3 804
Agriculture/ forestry 1 282 199 1 212 2 693 Sub total (soft end use) 5 153 546 1 938 7 637
Others 289 103 736 11 969
Total 6 755 783 4 431 11 969
[image:42.612.76.487.12.259.2]* Including private sector developers and commercial organizations.
Table 2-1 The use of land after reclamation. 1982 -1988. (hectares). Department of the Environment (1991) ((Syms, 1997).
Land use By local
authority with grant
By local authority
without grant agenciesBy other Total
Industry 579 54 687 1 319
Commerce 120 18 518 656
Residential 89 16 816 922
Sport and recreation building 82 17 82 181
Other development 281 60 301 643
Sub total (hard end use) 1 152 165 2 404 3 721
Agriculture 226 4 607 837
Forestry / Woodland 561 5 51 617
Public open space 1 269 103 192 1 564
Outdoor recreation 906 133 336 1 375
Nature conservation 180 54 94 328
Sub total (soft end use) 3 142 299 1 280 4 721
[image:42.612.77.487.306.533.2]Total 4 293 465 3 684 8442
Table 2-2 The use of land after reclamation. 1988 -1993. (hectares). Department of the Environment (1995) ((Syms, 1997).
Government intervention, since the late 1980’s, in the clean up of contaminated land through English Partnerships and Regional Development Agencies has brought brown-field sites into use for business, housing and recreational use.
2.4 The River Rother
The principal aim of Doyle’s study in 1984 was to assess the degree of heavy metal pollution found in an aquatic ecosystem namely the River Rother. The reason for this analysis was to ascertain the level and extent of the heavy metals contamination of the local rivers considered (Rother, Sheaf, Porter and Little Don).
The Rother was singled out as being most in need of investigation of the regional network of rivers on suspicion of greater levels of contamination. The three other rivers, the Sheaf, Porter and Little Don, were chosen primarily because of their comparable geology, ecology, climatology and historical use. The actual choice of sites was governed by a number of factors. All the sites had to be physically and legally accessible and were within 0.5 km of a road. It was decided to have eight sample sites on the chosen stretch of the River Rother adjacent to the chemical works at Staveley. This was in order to provide a sound database for assessing the levels and impacts of the chemical plant's discharges.
Doyle (op.cit) states, ’’All water and sediment samples were collected in accordance with standard procedure to prevent degradation of samples prior to analysis. Cold vapour atomic absorption spectrophotometry (C.V.A.A.S.), and atomic absorption spectrophotometry (A.A.S.) were used to analyse mercury, nickel, cadmium and chromium with modification for each metal type.
The research gives a good representation for the Rother, especially around Staveley, where the concentrations were higher than at the other sites. This establishes a background for the following studies and researches.
In order to judge the true effectiveness of European Community EEC environmental legislation on persistent wastes, Murfin in 1988 started his study by using the River Rother as a case study. The Directive "Dangerous Substances 76/464" seeks to establish a framework for the elimination or reduction of specified pollutants in inland, coastal and territorial waters. The Directive spawned several pollutant-specific papers and the proposal, which affected the Rother, was the council directive on the control of List 1 substances particularly the Directive 82/176”.
The study suggested that further sampling operations after implementation of the EEC Directive may indicate the duration of river clean-up operations. Forty-seven samples were taken from the bed load of the Rother at approx. 1.5 km intervals, and the same analytical method as used in Doyle’s survey was used, which was the cold vapour absorption (CVAAS). Reductions of contamination levels since the previous survey in 1984 appear to be dramatic, but the reliability of the data was unknown.
In his report Humphries (1988), included the results of the analysis of soil samples taken from land at Pithouse West Beighton for heavy metals. Twenty-one hand augured samples were taken within four different depth categories between 11th October and 10th November 1988 and four bulked borehole samples with the same depths were taken between 18th and 21st November by Norwest Holst Soil Engineering Ltd.
The results indicated that high amounts of lead, zinc, and cadmium existed on land around Beighton Flashes (SK 445 836).
The report demonstrated that there were many sources of pollution within the area such as:
• The effluent from Danesmoor Sewage Treatment Works (STW), which serves Clay Cross, on Upper Rother (SK392 630).
• The effluent from Coal Products Ltd's, Avenue Coking Works discharges (SK 396 679), which were still responsible for downgrading 2.5km of the main river to "poor".
• The effluent of the ochreous discharges from the abandoned mine waters in the Rivers Hipper, Whittling and Drone, and
• The discharge from Old Whittington STW (SK 393 743), which serves Chesterfield, and Staveley Chemical Works (SK 416 752) and its discharges from the chlor-alkali plant in particular.
Until the mid 1980s, mercury was discharged from the chlor-alkali plant at Staveley Works in amounts above the environmental quality standard of the EC Dangerous Substances Directive.
Edwards (op. cit) reports: work by the NRA's laboratory in Leeds has shown complex mixtures of organic substances in effluents from some industrial discharges. The identification of many of these chemicals, even with advanced gas chromatography-mass spectrometers, is difficult. The NRA is requiring the provision of treatment facilities in order to remove these substances. Toxicity screening of effluents is also being introduced. ______
Schemes to improve sewage treatment works and industrial effluent discharges at the catchments should lead to marked improvements. Actions to achieve water quality standards are taken in the Rother and its tributaries and the NRA sets tough but fair standards for effluent discharges in relation to quality objective and standards set for the receiving waters. In the Rother catchment, much of the pollution stems from discharge consent standards being too lax. These consents will be reviewed and appropriate standards set.
In 1991, Gunn started his study aiming to seek out any significant pollution of the Rother Valley by selected heavy metals (lead, zinc, and cadmium). Samples of soils and vegetation from the channel banks together with water and river sediments at different depths taken from the river channel were analysed
Gunn (op.cit) reports, on 19th June 1990, the survey was carried out at the following sample sites:
1. The New Beighton Flashes (SK 445 835).
2. Opposite Bank to the New Beighton Flashes (SK 447 840) 3. The Rother Valley Country Park (R.V.C.P) (SK 457 825). 4. Killamarsh Meadows (SK 448 813).
A hand soil auger was used to take all soil samples, and collecting jars were used for the sediment and water samples. In the laboratory, samples were dried overnight at 40°C in an oven and then sub-sampled. The sediment samples were limited to where wading into the channel was possible. The water samples once collected needed to be kept refrigerated. The analysis was done by using Atomic Absorption Spectrophotometry (A.A.S).
Furthermore Gunn (op.cit) concludes, “The floodplain of the River is in areas contaminated with significant levels of lead, zinc and cadmium, all likely to have a detrimental effect on the ecosystem. It is also very likely that other toxic substances are present. It has been shown that the River Rother and its floodplain does contain variable amounts of heavy metal pollution some of which could pose health risk and suggestions as to the sources and methods of deposition are made.
Setting up a continuing experiment to establish whether metals are still accreting today through water and sediment analysis, might be a useful area for research”.
As a follow-up study, Duty in 1995 began collecting samples from the same sites as for the earlier studies (1984 and 1988) so that direct comparisons could be made. The sampling techniques and preparation were modified to overcome errors identified in the earlier investigations. At some sites, coring was done while at others a screw auger was used to facilitate collection. Samples were dried, ground to fine powder and placed in small, labelled airtight bags.
Duty (op. cit) found that “the movement of sediment and their pollution loads downstream has been exhibited quite conclusively, and some project limitations and recommendations for further studies are presented”.
This study established wide background information about the Rother and its catchment, and explained the phenomenon obviously in relation to the previous information. Also it presented the explanation to the obscurity points, which appeared in the previous studies such as the mobility of contaminated sediments.
2.5 Initiatives Relating to the Restoration of the River Rother
A report, as a visitor survey for Rother Valley Country Park (RVCP) in 1988, was done by a team of first year students from the Sheffield City Polytechnic Recreation Management degree that undertook the interviews under the supervision of Dr Ralph Hebden, Head of the School. The Park was created as part of the restoration of the valley following opencast coaling and to enhance the water-based recreation facilities of the area. The River was confined to its own new channel and the lakes were supported with clean water from other local streams. This survey obviously represented the success of the project and encouraged further development for leisure use.
provide the necessary treatment action. This technology was environmentally acceptable and could be used to develop good public relations with the local community. However, from the investigation, it was obvious that the area of land required for polishing the liquid effluent was the same as that required for when the conventional effluent treatment plant was not used, i.e. untreated effluent fed directly to the reed bed.
There were basically two types of reed bed used for the treatment of wastewaters. One uses gravel as the substrate and the other uses soil. Reed beds can be designed for two operating modes horizontal feed and vertical feed. The latter was found more effective and therefore the land area requirement is reduced.
The Rivers Dearne and Rother are the two main tributaries of the River Don, the three rivers together making up a separate catchment or drainage area (Anon., 1996). The Don itself rises on Dunford Moor in the Pennines, 485m above sea level, near to the point where the counties of West Yorkshire, Derbyshire and Greater Manchester meet. It flows from its source to Penistone