www.wjpr.net Vol 4, Issue 08, 2015. 1552
FORMULATION, OPTIMIZATION AND EVALUATION OF
CONTROLLED RELEASE MICROSPHERES OF LOSARTAN
POTASSIUM
Geeta1*, Charan Singh1, Tarun Virmani2, Jyoti Gupta2, Reshu Virmani3 *1
CBS College of Pharmacy & Technology, Village-Chandpur, Faridabad, Haryana, India; 2
School of Pharmaceutical Sciences, MVN University, Palwal, Haryana, India.
3
Spectrum Institute of Pharmaceutical Sciences and Research, Greater Noida, U.P, India.
ABSTRACT
Objective: The aim of this study was to prepare losartan potassium loaded albumin microspheres. Methods: w/o emulsion thermal crosslinking method with different drug-to-polymer ratios {(1:1), (1:2),
(1:3)}, using a 22-gauge hypodermic syringe into an external phase. A
32 full factorial design was employed to study the effect of independent
variables, polymer-to-drug ratio (X1) and stirring speed (X2), on
dependent variables, encapsulation efficiency, particle size, and %
drug release. Result: Nine F1, F2, F3, F4, F6, F7, F8 and F9, formulations prepared, F7 i.e., 1:3 (drug–polymer) ratio was selected
as the optimized formulation based on particle size, encapsulation
efficiency, and the release behavior. The microsphere formulations
were able to sustain the release of drug in vitro more than 8 hrs Dissolution data obtained
from in-vitro release studies fitted on zero order, first order, Higuchi, and Peppas model. The
DRS spectrum revealed that the presence of excipient did not show any shift in the spectrum.
The microspheres stored under variable storage condition were found to be stable both
physically and chemically.
KEYWORDS: In vitro release, microspheres, encapsulation efficacy, losartan potassium, albumin.
INTRODUCTION
Historically, oral drug administration has been the predominant route for drug delivery. It is
known to be the most popular route of drug administration due to the fact the gastrointestinal
Volume 4, Issue 8, 1552-1575. Research Article ISSN 2277– 7105
*Correspondence for Author
Geeta Sorout
CBS College of Pharmacy
& Technology,
Village-Chandpur, Faridabad,
Haryana, India. Article Received on 25 May 2015,
physiology offers more flexibility in dosage form design than most other routes.[1] This can be
accredited to the numerous advantages of the oral route, such as, ease of ingestion, avoidance
of pain, versatility and most importantly patient compliance, reduced risk of cross-infection,
and needle stick injuries economical production methods, easy approvals from regulatory
bodies and so on.[2] The important drawback of tablet and capsule dosage forms for pediatric
and geriatric patients has been difficulty in swallowing and this problem leading to poor
patient compliance.[3] A greater attention has been recently bestowed upon the development
of sustained and controlled drug delivery systems. These dosage forms are very attractive for
a variety of reasons. By now, for a large number of diseases, a large number of drugs are
available. However, the effectiveness of these drugs is often limited because of the
side-effects or need of invasive administration in a clinical setting.[4] These formulations are
designed to deliver the drugs at a controlled and predetermined rate, thus maintaining their
therapeutically effective concentrations in the systemic circulations for prolonged periods of
time.[5]
Albumin
Albumin is the most abundant protein in the human blood plasma. It is hydrosoluble and
presents a molecular weight of about 66 kDa. Characteristics like biodegradability,
non-toxicity and non-immunogenicity, makes albumin a very promising material for
biomedical/pharmaceutical applications, including drug delivery purposes. Albumin
microspheres have proved to be a suitable carrier for drugs used in cancer treatment. This is
mainly due to the fact that albumin is used by cancer cells as a source of nitrogen and energy,
being taken up by tumor cells by a mechanism of fluid phase endocytosis, followed by
lysosomal breakdown. With this mechanism, the drugs in the albumin microspheres are
delivered on the specific site of action, minimizing systemic toxicity. Albumin microspheres,
loaded with anti-cancer drugs, have shown to be efficient in breast cancer treatment.[6]
Microspheres
Microspheres are solid approximately spherical particles ranging from 1 to 100 mm in size to
provide advantages over sustained release tablets, such as ready distribution over a large
surface area, predictable and reproducible drug release kinetics, the delocalization of the total
dose in GIT, reduced side effects of the drug, and the independent drug release rate on gastric
transit time. Oral multi-unit dosage forms like microspheres have received much attention as
tract, thus resulting in more uniform drug absorption and reducing patient-to-patient
variability. It has been reported that the selection of the proper microencapsulation technique
and of the excipients, such as polymers as carriers, coaters, and emulsifiers, is very popular in
the preparation of the modified release microspheres of the drug. Natural, biodegradable
polymer-based microspheres as a drug carrier is widely used as they improve the safety and
efficacy of drug delivery, drug targeting to specific cells or organs, and better patient
compliance.[5]
Release mechanism of drug from microsphere
Polymer microspheres can be employed to deliver medication at a rate-controlled and
sometimes targeted manner. Medication is released from a microsphere by drug leaching
from the polymer or by degradation of the polymer matrix. Since the rate of drug release is
controlled by these two factors.[7]
Hypertension
Hypertension is a leading cause of morbidity and mortality worldwide. Individuals with
hypertension are at an increased risk for stroke, heart disease and kidney failure.[8]
Hypertension is defined by a systolic blood pressure that is ≥140 mm Hg and a diastolic
blood pressure that is ≥90 mm Hg . The World Health Organization ranks coronary heart
disease and cerebrovascular diseases as the world's leading causes of death. Globally,
according to the World Health Report 2002, about 62% of cerebrovascular disease and 49%
of ischemic heart disease are attributable to suboptimal blood pressure (systolic >115 mm
Hg), and hypertension is estimated to cause 7.1 million deaths, about 13% of the total. For the
last several decades, hypertension has been ranked as one of the top 10 leading causes of
worldwide disability-adjusted life years. According to the results of Kearney et al.[5] more
than 25% of the world adult population (approx. 1 billion) has hypertension, and it was
estimated that in 2025, 29% (1.56 billion) of the adult population will be hypertensive (an
Interplay of different factors in the generation of hypertension in chronic kidney disease (B)P
blood pressure, (CO) cardiac output, (TPR) total peripheral resistance, (PTH) parathyroid
hormone, ( Na) sodium).[10]
The angiotensin II receptor blockers (ARBs) ARBs inhibit the renin-angiotensin system and
reduce cardiovascular mortality in adults. Losartan has the advantage of being available in
suspension formulation, although not in Brazil. The use of ARBs can also be associated with
a lower incidence of diabetes, and these agents can be used for long periods, as they are very
well tolerated, due to their effects being similar to placebo.[11]
MATERIAL AND METHODS
Sr.no. Materials Grade
1. Losartan potassium [LP] L.R.
2. Albumin L.R.
3. Light liquid Paraffin L.R.
4. Span 60 L.R.
5. Petroleum Ether L.R.
6. Water L.R.
(A) Preformulation Studies 1. Identification Tests (a) IR Spectroscopy
Fourier transforms infrared (FTIR) study was carried out to check compatibility of the drug
with polymers. The spectrum of a dried mixture of drug and potassium bromide was run to
identify the drug.[12]
(b)Solubility Analysis
The solubility of Losartan potassium was checked in various solvents like water and
Lsartan potassium was found to be freely soluble in water and methanol. The International
Bulletin of Drug Research., 1(2): 120-131 122 solubility was confirmed by analyzing the
sample by quantitative determination by UV spectroscopy. Wavelength scan was done from
400-200 nm and maximum absorbance was found at 206nm.[13]
(c) Melting point Determination
Melting point determination of the obtained sample was done as it is a good first indication of
purity of the sample. The presence of relatively small amount of impurity can be detected by
a lowering as well as widening in the melting point range. Melting point of LP was
determined by Open capillary method.[14]
(D) Compatibility study by FTIR
Fourier Transform Infrared Spectroscopy (FT-IR) FT-IR spectra’s were recorded on a FTIR
spectroscopy using the instrument Shimadzu FT-IR in the frequency range of 400-4000
cm-1 with the resolution of 4 cm-cm-1 using potassium bromide discs method. The drug and selected
excipient were stored at 40 ± 2oC and 75 ± 5 % RH for 1 month. Individual samples as well
as the mixture of drug and excipients were ground, mixed thoroughly with potassium
bromide for 3-5mins in a mortar and compressed into the disc by applying a pressure of 5
tons for 5 mins in a hydraulic press. The concentration of sample in potassium bromide
should be in the range of 0.2% to 1%.The pellets were placed in the light path and spectrum
was obtained and reviewed for evidence of any interactions.[15]
(B) Spectroscopic studies 1. Determination of λmax
A solution of LP containing the concentration 10 µg/ ml was prepared in pH 7.4 and UV
spectrum was taken using Shimadzu (UV-1800) double beam spectrophotometer. The
solution was scanned in the range of 200 – 400 nm.[13]
2. Construction of Calibration curve in 0.1N HCL pH 1.2 and 7.2 pH of buffer i) Standard calibration of Losartan potassium in 0.1N Hcl
100mg of Losartan potassium was accurately weighed and dissolved in100ml of 0.1N HCL to
obtain a concentration of 1000µg/ml. From the above 10ml was withdrawn and diluted to
100ml to obtain a concentration of 100µg/ml. From this stock solution aliquots of 0.5ml, 1ml,
concentrations in range of 5µg/ml to 25µg/ml respectively, absorbance was measured at
205nm.[16]
ii) Standard calibration of Losartan potassium in phosphate buffer of pH7.2: 100mg of Losartan potassium was accurately weighed and dissolved in100ml of pH 7.2 phosphate
buffer to obtain a concentration of 1000µg/ml. From the above 10ml was withdrawn and
diluted to 100ml to obtain a concentration of 100µg/ml. From this stock solution aliquots of
0.5ml, 1ml, 1.5ml, 2ml and 2.5ml were diluted in 10ml volumetric flask with phosphate
buffer to give concentrations in range of 5µg/ml to 25µg/ml respectively, absorbance was
measured at 224nm.[16]
(C) Optimization method for preparation of microspheres:
The ratio of the polymer to be used were optimized using 32 full factorial design.[17]
Batch code Variable level in coded form X1 X2
F1 -1 -1
F2 -1 0
F3 -1 1
F4 0 -1
F5 0 0
F6 0 1
F7 1 -1
F8 1 0
F9 1 1
Translation of coded levels in actual units
Variable level Low(-1) Medium(0) High(+1) Drug- to- Polymer
ratio(X1) 1:1 1:2 1:3
Stirring
Speed(X2)rpm 800 1000 1200
Amount of drug in each formulation =100 mg (D) Preparation of albumin microspheres
Albumin microspheres of LP were prepared by the w/o emulsion thermal cross-linking
method with minor modification. 100ml of light paraffin oil was placed in a glass beaker and
mixed with 0.4% w/v span 60 solution by stirring (800,1000,1200) and heating at 70°C for
solubilization. The mixture was allowed to cool at room temperature. Add 10 ml of egg
albumin aqueous solution of a different drug to polymer ratio ((1:1, 1:2 and 1:3) using a
for 10 min with the help of a magnetic stirrer. A w/o emulsion was formed. The temperature
of the oil bath was raised to 95°C. Spherical highest percentage yielding microspheres with
moderate aggregation at (95°C) and stirring was continued until microspheres were
completely dehydrated. Microspheres were then separated by decantation and washed six
times with 20 ml of petroleum ether to remove traces of oil. Finally, microspheres were
washed three times with 60 ml of distilled water and dried at room temperature for 24 h.
After drying, a fine yellow free flowing powder was obtained that was stored in desiccators at
room temperature. Different batches of microspheres were prepared using different drug to
polymer ratio and different rpms. In each case, the other variables were kept constant.
Average size of microspheres was determined by using a calibrated stage micrometer. A total
of nine batches, each in triplicate, were prepared as per 32 factorial design.[5]
(E) EVALUATION OF MICROSPHEREs Particle size analysis
Determination of average particle size of losartan potassium microspheres was carried out by
optical microscopy, fitted with an ocular micrometer and a stage micrometer. The particle
diameter of 100 microspheres was measured randomly by an optical microscope. The average
particle size was determined by using the Edmondson’s equation.[14]
Dmean = Σnd/ Σn
Where n = no. of microspheres observed
D = mean size range
(F) Shape and surface morphology
The external morphology of microspheres was analyzed by scanning electron microscope
(SEM). For scanning electron microscopy samples were prepared by lightly sprinkling
microspheres powder on a double adhesive tape, which stuck to an aluminum stub. The stubs
were then coated with gold to a thickness of (150–200 Å) using a fine coat ion sputter (JEOL,
fine coat ion sputter JFC-1100). The microspheres were examined under scanning electron
microscope (JEOL, JSM-6100 SEM, Japan).[18]
(G) Drug Entrapment Efficiency
Microspheres (50 mg) were crushed in a glass mortar and pestle, and the powdered
microspheres were suspended in 50 ml phosphate buffer (pH 7.2). The resulting mixture was
analyzed for the drug content. The drug entrapment efficiency was calculated using the
following formula.[17]
DRUG ENTAPMENT EFFICACY= PRACTICAL DRUG CONTENT × 100 THEORTICAL YIELD
(H) In vitro dissolution test
The in vitro release was performed using USP method II (paddle). The dissolution media in
the first set of experiments was 0.1N HCl for 2 hours, while in the second set 0.1NHCl was
replaced with phosphate buffer of pH 7.2 for 6 hours. The volume of dissolution media in
each vessel was 900 ml and the temperature was maintained at 37 ± 0.5°C during the study.
The paddle speed was adjusted to 50 rpm. Samples of 5mL were withdrawn at different time
intervals (1, 2, 3, 4, 6, 8, 10, and 12 hours). Each withdrawn sample was replaced by 5 ml at
each time of dissolution media. The percentage drug release was determined using of
UV-spectrophotometer where λmax was 205 nm in HCl and 224 nm in phosphate buffer
respectively. A calibration curve was constructed and the concentration of losartan potassium
was read from that curve.[20]
(I) Dependent-model method (Data analysis)
In order to describe the losartan potassium release kinetics from individual microsphere
formulations, the corresponding dissolution data were fitted in various kinetic dissolution
models: zero order, first order, Higuchi, Korsmeyer Peppas. When these models are used and
analyzed in the preparation, the rate constant obtained from these models is an apparent rate
constant. The release of drugs from the sustained microsphere can be analysed by release
kinetic theories. To study the kinetics of drug release from matrix system, the release data
were fitted into Zero order as cumulative amount of drug release vs. time (Eqn.3), first order
as log cumulative percentage of drug remaining vs. time (Eqn.4), Higuchi model as
cumulative percent drug release vs. square root of time (Eqn.5). To describe the release
behavior from the polymeric systems, data were fitted according to well-known exponential
Korsmeyer – Peppas equation as log cumulative percent drug release vs log of time equation
(Eqn.6).
(i) Zero order kinetics
Qt=K0t………Eqn.(3)
Where,
K0 = Zero order rate constant expressed in unit of concentration /time
t = Release time
(ii) First order kinetics
Log Q=Log Q0-kt/2.303…………Eqn.(4)
Where,
Q0= is the initial concentration of drug
k= is the first order rate constant, t =release time
(iii) Higuchi kinetics
Q=kt1/2………...…Eqn.(5)
Where,
k= Release rate constant
t=release time, Hence the release rate is proportional to the reciprocal of the square root of
time.
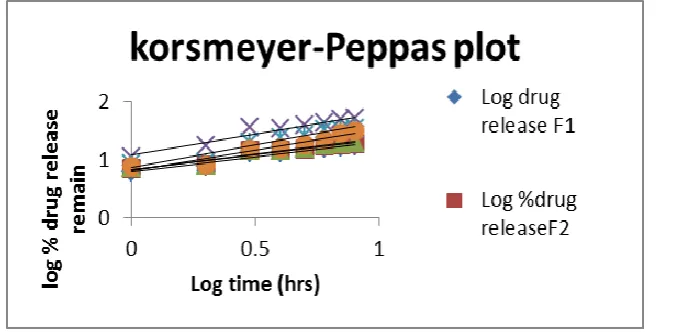
(iv) Korsmeyer-Peppas
First 60% in vitro release data was fitted in equation of Korsmeyer et al. to determine the
release behavior from controlled release polymer matrix system. The equation is also called
as power law,
Mt /M∞ =Kt n ……… Eqn.(6)
Where, Mt = amount of drug released at time t
M∞ = amount of drug released after infinite time Mt /M∞ = fraction solute release
t = release time
K = kinetic constant incorporating structural and geometric characteristics of the polymer
system
n = diffusional exponent that characterizes the mechanism of the release of traces.
The magnitude of the release exponent “n” indicates the release mechanism (i.e. Fickian
diffusion, Non Fickian, supercase II release). For sustained release microsphere, values of n
of near 0.5 indicate Fickian diffusion controlled drug release, and an n value of near 1.0
indicates erosion or relaxational control (case II relaxational release transport, non Fickian,
zero order release). Values of n between 0.5 and 1 regarded as an indicator of both diffusion
and erosion as overall release mechanism commonly called as anomalous release
(J) Stability studies
To assess long-term stability, the albumin microsphere formulations in triplicate were put in
hard gelatin capsules and sealed in aluminum packaging coated inside with polyethylene. The
studies were performed at 40°C/75% RH in the stability chamber for 3 months. At the end of
storage period, the formulation was observed for physical appearance, drug content.[5]
RESULTS AND DISCUSSION 3.2 PREFORMULATION STUDY 3.2.1 Identification Test
3.2.1.1 I R Spectroscopy
FIG.3.1: FT-IR SPECTRA OF PURE LOSARTAN POTASSIUM FOR IDENTIFICATION.
3.2.1.2 Solubility Analysis
Losartan potassium drug sample found to be freely soluble in water, methanol, ethanol,
dichloromethane, and chloroform and it is also soluble into the dissolution medium.
Preformulation solubility analysis was done to select a suitable solvent to dissolve and also to
test solubility in dissolution medium.
3.2.1.3 Melting point determination
Melting point of drug sample was found to be 183.5 which were within the reported range
182-185. Melting point is a good first indication of purity of the sample since the presence of
relatively small amount of impurity can be detective by a lowering as well as widening in the
3.2.1.4Compatibility study by I R spectroscopy: FT- IR spectroscopy was carried out to check the compatibility between drug and polymer. From the FT- IR spectra of the pure drug
and the combination spectra of drug with polymer, it was observed that all the characteristics
peaks of losartan potassium were present in the combination spectra as well thus indicating
[image:11.595.130.468.190.350.2]the compatibility with the polymer.
[image:11.595.128.466.196.500.2]FIG.3.2 FT-IR SPECTRA OF ALBUMIN
FIG. 3.3 FT-IR SPECTRA OF PURE LOSARTAN POTASSIUM
[image:11.595.133.450.604.731.2]3.2.1.5Spectroscopic studies
3.2.1.5.1Determination of λ max (UV Spectroscopy)
Spectroscopic study was carried out in order to find out the λ max of losartan potassium in
0.1 N HCl and phosphate buffer pH 7.20.Solution of 10 µg/ml of losartan potassium in the
test media when scanned for maximum absorption in the range of 200-400 nm exhibited
sharp peak at 205 nm and 224 nm in 0.1 N HCl and phosphate buffer pH 7.2 respectively.
3.2.1.5.2Construction of Calibration curve in 0.1N HCL pH 1.2 and 7.2 pH of buffer The calibration curve was prepared in 0.1N HCL pH1.2 and pH7.2 with the below mentioned
results.
3.2.1.5.2.1Standard Calibration curve in 0.1 N HCL
The calibration curve of losartan potassium was prepared in 0.1 N HCL. Linear regression of
the absorbance values resulted in r2 values of 0.9857 in 0.1 N HCL.
Solvent : 0.1 N HCL
[image:12.595.143.484.401.579.2] Wavelength: 205 nm.
FIG. 3.5 STANDARD CALIBRATION CURVE OF LOSARTAN POTASSIUM IN 0.1 N HCL
3.2.1.5.2.2 Standard calibration curve in phosphate buffer pH 7.2
Table no. 3.2 shows the absorbance of standard solution of LP at λ max 224nm. Linear
regression of the absorbance value resulted in r2 values of 0.9996 in phosphate buffer pH 7.2.
Solvent: pH 7.2 phosphate buffer.
FIG.3.6 STANDARD CALIBRATION CURVE OF LOSARTAN POTASSIUM IN PH 7.2 BUFFER.
3.3Optimization process
The concentration of polymer used was optimized by using 32 factorial design. On the basis
of the factorial design, microsphere without drug were prepared using albumin at different
amount with optimized stirring speed. It was observed that at high level of polymer yielded
spherical shape microsphere.
3.4Preparation of microsphere
Microsphere was successfully prepared by using the w/o emulsion thermal crosslinking
method with minor modifications.
FIG.3.7 PREPARED MICROSPHERES
3.5. Evaluation of microsphere 3.5.1 Particle size Analysis
The average particle size of microsphere as determined by the optical microscopy by using
ocular micrometer and stage micrometer as shown in (table no.9) and fig. The mean particle
56.41±0.46, 50.30±0.72, 48.49±0.65, 75.56±0.15, 68.05±0.05, 63.85±0.47 for formulation F1
to F9.As the drug to polymer ratio increased the particle size of microsphere is also increased.
Stirring speed had a negative effect on the particle size (i.e., as the stirring speed increased,
the particle size decreased).
TABLE 3.3: AVERAGE PARTICLE SIZE OF LOSARTAN POTASSIUM MICROSPHERE
(N= 3 ), Mean±SD
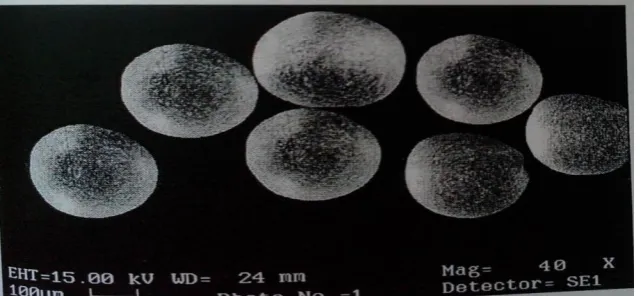
3.5.3 Shape and surface morphology
[image:14.595.139.460.499.647.2]Shape and surface morphology was characterized by Scanning Electron Microscopy (SEM) Figure shows microsphere showing some morphological characteristics such as diameter, shape, and surface characteristics:
FIG.3.8 SEM PHOTO GRAPH FOR FORMULATION F7
PREPARED MICROSPHERE 3.5.5 Encapsulation efficiency
The drug entrapment efficiency is important variable for assessing the drug loading capacity
of microspheres. This parameter is dependent on the process of preparation, physicochemical Sr.no. Formulation code Average Particle Size(µm)
Mean±SD
1. F1 36.331±1.524
2. F2 48.466±2.022
3. F3 37.495±6.126
4. F4 56.886±1.275
5. F5 50.798±1.4786
6. F6 49.06±1.581
7. F7 76.266±1.331
8. F8 69.548±2.642
properties of drug, and formulation variables. The drug entrapment efficiency varied from 41
% to 49%. Result of equation indicates the effect of X1 (drug-to-polymer ratio) is more
significant than X2 (stirring speed). Moreover, stirring speed had a negative effect on drug
entrapment efficiency (i.e., the stirring speed increased, the particle size decreased, and thus
drug entrapment efficiency decreased). As the ratio of drug-to-polymer increased,
encapsulation efficiency increased; this is due to the fact that higher ratio of drug-to-polymer
would produce large size droplets with decreased surface area, such that diffusion of drug
from such microsphere will be slow, resulting in higher encapsulation efficiency.
TABLE 3.6: DATA FOR ENCAPSULATION EFFICIENCY
Formulation code % Encapsulation Efficiency Mean±SD
F1 42.224±0.06
F2 42.140±0.650
F3 41.425±0.124
F4 45.882±0.160
F5 45.05±0.014
F6 44.236±0.01
F7 48.919±0.199
F8 46.412±0.01
F9 46.35±0.015
(N=3) Mean±SD
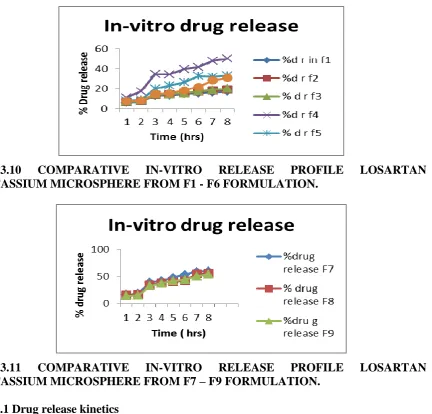
3.5.6 In-Vitro Studies
In-vitro drug release study of F1to F9 formulation was carried out in o.1 N HCL for 2 hours
followed by dissolution in phosphate buffer pH 7.20 for a period of 6 hrs. Initially, a burst
effect within 2 hrs was observed predominantly in F1 to F9 formulation. Thereafter a period
of slow release followed till 8 hrs. Various other factor that can affect the drug release from
the microsphere include size of microsphere and its morphology, physical state of drug in
polymer and type of polymer.
Apparatus: paddle
Speed: 50 rpm
Volume: 900ml
TABLE 3.7: PERCENTAGE DRUG RELEASE OF FORMULATION (F1 TO F6)
Time (hrs) F1
Mean±SD F2 Mean±SD
F3
Mean±SD F4 Mean±SD
F5 Mean±SD
F6 Mean±SD 1 6.268±0.024846 6.884±0.025403 7.177±0.025403412 11.235±0.050229 8.290±0.025403 7.819±0.078621 2 7.556±0.046014 7.895±0.025403 8.099±0.025403412 17.519±0.067211 8.993±0.091593 8.085±0.044 3 13.142±0.043981 14.187±0.049652 14.418±0.050229473 34.917±0.303541 20.089±0.1725 14.878±0.049652 4 13.409±0.198325 14.706±0.050229 14.734±0.172500242 39.465±0.049652 23.457±0.0855 15.627±0.131913 5 14.993±0.086002 15.310±0.049652 15.742±0.049652123 39.898±0.131913 26.423±0.099304 18.448±0.0865 6 15.742±0.349009 17.532±0.11547 17.786±0.099881597 41.798±0.099882 31.75±0.086 22.047±0.131804 7 16.404±0.049943 18.523±0.020785 18.995±0.099881597 48.103±0.050229 32.095±0.0865 28.554±0.173 8 17.440±0.099027 19.37±0.050229 20.147±0.049652123 50.233±0.0865 32.971±0.653821 30.8±0.086 (N=3) (Mean±SD)
3.5.7 Drug release kinetic
Dissolution data obtained from in-vitro release studies fitted on various mathematical models. The mathematical models were found to be on an
average value. F1 formulation followed Peppas model and F2 followed Higuchi model of drug release.F3 to F9 formulation followed first order
release.
[image:16.842.61.641.348.533.2]FIG.3.10 COMPARATIVE IN-VITRO RELEASE PROFILE LOSARTAN POTASSIUM MICROSPHERE FROM F1 - F6 FORMULATION.
FIG.3.11 COMPARATIVE IN-VITRO RELEASE PROFILE LOSARTAN POTASSIUM MICROSPHERE FROM F7 – F9 FORMULATION.
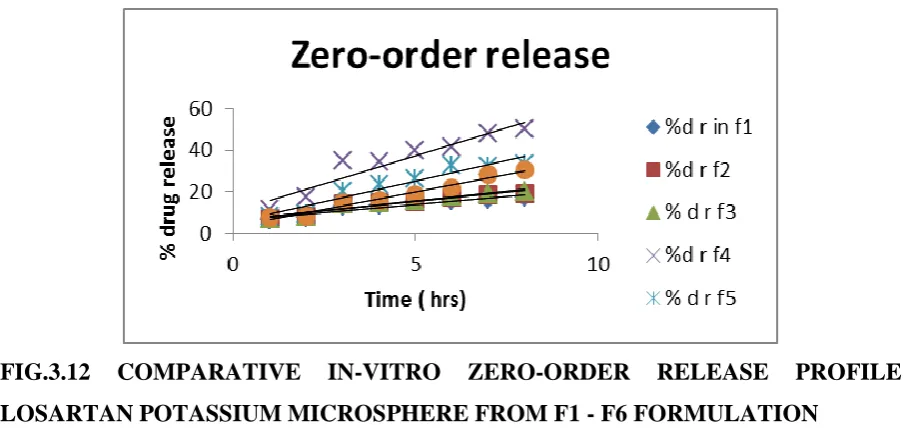
3.5.7.1Drug release kinetics
In order to obtain meaningful information for the release models, the dreg release profile fitted on various kinetic models.
TABLE 3.9: KINETIC MODEL TREATMENT OF DISSOLUTION PROFILES OF FORMULATIONS F1 –F9
Formulation Code
Zero Order r2
First Order r2
Higuchi Model r2
Peppas and Kosmeyer r2
F1 0.877 0.877 0.932 0.934
F2 0.899 0.898 0.939 0.928
F3 0.915 0.899 0.947 0.932
F4 0.905 0.991 0.949 0.946
F5 0.913 0.947 0.943 0.918
F6 0.967 0.971 0.925 0.919
F7 0.922 0.970 0.951 0.923
F8 0.924 0.954 0.933 0.914
F9 0.940 0.974 0.959 0.923
[image:18.595.75.522.563.734.2]www.wjpr.net Vol 4, Issue 08, 2015. 1570 FIG.3.12 COMPARATIVE IN-VITRO ZERO-ORDER RELEASE PROFILE LOSARTAN POTASSIUM MICROSPHERE FROM F1 - F6 FORMULATION
FIG. 3.13 COMPARATIVE IN-VITRO ZERO-ORDER RELEASE PROFILE LOSARTAN POTASSIUM MICROSPHERE FROM F7 – F9 FORMULATION.
[image:19.595.72.524.82.296.2] [image:19.595.87.526.304.512.2] [image:19.595.144.463.547.720.2]FIG.3.15 COMPARATIVE IN-VITRO FIRST-ORDER RELEASE PROFILE LOSARTAN POTASSIUM MICROSPHERE FROM F7 – F9 FORMULATION.
FIG.3.16 COMPARATIVE IN-VITRO HIGUCHI PLOT RELEASE PROFILE LOSARTAN POTASSIUM MICROSPHERE FROM F1 – F6 FORMULATION
www.wjpr.net Vol 4, Issue 08, 2015. 1572 FIG.3.18 COMPARATIVE IN-VITRO PEPPAS PLOT RELEASE PROFILE LOSARTAN POTASSIUM MICROSPHERE FROM F1 – F6 FORMULATION.
FIG.3.19 COMPARATIVE IN-VITRO PEPPAS PLOT RELEASE PROFILE LOSARTAN POTASSIUM MICROSPHERE FROM F7 – F9 FORMULATION.
3.5.8Stability studies
3.5.9 The stability studies of F7 formulation was found stable at different temperature and humidity condition for 90 days. From the stability studies, it found that there was no
significance change in the drug encapsulation efficiency and physical appearance of
formulation. DRS spectra of microsphere saw that the formulation was physically and
chemically stable.
TABLE 3.10 STABILITY STUDIES FOR % ENCAPSULATION EFFICIENCY AFTER 30 DAYS STORAGE
Formulation code
Time(days) 40±1 (Deep Freezer)
Room
Temperature 25±2 0C
40±2 0C/75±5 % RH
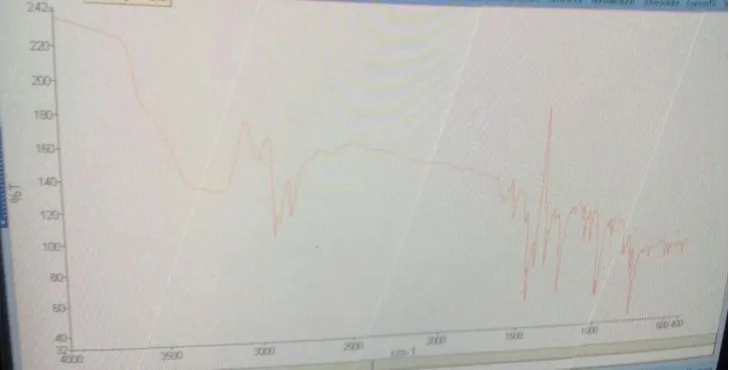
[image:21.595.135.473.86.254.2] [image:21.595.140.464.316.466.2]Diffuse Reflectance Spectroscopy
A shift in the DRS of the drug due to the presence of the excipient indicate physical
absorption, whereas the appearance of new peak indicates chemisorption or formation of
degraded product. Microsphere of LP using albumin are stable in terms of drug excipient
[image:22.595.116.481.203.388.2]compatibility.
FIG.3.20 DRS SPECTRUM OF THE OPTIMIZED MICROSPHERE OF LOSARTAN POTASSIUM (FORMULATION F7).
TABLE 3.11 OBSERVATION TABLE OF VARIOUS FORMULATIONS FOR DEPENDENT VARIABLES
Formulation code Particle size Encapsulation efficiency
% drug release F1 36.331±1.524 42.224±0.06 17.440±0.099027 F2 48.466±2.022 42.140±0.650 19.37±0.050229 F3 37.495±6.126 41.425±0.124 20.147±0.049652123 F4 56.886±1.275 45.882±0.160 50.233±0.0865 F5 50.798±1.4786 45.05±0.014 32.971±0.653821
F6 49.06±1.581 44.236±0.01 30.8±0.086
F7 76.266±1.331 48.919±0.199 60.137±0.131804 F8 69.548±2.642 46.412±0.01 55.704±0.131913 F9 60.126±6.844 46.35±0.015 54.466±0.173 CONCLUSION
The present study was a satisfactory attempt to formulate a sustained release microsphere of
losartan potassium to improve its bioavailability and to controlled release of the drug. Stained
release microspheres were containing losartan pota On the basic studies of particle size,
www.wjpr.net Vol 4, Issue 08, 2015. 1574 was found the optimized formulation.The microspheres of best batch (F7) saw mean particle
size of 76.266±1.331μm and entrapment efficiency of 48.919±0.199%. The % release was
fond 60.137±0.131and release was found sustained.The stability studies of F7 formulation
was found stable at different temperature and humidity condition for 90 days. From the
stability studies, it found that there was no significance change in the drug encapsulation
efficiency and physical appearance of formulation. DRS spectra of microsphere saw that the
formulation was physically and chemically stable.
REFERENCES
1. Nokhodchi Ali et,.al. The Role of Oral Controlled Release Matrix Tablets in Drug
Delivery Systems Bioimpacts., 2012; 2(4): 175–187.
2. Chaudhury Anumita and Das Surajit, Recent Advancement of Chitosan-Based
Nanoparticles for Oral Controlled Delivery of Insulin and Other Therapeutic Agents;
AAPS PharmSciTech., 2011; 12(1): 10–20.
3. Sanjay Shah et.al. Formulation and evaluation of microsphere based oro dispersible
tablets of itopride hcl DARU Journal of Pharmaceutical Sciences., 2012; 20: 24.
4. Shiny Jacob et;al Development and evaluation of a novel biodegradable sustained release
microsphere formulation of paclitaxel intended to treat breast cancer, Int J Pharm
Investig., 2013; 3(3): 119–125.
5. Shailesh TP et; al. Preparation and in vitro Evaluation of Ethylcellulose Coated Egg
Albumin Microspheres of Diltiazem Hydrochloride, J Young Pharm., 2010; 2(1): 27–34.
6. Coelho Jorge F. et; al. Drug delivery systems: Advanced technologies potentially
applicable in personalized treatments EPMA J., 2010; 1(1): 164–209.
7. Freiberg, S. and Zhu, X.X. Polymer microspheres for controlled drug release,
International Journal of Pharmaceutics., 2004; 282(1–2): 1–18.
8. Vasdev Sudesh et;al, The antihypertensive effect of cysteine Int J Angiol., 2009; 18(1):
7–21.
9. Drenjančević-Perić I, et,al. High-Salt Diet and Hypertension: Focus on the
Renin-Angiotensin Syste Kidney Blood Press Res., 2011; 34(1): 1–11.
10.Hadtstein Charlotte and Schaefe Franz Hypertension in children with chronic kidney
disease: pathophysiology and management, Pediatr Nephrol., 2008; 23(3): 363–371.
11.Halpern Alfredo et; al. Metabolic syndrome, dyslipidemia, hypertension and type 2
12.Rao Vishnuvardhan Tallapaneni et;al. Development and evaluation of chitosan based oral
controlled matrix tablets of losartan potassium, Int J Pharm Investig. 2012 Jul-Sep; 2(3):
157–161.
13.keerthi t.s., s. k. senthil kumar , formulation and evaluation of of losartan potassium
using biodegradable natural polymers microspheres,International bulletin of drug research
1(2): 120-131.
14.Preveen B. et; al. formulation and characterization of aceclofenac loaded bovine serum
albumin microspheres international journal of pharma and biosciences
vol2/issue2/Apr-jun 2011
15.manikandan m.,et;al. compatibility studies of camptothecin with various pharmaceutical
excipients used in the development of nanoparticle formulation, International Journal of
Pharmacy and Pharmaceutical Sciences Vol 5, Suppl 4, 2013.
16.Kumar Y.Ganesh et;al. Formulation Design And Invitro Evalu ation Of Sustained Release
Matrix Tablets Of Losartan Potassium Using HPMC Polymers, Internati onal Journal of
PharmTech Research., 2013; 5(3): 1332-1344.
17.Dey Sanjay et;al. Formulation and Optimization of Sustained Release Stavudine
Microspheres Using Response Surface Methodology, ISRN Pharm., 2011; 2011: 627623.
18.Gaba Punamet; al. , Galactomannan gum coated mucoadhesive microspheres of glipizide
for treatment of type 2 diabetes mellitus: In vitro and in vivo evaluation Saudi Pharm J.,
2011; 19(3): 143–152.
19.F. Eftaiha Ala’a et;al. Bioadhesive Controlled Metronidazole Release Matrix Based on