Critical Performance Evaluation of a
Photoreceiver for Application in
Optoelectronics
A. D. McGrath, S. M. Vaezi-NejadAbstract - This paper details the investigation into assessment of a commercially available photoreceiver. A critical analysis of performance evaluation of the photoreceiver in relation to its Responsivity and Time Response are carried out. A standard Helium-Neon laser operated at 632.8nm was used as the stimulating light source in order to achieve the desired measurements. The measurements clearly show how they deviate from the theoretical calculations and recommendations of the manufacturer’s data sheet.
Keywords: Laser, Photodiode, Photoreceiver, Photoresponsivity, Response time.
1. Introduction
There are a many types of photodiodes which can be categorized by detectable spectral range, response time, and damage threshold [1]. In general, photodiodes cannot be used directly to detect high power radiation without using neutral density attenuators or beam splitters to sample the beam.
Manuscript received March 13, 2008.
A D. McGrath
Department of Computing London Metropolitan University ([email protected])
S. M. Vaezi-Nejad Department of Computing London Metropolitan University Tel: +44 207 4230000 ext 2182 ([email protected])
One major difference to thermal detectors lies in the fact that semiconductor photodiodes have a fairly narrow spectral response due to the nature of their operation. Different types of semiconductors have to be used to cover different spectral ranges due to their intrinsic band-gap energy Egwhich causes a cut-off for
wavelengths aboveλc =hc/Eg.
Some photodiodes such as the avalanche photodiode (APD) come with internal gain, which makes them more sensitive to weak signals. It should be noted that the noise properties of APDs strongly depend on the semiconductor material being used [2-3].
For the use in long distance telecommunication systems operating at 1550nm, Ge or InGaAs photo-receivers have to be used which happen to be excessively noisy [4]. Therefore, in some cases it can be more advantageous to use a PIN photodiode in combination with an external low-noise amplifier.
2. Experimental Investigation
Table 1: Photoreceiver parameters.
Detector Silicon PIN photodiode
Active Area mm2 13
Wavelength Range λ 350 to 1100nm Peak Wavelength λ pk 970nm
Peak Response R(λ p) 0.65 A/W Diode Capacitance CJ 40pF
Rise / Fall Time tr 14ns
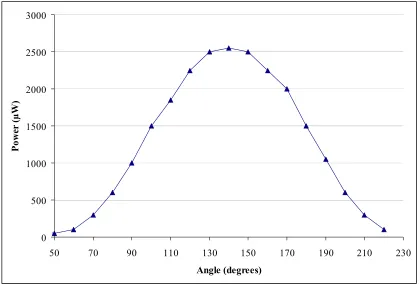
Since the output of the HeNe laser is well polarised, a synthetic linear polarising filter was used as an adjustable attenuator. The results of this figure can be seen in figure 1.
The expected cos2 dependence of the relative polarizer-to-beam angle can be seen quite
clearly. This measurement served as a calibration for our light source prior to recording responsivity measurements. The experiment began by measuring the Thorlabs DET36A terminated into a load resistance (RL) of 50Ω.
0 500 1000 1500 2000 2500 3000
50 70 90 110 130 150 170 190 210 230
Angle (degrees)
Po
w
er
(µ
W
[image:2.595.72.492.340.625.2])
Figure 1: Measured output profile from HeNe laser source.
2.1 Evaluation of Responsivity
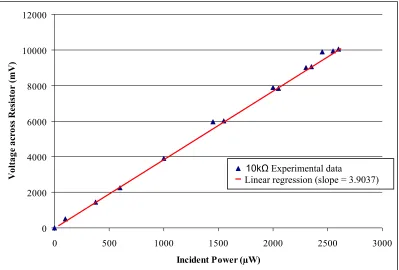
Linearity was observed over the entire range of input powers. A linear regression calculation was undertaken on the experimental data, and resulted in a measured responsivity of
( )
λℜ 50Ω = 19.24 V/W = 0.385 A/W, which
and the responsivity was calculated as
( )
λℜ 10kΩ = 3903.7 V/W = 0.390 A/W, close enough to the previous value to be consistent
and within measurement error. Figure 2 below is confirmation of this calculation.
0 2000 4000 6000 8000 10000 12000
0 500 1000 1500 2000 2500 3000
Incident Power (µW)
Vo
lt
ag
e a
cr
oss Resi
st
or
(
m
[image:3.595.99.498.160.430.2]V)
Figure 2: Responsivity measurement for 10kΩ load In order to observe the effects of limited
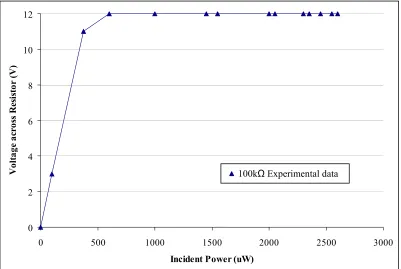
dynamic range and saturation, the photo-receiver was terminated into a large load impedance of 100kΩ. As illustrated in figure 3, experimental results showed that the detector circuit’s dynamic range is limited by the large load impedance. Approximately 500µW causes the detector to drop the entire reverse bias voltage of 12 Volts across the load impedance.
It is obvious that one has to design a photoreceiver with respect to the expected input powers and the required sensitivity and bandwidth. High sensitivity, high speed and a large dynamic range can be achieved using a slightly more complex photo-receiver design, incorporating for example a transimpedance amplifier shown in figure 4.
10kΩ Experimental data
0 2 4 6 8 10 12
0 500 1000 1500 2000 2500 3000
Incident Power (uW)
V
ol
tage
ac
ros
s R
es
is
tor
(
V
[image:4.595.98.499.107.376.2])
Figure 3: Impact of large load impedance
[image:4.595.184.412.425.590.2]2.2 Measurement of Time response
Measuring the time response of photodiodes is certainly more challenging compared to thermal detectors, since these devices can exhibit bandwidths into the GHz range. For this experiment, the method employed was based on the use of approximate impulses by chopping the output of the HeNe laser with a mechanical chopping wheel. Since this method does not create very short pulses, the period of the response time of the photodetectors was reduced by loading them with a very high impedance, effectively to slow down the detection speed by increasing the Time Constant (RC) of the circuit. In order to ensure that the photodiode’s time response was being measured and not the beam profile of the HeNe laser, the chopping frequency was increased until a reduction in signal height was observed. At this point, the photodetector couldn’t follow the signal impinging on its active area.
The theoretical bandwidth of a simple photodetector circuit as described in the manufacturer’s data sheet is given
by = J L BW C R F π 2
1 . The diode’s capacitance
CJ is quoted in the data sheet of the photodiodes. It should be noted that any stray capacitance and impedance will reduce the bandwidth below this theoretical value. As an example, let’s compare the theoretical value for the rise-time, using RL = 50Ω, to the value mentioned in the data sheet (parameters listed in Table 1).
The rise time is calculated as = BW r F
T 0.35 . For CJ = 40pF Tr= 14ns (quoted), compared to Tr=
4.4ns calculated. The calculated value is the absolute maximum of what can be expected from the photodetector; low cost packaging of the photodetector will not allow the user to achieve the theoretical limits. This was realised when the measured results for different load impedances are compared with the calculated results. For example, in table 2 shows the calculated and measured rise times corresponding to load impedances of 100KΩ
and 1MΩ. One contributing factor for the discrepancy is due to the additional BNC cable in place between the photodetector and the oscilloscope.
Table 2: Calculated and measured rise times for the photodetector under investigation
Load Resistance RL Measured Tr Calculated Tr
100KΩ 50µs 8.8µs
1MΩ 800µs 88µs
3. Conclusion
This experiment has provided the opportunity to explore key properties of a low cost photodetector for general applications in optical detection of light sources. In assessing parameters such as responsivity and time response, it has been observed that the
4. References
[1] Vaezi-Nejad S M, “A random Walk in Sensors: Recent Advances and Market Opportunities”, Measurement and Control Journal of Institute of Measurement and Control, Vol. 31, pp80-85, April 1998.
[2] Kapusta M et al, “Hamamatsu S8550 APD array for high-resolution scintillator matrices readout”, Nuclear Instruments and Methods in Physics Research A, 504 pp139-142 (2003). [3] McGrath A D, and Vaezi-Nejad S M, “Measurement of Luminescence in Coloured Printed materials” Journal of Metrology and Measurement Systems, 2006, Vol. XIII, No.3, pp221-230, Sept 2006.
[4] Andreev V M et al, “GaAs and AlGaAs photodiodes for ionizing radiation detectors”, Solid-State Electronics 47, pp1835-1841 (2003).