A SIMULATION
MODEL FOR
STRUCTURES
QUANTITIES/PRICE GENERATION COST
REINFORCED CONCRETE FRAMED
P.A BOWEN1 AND R.G. TAYLOR2
1 Department of Construction Economics and Management, University of Cape Town, South Afffcs end 2Department of Property Development and Construction Economics, Universfty of Natal, DUlban, South Afriea
Abstract
Conventional approaches to the measurement of construction work are crttlcally examined, and the risk and uncertainty In the pricing of these measured Items discussed. Implications for Mure practice are considered,' and a model framework for purposes of estimating and tender documentation using statistical procedures is proposed. The potential use of simulation is examined by means of a practical example which draws upon data relating to reinforced concrete framed office buildings. The developed model is examined and proposals for Mure development presented.
Keywords: Cost modelling, simulation, quantities generation, price estimating
Introduction
Systems of price forecasting and measurement of construction works have reached their highest degree of refinement (and complexity) in the traditional bills of quantities. It would appear as if the overriding assumption has been that a raised level of detail is synonymous with a reduction in risk for the contracting community (Skitmore and Patchell, 1990). Taken at face value, this supposition appears to be reasonable, but ignores the fundamental issue of achieved price accuracy, the extent to which added detail does, in fact, reflect complexity, and the need to achieve maximum efficiency in the use of computers (cf. Lowe [1986]). This suggests that mandatory systems of measurement may require ·re-thinking' from first principles.
and ·norms' as a basis for tender documentation. This necessitates a consideration of the documented evidence relating to the degree of accuracy inherent in existing measurement and pricing procedures. A further objective is, therefore, to consider the uncertainty which attends the measurement and pricing process and, in consequence, how the use of statistical techniques might be found to be a reasonable approach to tendering and estimating for construction works.
The proposed modelling technique is, at present, restricted to the treatment of building · cost' and ignores the wider issues of quality, revenue, and profitability.
Quantities and prices
The Higgin and Jessop (1965) research report of the Tavistock Institute referred.to the bill of quantities as a
hypothetical construct.
It was also stated that the uses of the bill beyond the tender stage was, by admission of quantity surveyors and contractors alike, somewhat limited. This is a reasonable assertion which is given further credibility by the phenomenon of extensive variations to most building contracts, as well as the provisional bill of quantities which appears to be growing in stature for private s�ctor work.As a further aspect, it can be said that the pricing of bills of quantities has also moved in the direction of the hypothetical. Contractors are pricing bills of quantities in a manner best suited to suit their own cash flow interests. This may take the form of the familiar phenomenon of 'front-end loading', but today is more likely to be influenced by consideration of anticipated escalation, resource availability and/or relative advantage in respect of certain trades, and current workload. Cattell (1984}, for example, has hypothesised a system of item pricing whereby individual items are priced on a substantially hypothetical basis in order to optimise what he refers to as ·nett financial benefit'. This involves the manipulation of basic prices to give better returns to the contractor based on his assessment of the timing of site operations relative to payments and attendant escalation and retention.
Many authors have addressed the issue of the variability found in trades and individual items of work {e.g., Beaston, 1975; Mathur, 1982; Ashworth, 1983; Flanagan and Norman, 1983; Morrison, 1984; Raftery, 1987; Hardcastle
et al.,
1988; Bowen, 1993). All have demonstrated the possibility of extremely high variability at individual item level, even In instances where tender price variation is relatively low. To illustrate the uncertainty associated with item price rates, rates for eight different items of measured work typically found in bills of quantities were obtained from the Bureau of Economic Research (B.E.R.}. These rates were supplied to the B.E.R. in the first instance by ten quantity surveying firms in the Western Cape. To ensure a reasonable sample size, rates for two consecutive months (July and August 1990) were collected. The August1990 rates were adjusted to July 1990 using the building price indices supplied by Medium-Term Forecasting Associates. The rates for the various items are given in Table 1, and various measures of dispersion presented in Table 2. No account is taken of contract size or contractor status.
Table 1 Variability of item price iates (July 1990 constant prices)
Prico nlCa for loam of work (Rj
Jtmu ofwort }uq 1990ralea Adjwud A-1990..,.
2 4 5 10
Excavate for 20.57 23,66 8.97 8.40 16.38 1:1..77 7.00 27.79 41.54 19.$7 foo1ma•
--"'
183.06 221.96 171.50 161.24 201.40 144.28 160,00 286.46 233.15 210.65foolmp
-
112.06 22!.7' 114.85 205.76 243.06 154.64 289.23 265.57 224.41-ea---o
llolfbrick wall 31.71 40.6& 35.36 32.&3 51.69 31.50 43.66 )7.21 37.99 Ooo hrickwall 64.31 77.97 70.73 67.31 18.24 62.00 15.40 69.65 65.64
25mmc...rt 11.07 11.67 10.93 9.89 11.10 8.00 11.87 15.82 11.75
-i-..i ... 11.46 11.60 9.64 10.99 9.00 12.44 9.30 8.06
p- I
3 C-P.V.A. 7.21 7.50 6.20 8.12 4.50 7.27 7.16 8.21
!
Table 2 Measures of dispersion of item price rates
Measure of dispcrsioo of item price ratu
Item of work Minimum Maximum Me&0 Slandanl Cocftfoient of
devialioo variatioa (!I\)
Exoava1etor 7.00 41.54 19.57 10.46
footior
Mau concrete in 144.28 286.46 198.71 42.73 21.50 footlnit
Roiofcm:od 154.64 289.23 219.26 42.69 19.47
concrete (general)
!
Half briok wall 31.50 Sl.69 38.07 6.SS 17.21
Oaobrickwall 62.00 88.24 72.37 9.39 12.97
25mm j;:ement 8.00 15.82 11.34 2.07 18.25
ICrood
IntemaJ c�ment 8.06 12.44 10.31 1.52 14.74
plaster
Table 1 illustrates the variability found in practice in price rates for the eight items of work. In this example, the coefficient of variation was found to be as high as 50% for the identical item of measured work (see Table 2). These findings lend credence to the notion that price rates contained in bills of quantities are merely � notional breakdown
of the overall tender price and are tempered with so many tactical considerations as to render them largely unreliable for price modelling. This is seen as cause for concern given the fact that priced bills of quantities are the major source of price data used by quantity surveyors (Bowen, 1993).
[image:4.404.45.388.217.567.2]Beaston (1975) produced figures relating to the coefficient of variation for the average of several items in a trade. In general tenn_s, 'labour only' items reflected a greater dispersion of prices than those with both ·1abour and material' components, and would appear to reflect a relatively arbitrary allocation on the part of contractors for time delays associated with complexity. The important question is whether such an allocation can be achieved by different means than that of detailed measurement.
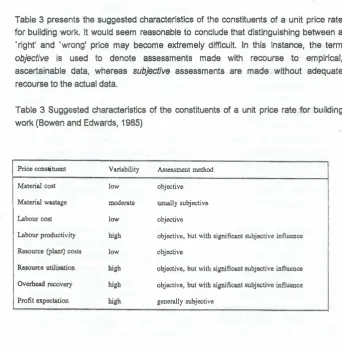
Table 3 presents the suggested characteristics of the constituents of a unit price rate for building work. It would seem reasonable to conclude that distinguishing between a 'right' and ·wrong' price may become extremely difficult. In this instance, the term
objective is used to denote assessments made with recourse to · empirical,
ascertainable data, whereas subjective assessments are made without adequate recourse to the actual data.
Table 3 Suggested characteristics of the constituents of a unit price rate for building work (Bowen and Edwards, 1985)
Price constituent Variability Assessment method
Material cost low objective
Material wastage moderate usually subjective I Labour cost low objective
Labour productivity high objective, but with significant subjective influence
Resource (plant) costs low objective
Resource utilisation high objective, but with significant subjective influence
Overhead recovery high objective, but with significant subjective influence
Profit expectation high generally subjective
The problem of item price variability is exacerbated by the sampling techniques employed by most quantity surveyors for price forecasting purposes. Using just one item price rate from a historic project is a tactic fraught with risk, yet one frequently resorted to by quantity surveyors (Property Services Agency (P.S.A), 1981 ). Furthermore, few price forecasts prepared by professional quantity surveyors give explicit consideration to the confidence limits attached to the range of prices within which the eventual outcome is expected to fall (Bowen and Edwards, 1985).
Flanagan and Norman (1983) provide a useful summary of the problem of price prediction as follows:
The single factor that characterises all price forecasting is uncertainty. Price prediction is not
a
precise .scientificexercise,
but an art which invoives intuition and expert judgement.The findings of Skitmore (1985) and Skitmore et al. (1990) lend support to this conclusion. Beaston (1983, 1986), in dis?ussing the incidence of risk in pricing, points out that the apparent loading of prices may simply be a reflection of legitimate perceptions on the part of contractors. This is necessarily subjective.
Edwards et al. (1990) conducted empirical research into the variability associated with the
measurement
of building areas in the preparation of ·superficial area' price forecasts. Given that the area of a building is a finite quantity which can be physically and 'precisely' determined, it would seem reasonable to assume that the area input factor could be treated in a straightforward, deterministic manner. Edwardset al.
'.1990) concluded that greater variability occurs in unit price rate selection than in building area measurement for the type of project under consideration. The magnitude of the variability occurring in the area measurement was not large (a coefficient of variation of approximately 3%). However, the combined effect of variability present in building area measurement and price rate selection was to increase the variability occurring in the product of these two.
performed and the number of items to be incorporated in the forecast. This assessment is purely subjective and will vary between quantity surveyors.
Considering price uncertainty in conjunction with the provisional (uncertain) nature of the quantities contained in a number of .bills of quantities, leads to the belief that comparable results to those already achieved on the strength of an acceptance of the inaccurate nature of several aspects of the existing system. The arguments which follow are similar to those of others (e.g., Zewe (1980), Hunt (1983), Brandon (1983), and Skitmore and Smith (1991)), who have suggested the generation of quantities through the use of statistical techniques. The proper statistical use of 'averages' and ·norms' as a basis for quantification may, in fact, produce acceptable estimates/tender results, without the loss of the competitive element. The only pre-requisite for such a step is an acceptance of the imprecise nature of the existing system, a realisation of the status of the bill as a tender document, and an acceptance of the removal of bills of quantities from a position of centrality.
The proposed model
Buildings vary principally in terms of the functions which they are intended to perform. For any specific function, the possibility of variation in form or assembly is not great, given a specified state of technology and prevailing norms governing accommodation standards.
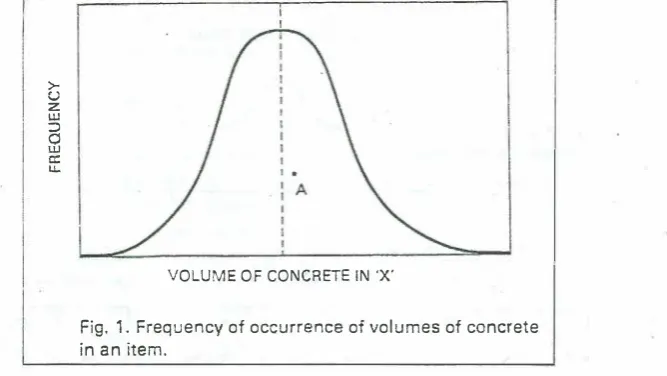
Unit quantities can reasonably be expected to be relatively consistent for buildings of a particular type, with any differences being explained in terms of physical features and attributes. This means that, through an examination of sufficiently large quantities of data, it should be possible to establish frequency distributions for unit quantities of materials and labour present in buildings of various types. It should also be possible to establish, in order of relative importance, those physical features responsible for variation in quantity in various building types i.e., responsible for a particular position within the frequency distribution. Mathur (1982) has made use of this principle at the level of building elements, suggesting the use of Monte Carlo simulation in order to merge the frequency distributions of element costs to provide a probabilistic total building cost. There is reason to believe that this principle would be valid in the establishment of probability distributions for the unit quantities of ·major' items of construction. These could subsequently be merged with price distributions to form a distribution of estimated item price.
Reference to the ·major' items of construction implies that the scale of the task is not as great as initially suggested. Researchers such as Bennett, Morrison and Stevens (P.S.A., 1981), Ashworth and Skitmore (1982), Stevens (1983), Homer et al. (1986}, Asif (1988) and Ogunlana (1989) have addressed the issue of the relationship between
the accuracy of the price forecast and the numb.er of items or work pack.ages incorporated therein. Bennett et al. (P.S.A., 1981) concluded that a major factor contributing to the dtfference between the actual and theoretically possible accuracy of price forecasts is the selection of items to incorporate in the forecast, and furthermore state that 'construction is inherently uncertain and cost can only be estimated within margins defined by this uncertainty. Methods of estimating which are more detailed than this uncertainty warrants are wasteful'. It would seem desirable, therefore, for the number of items or work packages contained in price models to reflect the level of abstraction of the model. A balance needs to be struck between the desire on the part of quantity surveyors to implement as detailed a model as early as possible (Morrison and Stevens, 1980) and the marginal rate of increase in accuracy per unit item added. Seymour (1984) and Jefferson (1985), for example, provide evidence to support the contention to the effect that 80% of cost resides in 20% of the product (an adaptation of Pareto's Law of Income Distribution). In the case of quantity surveying, Harmer (1983) suggests that 80% of the cost can be accounted for in 20% of the measured items. Consequently, the task of formulating distributions can feasibly be narrowed to an identification and analysis of the major 20% of bill items, provided that separate analyses are pursued for buildings of different types. The remaining 20% of ihe cost, accounted for by the vast majority of 'minor' items, generally have a high proportion of labour input, or are incidental to the mainstream of production. The treatment of these items from a viewpoint of measurement has been inconclusively researched by Raebum (1982). Nevertheless, their evaluation has relevance to the question of a revised, shorter approach to measurement and estimating.
> u z
LU
::i 0 LU
C: u.
VOLUME OF CONCRETE IN 'X'
Fig. 1. Frequency of occurrence of volumes of concrete in an item.
Arising from the facility for updating quantities, it becomes possible to generate quantities to the point of sufficient accuracy for estimate and tender purposes. This coricept of 'sufficient accuracy' is one which requires testing in order to determine the level at which accuracy becomes regarded as being adequate for estimating and tender purposes.
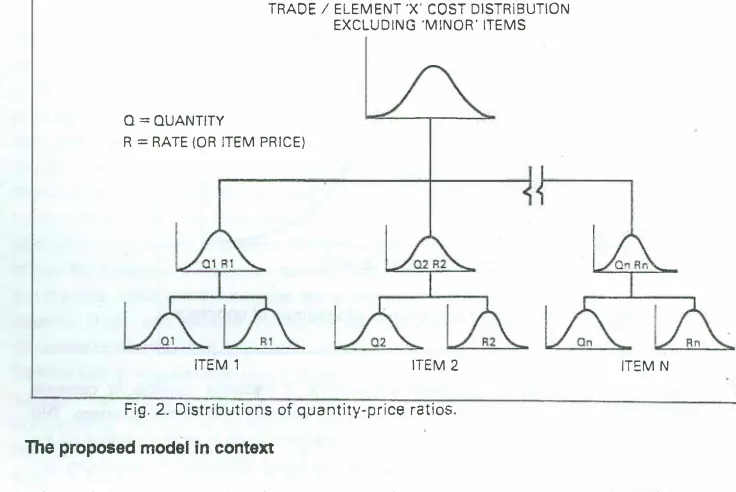
The conceptual framework described above can be extended to accommodate price estimates. Price distributions combined with those of quantity (the product of unit quantity and total area) by process of random selection has appeal as a means of estimating which gives full recognition to the uncertainty inherent in the price. It is likely that unit prices would display normality of distribution, and that price distributions for various items could be derived from representative samples of buildings located in various areas and constructed at various points in time. Price distributions afford the facility for pricing at various levels of risk, which specific level may be specified in advance.
As a means of estimating, the generation of quantity and price using random selection provides a system which has parallels in practice. The generation process cannot be seen as finite and is, rather, one figure selected by the estimator from a range of possible figures. Quantities can be seen to approach a high degree of definition as design develops but would, in the first instance, best be regarded as having values bound by some measure of probability, and selected at random. Such an approach provides the facility for estimating within broad bands of confidence rather than at one definite level. This
is a
more realistic approach, and one in keeping with the imprecise nature of the estimating process. The statistical basis for this would be Monte Carlo simulation, and is depicted in Fig. 2. [image:8.406.39.373.11.199.2]Q=QUANTITY
TRADE/ ELEMENT 'X' COST DISTRIBUTION EXCLUDING 'MINOR' ITEMS
R = RATE (OR ITEM PRICE)
ITEM 1 ITEM 2
Fig. 2. Distributions of quantity-price ratios.
Toe proposed model in context
ITEM N
It is desirable, for the sake of conceptual clarity, to place the proposed modelling system within the overall discipline of the economics of building. Newton (1991) provides a comprehensive account of attempts by researchers, in response to a call for fresh thinking in cost modelling, to develop techniques that are improvements on traditional methods.
Cost modelling has been defined (Ferry and Brandon, 1991) as the symbolic representation of a system, expressing the content of that system in terms of the factors which influence its cost. It has long been argued (Reynolds, 1978) that, for the building economist to accept any responsibility for design economy, he or she must participate in and be capable of influencing the design. In an attempt to permit the quantity surveyor to pre-empt design, various cost models have been developed (for example, Asif (19.88), Boussabaine (1991), and others) but, as Bowen (1993) asserts, such models have been of limited value, passive in application, and often inappropriate to the particular stage of design. Furthermore, they are unable to provide design-to cost control, a feature considered an essential component of multi-disciplinary design action.
[image:9.396.15.383.22.268.2]Development of the model • a prototype
Model methodology
To validate the cost generation model proposed in the previous section, quantity- and price-related data were extracted from the historical projects of a large quantity surveying practice in Durban. These projects were all reinforced concrete framed office structures. The very nature of office building design configurations, coupled with the obvious need for as much uniformity as possible, restricted the sample size to thirty three projects, a number considered adequate for a pilot study of this nature. The fact that the data were collected from only one geographical source is seen as a limitation of the study.
The intention was to develop a model capable of generating the unit quantities (for previously established ·major' items) relevant to the concrete framed structures of multi-storey office buildings. These unit quantities, coupled with generated prices per unit quantity, would then be used to estimate the total cost of the framed structure, based on the total area of that particular building. 'Major' items were defined as those cumulatively accounting for eighty percent of the trade total.
More specifically, the mechanics of the prototype model may be summarised as follows:
: cumulative probability distributions are derived for the unit quantity and price data for the ·major' items involved,
: Monte Carlo simulation is used to select (at random) unit quantities and item prices from the price and unit quantity distributions. For example, the quantity data could be the amount of beam concrete per square metre of slab area i.e., Quantity = Qty (m3)/m2. Similarly, the price chosen from the price distribution could be the price per cubic metre of concrete in beams i.e., Price= Rfm3,
: sampling occurs (say) 300 times, to produce (for example) an extended total cost per
square metre on plan of concrete in beams i.e., Total costtm2 = Qty/m2 x R/m2. In this
manner, an extended total cost per square metre distribution is produced for each
relevant bill item, with its attendant mean and variance,
: the mean value for each bill item is multiplied by the area of the building to produce that particular bill items' total
cost,
and,: the summation of each item's total cost will produce the overall total cost of the framed structure.
Nature of data
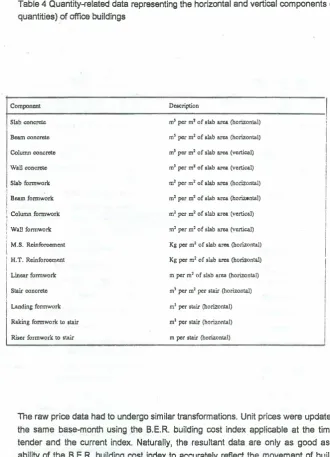
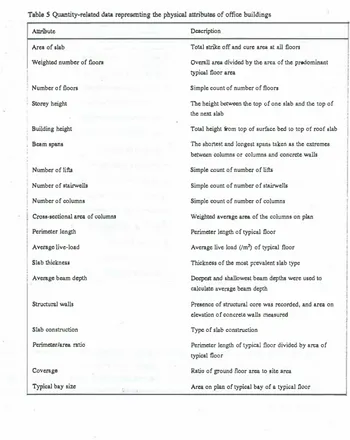
[image:11.379.32.353.313.569.2]The quantity-related data were derived from the ·concrete', 'Forrnwork' and 'Reinforcement' trades of the relevant bills of quantities, and from the architect's drawings. The data collected fell into two main categories, namely: that describing or representing the horizontal and vertical components (i.e., unit quantities) of the building (e.g,, cubic volume of slab concrete per square metre of slab area {horizontal component) and area on elevation of wall formwork per square metre of slab area (vertical component)); and that chosen to reflect the physical attributes of the building (e.g., storey height, weighted number of floors, slab thickness, etc.). The complete set of data collected reflecting horizontal/vertical components (unit quantities) are summarised in Table 4, whilst that describing the physical attributes are depicted in Table 5.
The raw quantity-related data collected from the project documentation were then transformed into usable form. For example, the variable 'beam concrete' was derived by aggregating the total volume of concrete for all classes of beams (e.g., beams, isolated beams, wall beams, inverted beams, etc.) and dividing the total volume by the total slab area - resulting in the volume of concrete in beams per square metre of slab area. This type of transformation was applied to the raw data to derive all the variables contained in Table 4.
!
Table 4 Quantity-related data representing the horizontal and vertical components (unit quantities) of office buildings
Component
Slab concrete
Beam concrete
Column concrete
Wall concrete
Slab formwork Beam formwork
Column formwork Wall fonnwork
Dcacription
m' per ml of slab area (horizontal)
m' per m2 of •lab area (horizontal) m' per m2 of slab arc:& (vertical) m' per m2 of 1lab area (vertical)
m' per m2 of slab area (horizontal)
m2 per m2 of slab area (horizontal) m' per m2 of slab area (vertical)
m2 per m' of slab area (vertical)
I
I.
I
I
i
I
I
M.S. Rcinforoemcnt Kg per m' of slab area (horizontal)I
I
H.T. Rcinforocmcnt Kg per m2 of slab area (horizontal)I
Linear formwork m per m' of slab arcs (horizontal)
!
Stair concrete m' per m2 per stair (horizontal)Landing formwork m2 per stair (horizon!al)
Raking formwork to stair m' per stair (horizontal)
i
Riocr formwork to stair m per stair (horizontal)
The raw price data had to undergo similar transformations. Unit prices were updated to the same base-month using the B.E.R. building cost index applicable at the time of tender and the current index. Naturally, the resultant data are only as good as the ability of the B.E.R. building cost index to accurately reflect the movement of building prices over time.
5
Table S Quantity-related data representing the physical attributes of office buildings
Altribute
Area of slab
Weighted number of floors
Number of floors
Storey height
Building height
i Besm spans
Number of lifts
Number of tta�lls
Number of columns
Cross-sectional area of columns
Perimeter length
Average live-load
Slab thickneH
Average beam depth
Structural walls
Slab construction
Perimeter/area ratio
Coverage
Typical bay size
Description
Total strike off and cure area at all floors
Overall area divided by the area of the predominant typical floor area
Simple count of number of floors
The height b-= the top of one slab and the top of the next slab
Total height from top of surface bed to top of roof dab
The shortest and longest spans taken as the extremes between columns or columns and concrete walls
Simple count of number of lifts
Simple count of number of stairwells
Simple count of number of columns
Weighted average area of the columns on plan
Perimeter length of typical floor
Average live load (Im') of typical floor
Thickness of the most prevalent slab type
Dccpcst and shallowest beam depths were used to calculate average beam depth
Presence of ltrUctural core was recorded, and area on elevation of concret<: walls measured
Type of slab construction
Perimeter length of typical floor divided by area of typical floor
Ratio of ground floor area to site area
Analysis of data
The descriptive nature of the data relating to each of the (physical attribute) quantity related variables was established by statistical analysis. This analysis, using the
Statistical Package for the Social Sciences (SPSS) (Nie et al., 1975) statistical
package, generated statistics such as the mean, standard error, standard deviation and variance, skewness, range, and maximum/minimum value amongst others. In addition, the frequency distributions for each of the variables was plotted, examples of which are shown in Figs. 3 and 4 below. The ·mean description' of a ·typical' building is taken from this analysis, and reflects the characteristics depicted in Table 6.
An Identical procedure was followed for the unit quantity data, and this resulted in the creation of the descriptive statistics, and the frequency distributions for the unit quantity variables. Figures 5 and 6 depict some of the derived frequency distributions. Similarly, statistical · analysis was performed on the price-related data, the descriptive characteristics noted, and frequency distributions plotted, examples of which are �_hqwr, i.n.Figs,? and 8.
Area of slab (m2)
,,
..
IHI""
....
H1>1 10101 11114
,11,, -l-""!!!1""""
...
11'211 11011 IOIHIHH -i-�-14 ... HHI HOl1 HIH 11817 11410
HIOI
attfl F=---t---;---r----r---i
,.
Frequency
-1.rlH 1 •••rlH 2
Fig.3. Frequency of area of slab
Storey height (m)
... iiiii�:T�
..
,
•..
...
,
..
..•
10
,.
Frequency -l•rlM 1 •••••• I
Table 6 Mean description of a 'typical' building
I
Attribute ValueI
I -"' .,,,
8916 m2Number of floors 9
I
Number of stairwells Between 2 and 3 per floor
Storey height 3.69 m
I
i Total building height 34.04 m
I
I
I
!I Trade total R 489 566
Slab concrete (m3/m2)
o.,o, ,---,-.---:--:--:-, 0.111 <:.._ •
o.,u 0.187 0.141 0,101 0.11a 0.1H 0,197 0.201 0.211 0,211 0,1!41 0,117 O.HI o.aa,
<'" •
o.ns C--:
0.101
I
,.--:
c-:
0,117
:
c__:
�-.�!� 1!!!!'!!��!!!!!�---+----+---l
I
Frequency j
Beam formwork (m2/m2)
l
7 �,---,---,
,.
"
I
S4
••
H
..
-+--�--70 78
..
"
101 111 114 111
{l� k-.j
171 :
187
0 2 •
Frequency
-8•tlH 1 •••rlH I
Fig.6. Frequency of beam formwork / m2
Price (R/m3) 11 t7 II H
..
.,
41::
ee---71 77
..
H H 101 107 11S
,,.
121
10 u
111
1!!!!=�----.---i---i----+----1
•
•
Frequency -a1rlt1 ·t •••,lei I
Flg.7 Frequency of slab concrete price
19
Price (R/m3) a
•
7•
11 18 11 17 11 21 ta H 17 H 01 88 H 87
..
41.. ,'.---;.----;---;----;---;.----;----i
•
Frequency
- Serles 1
a
StrlH IFig.a Frequency of beam formwork price
I
I
\Nhilst it is acknowledged that a number of the variables possess frequency distributions reflecting unusual shapes, it was thought that this may be a direct result of the influence of the physical attribute data, coupled with the relatively small sample size. This facet of the model requires further, more detailed analysis, and will be the focus of attention as part of the continued development of this simulation model.
Monte Carlo simulation
Having examined (albeit briefly) the uncertainty associated with each of the quantity and price-related data, Monte Carlo simulation was applied to the unit quantity and price distributions in a manner based on the principles embodied in Fig. 2. The purpose of the simulation procedure was tv,,ofold. Firstly, it provided a means of assessing the manner in which the uncertainty associated with each of the respective variables combine to influence the uncertainty in the total estimated cost of the framed structure; and secondly, it provides an instrument for the generation of unit quantities and the estimation of cost.
The Monte Carlo technique was applied to each pair of price and unit quantity distributions {e.g., volume of slab concrete per m2 of slab area and price per cubic metre of slab concrete), thus generating a new costtm2 distribution for each of the fifteen items reflected in Table 4 above. For each of the generated distributions, the SPSS computer package generated a histogram, plotted a distribution curve, and provided the associated descriptive statistics.
For illustrative purposes, the distribution of total cost of concrete in slabs per square metre of slab area is shown in Fig. 9. The distribution shape is skewed to the left with a
skewness value of -0. 173. The mean value is R 15.58/m2 and the standard deviation is
6.59, indicating a coefficient of variation of 42%. The mean value for this variable did not equal the most likely value, in terms of frequency of occurrence, indicative of the slight bias in the distribution.
Total cost (R/m2) o.,o
2.ar a,14 6.51. 1.0,
....
10..2, 1t.11 11.11
,,.,,
11.41
11,1 ta.ea 21.21 H.82
,,.,
21.07 17.114 21.12 10,'9 H.H
10 20 ao
Frequency - 8erlaa 1 - S•rle& 2
Fig.9 Freq.of total cost of slab cone.
21
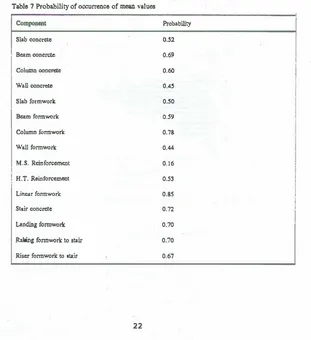
The frequency distributions provide a new dimension to cost modelling. For example, for each cost value for concrete in slabs, there is an associated probability of occurrence. Thus, if a probabilistic aspect is added to the model, the estimate of the cost of the framed structure can be qualified in probabilistic tenns. A cumulative probability distribution was plotted for each of_the fifteen unit quantity variables in an endeavour to establish the probability of the mean value occurring. Unfortunately, the statistical package did not provide such a facility and so this was done manually. The results of this analysis are shown in Table 7, and indicate that, for example, the mean value of R 15.58fm2 for the cost of slab concrete per square metre of area has an
associated probability of 0.52 of occurrence.
[image:19.390.37.348.243.583.2]The probability values depicted in Table 7 provide insight into the ·confidence' that can be placed on each of the variables. The large range (0.16 - 0.85) is source for concern, but is not totally unexpected in terms of the data base used for the development of the model.
Table 7 Probability of occurrence of mean values
Slab concrcle Beam concrcte
I
Column ooncretc Wall concrueSlab formwork
I
Beam formwork Column formworkWall formworl(
M.S. Reinforcement I
I
H.T. Reinforumenti
1
Linear farmwork
Stair concrete
Landing formwork
·Ral.ing formworl( to stair
Riser farmwork to ll!air
Probability
0.52
0.69
0.60
0.45
0.50
0.59
0.78
0.44
0.16
0.53
0.85
0.72
0.70
0.70
Testing the model
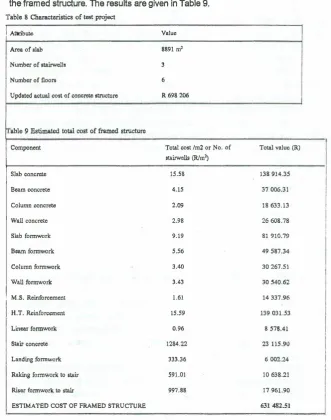
In order to assess the performance of the model, the prototype was applied to an office project displaying characteristics similar to those of the buildings contained in the original database. The characteristics of the selected test project are reflected in Table 8. The factors required to be inserted into the model were building area (8891 m2) and number of staircases (3x6=18). These factors were then applied to the mean values for the total costtm2 produced by the simulation procedure, to generate the overall cost of
[image:20.397.45.377.142.563.2]the framed structure. The results are given in Table 9.
Table 8 Characteristics of test project
I
AttributeArea of slab Number of swrwclls Number of floors
Updated actual cost of concrclC stnicture
able 9 Estimated total cost of framed slnicture
Component
I
I Slab concrete Beam ooncrcte Column concrete
1 Wall concrete
Slab formwork Beam formwork Column formwork Wall formwork
I
M.S. ReinforcementI H.T. Reinforcement Linear formwork Stair concrete
Landing formwork Raking formwork to stair Riser formwork to stair
ESTIMATED COST OF FRAMED STRUCTURE
Value 8891
rrr
36
R 698 206
Total cost lm2 or No. of stsirwclls (Rim') 15.58 4.15 2.09 2.98 9.19 5.56 3.40 3.43 1.61 15.59 0.96 1284.22 333.36 591.0l 997.88 23
Total value (R)
The estimated cost varied from the actual cost by 10%. This level of accuracy, whilst encouraging, should be seen against the background of the limited sample size and possible variable inter-dependence, both of which may lead to better results than the prototype model is actually capable of producing. The variability associated with the various distributions is indicative of the degree of circumspection with which this test result should be handled.
Conclusions
The proposed modelling technique is seen as a tentative proposal, leading to the development of a simulation technique for use in the procurement process of buildings, with the aim of contributing towards a more effective understanding of the relationship between design and cost. Testing the prototype of the model yields results that, whilst not without shortcomings, appear promising for the development of a more rigorous procedure. Such future development will have to focus attention on the problems of adequate sample size, variable inter-dependence, distribution bias, to name but a few. The modelling technique so developed will hopefully facilitate a dynamic decision making process, and will generate comparative design/cost solutions. Further, the traditional boundaries of cost modelling may be transcended in that the applicability of the proposed technique to functions (e.g., tender documentation) other than cost will be investigated.
Acknowledgement
The authors gratefully acknowledge the contribution of Mr Patrick Dominy, research assistant, to this study.
References
[1] Ashworth, A. 1983.
Building Economics and Cost Control.
Butterworths, London.[2] Ashworth, A. and Skitmore, R.M. 1982. Accuracy in Estimating.
Occasional
Paper
No.27,Chartered Institute of Building, Kings Ride, Ascot.[3] As�. M. 1988.
Simple Generic Models for Cost-Significant Estimating of
Construction Project
Costs. Unpublished Ph.D. Thesis, Department of Civil Engineering, University of Dundee, Dundee.[4] Beaston, D.T. 1975. One statisticians view of estimating.
Charlered Quantity
Surveyor,
Buildingand Quantity Surveying Quarterly, Vol.2, No.4, pp.49 - 54.--- - ----
---[7] Boussabaine,A 1991. An Expert System Prototype for Construction Planning and
Productivity Analysis. Unpublished Ph.D. Thesis, Department of Building Engineering, University of Manchester Institute of Science and Technology, Manchester.
[8] Bowen, P.A. 1993. A Communication-based Approach to Price Modelling and Price Forecasting in the Design Phase of the Traditional Building Procurement process in
South Africa. Unpublished Ph.D. Thesis, University of Port Elizabeth.
[9] Bowen, P.A. and Edwards, P.J. 1985. Cost modelling and price forecasting:
practice and theory in perspective. Construction Management and Economics,
Vol.3, pp.199-215.
[10] Brandon, P.S. 1983. The writing on the wall. Chartered Quantity Surveyor, Vol.5, No.10, pp.378- 379.
[11] Cattell, D.W. 1984. A Model for using Item Price Loading by Building Contractors.
Unpublished paper, Department of Quantity Surveying, University of the Witwatersrand, Johannesburg.
[12] Edwards, P.J., Bowen, P.A. and Cole, J. 1990. Measurement and Unit Price Rate Variability in Simple Price Forecasting Models for Construction Projects: A
Collaborative Study. Report, Department of Building and Construction Economics,
Royal Melbourne Institute of Technology, Melbourne, August.
[13] Ferry, D.J. and Brandon, P.S. 1991. Cost Planning of Buildings. Blackwell Scientific
Publications, Oxford.
[14} Flanagan, R. and Norman, G. 1983. Risk analysis - an extension of price prediction techniques for building work. Construction Papers, Vol.1, No.3, pp.27 - 34.
[15} Hardcastle, C., Brown, H.W. and Davies, A.J. (1988) Control of petrochemical civil engineering costs. Transactions, American Association of Civil Engineers, pp.A7.1-A7.3.
[16] Harmer, S. 1983. Identifying significant B.Q. Items. Chartered Quantity Surveyor,
October, pp.95 - 96.
[17] Higgin, G. and Jessop, N. 1965. Communications in the Building Industry.
Tavistock Publications, London.
[18] Homer, R.M.W., McKay, KJ. and Saket, M.M. 1986. Cost-significance in estimating and control, in Proceedings of the Second Yugoslav Symposium on Construction Management, Opatija, April, pp.571-585.
[19] Hunt, G. 1983. Quantity surveyors beware! Chartered Quantity Surveyor, Vol.5,
No.1 O, pp.376 - 377.
[20] Jefferson, RF. 1985. The quantity surveyor's contribution to the construction
process • an alternative viewpoint, in Proceedings of the Congress of the
Association of South African Quantity Surveyors, Port Elizabeth.
[21] Lowe, J. 1986. Problems of preconception. Chartered Quantity Surveyor, Vol.9, No.3, p.21.
[21] Lowe, J. (1986) Problems of preconception. Chartered Quantity SuNeyor, Vol.9, No.3, p.21.
[22] Mathur, K (1982) A probabilistic planning model, in Building Cost Techniques:
New Directions(Ed. P.S. Brandon), E. &F.N. Spon Ltd., London, pp.181-191. [23] Morrison, N.A.D. 1984. The accuracy of quantity surveyors cost estimating.
Construction Management and Economics, Vol.2, pp.57-75.
[24] Morrison, NAO. and Stevens, S.D. 1980. A construction cost data base: cost planning in theory and in practice. Chartered Quantity Surveyor, June, pp.313- 315.
[25] Newton, S. 1991. An agenda for cost modelling research. Construction
Management and Economics, Vol.9, pp.97-112.
[26] Nie, N., Nie. C., Hull, C., Jenkins, J., Steinbrunner, K and Bent, K. 1975.
Statistical Package for the Social Sciences (2nd. Ed.). McGraw-Hill, New York.
[27] Ogunlana, S.O. 1969. Accuracy in Design Cost Estimating. Unpublished Ph.D.
Thesis,Department of Civil Engineering, Loughborough University of Technology, Loughborough.
[28] Property Services Agency (P.S.A.) 1981. Cost Planning and Computers.
Directorate of Quantity Surveying Services, Department of the Environment, Her Majesty's Stationery Office, London, June.
[29] Raebum, B.D. 1982. An Evaluation of Alternative Methods of Presenting Minor
Items in B ills of Quantities. Unpublished dissertation, Department of Quantity
Surveying, University of the Witwatersrand, Johannesburg.
(30] Raftery J.J. 1987. The state of cost/price modelling in tha U.K Construction Industry: a multicriteria approach, in Building Cost Modelling and Computers
(Ed. P.S. Brandon), E. & F. N. Spon Ltd., London, pp.49-71.
[31] Reynolds, G. 1978. On the cost model. Building, 20th October, p.91.
[32] Seymour, M. 1984. Pareto's Law and Traditional Bills of Quantities.
Unpublished dissertation.Department of Quantity Surveying and Building Economics, University of Natal, Durban.
[33] Skitmore, M. 1985. The Influence of Professional Expertise in Construction
Price Forecasts.Report, Quantity and Building Surveying Division, Department
of Civil Engineering, University of Salford, Manchester.
[34] Skitmore, R.M. and Patchell, B. 1990. Developments in contract price
forecasting and bidding techniques, in Quantlty Surveying Techniques: New
Directions (Ed. P.S. Brandon), Blackwell Scientific Publications, Oxford, pp.75- 120.
{35] Skitmore, R.M. and Smith, M. 1991. Automatic bill of quantities pricing.
Transactions, American Association of Cost Engineers, New York
[36) Skitmore, R.M., Stradling, S., Tuohy, A. and Mkwezalamba, H. 1990. The
[37} Stevens, S.D. 1983. The Use of Price Data from Analysis of Bills of Quantities
in Construction Price Estimating. Unpublished Ph.D. Thesis, Department of
Construction Management, University of Reading, Reading.
[38] Taylor, R.G. and Bowen, P.A. 1987. Parameter-based construction
measurement for tenders andestimates, in Proceedings of the C.I.B. W�5 10th
International Symposium on Organisation and Management of Construction,
London, Vol.1, Session 10, No.079, pp.165-174.
[39] Wilson, AJ. 1982. Experiments in probabilistic estimating, in Building Cost
Techniques: New Directions (Ed. P.S. Brandon), E. & F.N. Spon Ltd.,
London, pp.169-180.
[40] Wilson, A.J. 1984. Risk analysis in the design of commercial buildings, in
Proceedings of the C.I.B. W-55 3rd International Symposium ·on Building
Economics, Ottawa, Vol.1, pp.19 • 28.
[41] Zewe, M.S. 1980. Estimating building construction costs - a better approach
through models, in Transactions, American Association of Cost Engineers, New York.