September 20, 2013
DEVELOPMENT OF A DECISION
SUPPORT TOOL FOR BARGE LOADING
Author:
Lina Baranowski University of Twente
Master: Industrial Engineering and Management Track: Production and Logistics Management s0148768
Supervisors:
Marco Schutten University of Twente
Martijn MesUniversity of Twente
Danny Otter Combi Terminal Twente
Management Summary
Introduction Combi Terminal Twente B.V. (CTT) is a terminal operator that transports containers from the Port of Rotterdam via Hengelo to the customer and vice versa. The majority of containers that are shipped between Rotterdam and Hengelo are transported by inland barges. The number of goods that is transported by container is growing and barge planners have to deal with large amounts of data for hundreds of containers when making plans. A barge planner at CTT makes different types of decisions at different moments in the planning process of a barge. Currently, these decisions are based on experience and common sense. Planners do not make use of any structural decision support. In order to profit from the growth in transportation, CTT wants to optimize the use of their transportation means and increase the quality of transportation in terms of transportation time, frequency, flexibility, costs, and reliability. Therefore, the main research objective of this research is:
Design a method to support CTT’s barge planners to improve the quality of CTT’s transportation flows.
Method To meet this objective we develop a decision support tool that supports planners in the planning of containers on barges. The main objective for the tool is to create plans where all containers are delivered or picked-up in time. Furthermore, we have two secondary objectives. We want to minimize the trip duration and maximize the utilization rate of the barge. The method considers information of all containers in the planning process, while planners make subproblems. We structure the model in such a way that it is easy to adjust en add different aspects of the model.
ResultsWe test several settings of the model. We use the combination that generally performs best for the experiments we execute to determine the methods’ performance. From these ex-periments, we conclude that the method achieves the main objective and one of the secondary objectives (avoiding lateness and maximizing the utilization of the barge, respectively). The method has a varying performance with respect to the second secondary objective (minimizing trip duration).
Conclusions We conclude that the prototype tool has the potential to become a decision support tool that assists planners in their planning. At this point it provides planners with insights on urgency of containers and terminal visits and a foundation is made to built upon. With further development, the tool will be a valuable addition to the planning process, because it initially considers all information at once, instead of making smaller subproblems. Further-more, will planning become easier when using the tool because it also considers future planning.
RecommendationsIn order to make the decision support tool fully operational we recommend CTT to further develop the model:
import containers are ready to be picked-up, are planned to be picked-up by a barge, or are already picked-up and on their way to CTT.
- To register when original pick-up and closing dates are changed and when a container cannot be served in time, in order to measure lateness.
During this study we observed several subjects that are interesting for future research at CTT. We therefore recommend CTT to:
- To extend the model to make plans for a longer time horizon. - Develop performance indicators for plans.
- Investigate how CTT can make use of their terminal in Rotterdam to increase transporta-tion quality.
Preface
In 2006, is started at the University of Twente with the Bachelor Technische Wiskunde. Now, seven years later I will complete my first Master’s degree. I completed this study as a gradua-tion requirement for my Masters degree in Industrial Engineering and Management. The end of my Master thesis does not mean the end of my student life, because I already started to study for my teachers degree for Mathematics. For coming year I will stay at the University of Twente.
I am grateful that I was allowed to do my Master Thesis at Combi Terminal Twente. Be-cause of the open attitude, enthusiasm and collegiality of my colleges, I have had a great time. In particular I want to thank my supervisors, Danny Otter and Maurice Glandrup, who put a lot of confidence in me. Furthermore, I thank my supervisors form the University of Twente, Marco Schutten en Martijn Mes for guiding me through the process of writing my Master Thesis.
Finally, I appreciate the support of my parents, boyfriend and friends who believed in me, despite the ups and downs I passed through during the project. Your support in both the mental and the writing process, helped me to finish this work.
Lina Baranowski
Contents
1 Introduction 11
1.1 Problem description . . . 12
1.1.1 Container information . . . 13
1.1.2 Composition of cargo for one tour . . . 13
1.1.3 Synchronization of transportation . . . 14
1.1.4 Stowage . . . 15
1.1.5 Uncertainties in plan execution . . . 16
1.2 Research motivation . . . 16
1.3 Scope of research . . . 16
1.4 Research objective, questions, and approach . . . 17
2 Context analysis 19 2.1 Container sector . . . 19
2.2 Combi Terminal Twente . . . 20
2.2.1 CTT in numbers . . . 21
2.2.2 Services offered by CTT . . . 24
2.2.3 Networks . . . 25
2.3 Process flow . . . 26
2.3.1 Booking . . . 27
2.3.2 Barge planning . . . 28
2.4 Conclusions . . . 31
3 Literature overview 32 3.1 Planning and Scheduling . . . 32
3.2 Ship routing and scheduling . . . 33
3.2.1 Ship routing and scheduling methods . . . 33
3.2.2 Decision support . . . 34
3.2.3 Conclusions on ship routing and scheduling . . . 35
3.3 Constraints on loading problems . . . 35
3.3.1 Container-related constraints . . . 36
3.3.2 Item-related constraints . . . 37
3.3.3 Cargo-related constraints . . . 37
3.3.4 Conclusions on constraints for container loading problems . . . 38
3.4 Container Terminal Operations . . . 39
3.5 Transportation Quality . . . 39
3.5.1 Freight transportation quality measures . . . 39
3.5.2 Public transportation quality measures . . . 40
3.5.3 Conclusions on transportation quality . . . 41
3.7 Conclusions . . . 42
4 Solution design 43 4.1 Solution method . . . 43
4.1.1 Basic functionalities . . . 45
4.1.2 Structure of method . . . 46
4.1.3 Summary and Conclusions on Solution Method . . . 49
4.2 Description of heuristics and routines . . . 49
4.2.1 Preprocessing . . . 49
4.2.2 Maasvlakte Filter . . . 52
4.2.3 Planners Choice . . . 54
4.2.4 Other Filters . . . 54
4.2.5 Summary of Heuristics description . . . 60
4.3 Tool description . . . 60
4.3.1 Goal and Requirements . . . 60
4.3.2 User Interface . . . 61
4.3.3 Implementation . . . 62
4.3.4 Conclusion on Tool description . . . 63
4.4 Conclusions on Solution design . . . 63
5 Solution Test 64 5.1 Testing Setup . . . 64
5.2 Filter performance testing . . . 65
5.2.1 Order of filters . . . 65
5.2.2 Filter Performance . . . 66
5.2.3 Results of filter comparison . . . 67
5.3 Model output comparison with historical data . . . 69
5.3.1 Situation 1 . . . 69
5.3.2 Situation 2 . . . 70
5.3.3 Conclusions on model output testing . . . 71
5.4 One week of testing . . . 72
5.4.1 Conclusions on one week of testing . . . 74
5.5 Comparison in practice . . . 74
5.5.1 Setup of experiment . . . 74
5.5.2 Findings . . . 74
5.5.3 Conclusions on practice comparison . . . 75
5.6 Conclusions on model testing . . . 76
6 Conclusions and Recommendations 77 6.1 Conclusions . . . 77
6.2 Limitations . . . 78
6.3 Recommendations . . . 79
6.3.1 Recommendations from this study . . . 79
6.3.2 Recommendations for further research . . . 79
A List of definitions 85 B Numbers in terminals and barges 86 B.1 CTT . . . 86
C Flow Barge Planning 87
D Parameters and variables 92
E List of scheduling and planning method 94
F Dummy Data 96
G Practical test data 98
H Required Bookings Information 100
I List of Terminals 101
Chapter 1
Introduction
[image:11.595.73.522.492.541.2]There is almost no place on earth we cannot transport goods to or from. Most goods are transported in a number of steps. In different steps, different means of transportation are used, which are coordinated by operators. For example, Timberland’s shoes are, among others, produced in Zhongshan (China) and transported to Almelo with different means. The shoes are transported in a container by a truck to the nearest port, which is located in Tianjin. From here, the shoes are shipped by sea vessel to the Port of Rotterdam. Barges ship the containers from Rotterdam to the inland terminal in Hengelo. From here, the container is transported by truck to the distribution centre in Almelo. These series of consecutive steps is called a transportation chain and the steps are the links of the chain, e.g., the transportation from Zhongshan to Tianjin. Often, different means of transportation can be used for one link, e.g., the container with Timberland’s shoes could have been transported by truck directly from Rotterdam to the distribution centre. Figure 1.1 shows the links in the transportation chain from Zhongshan to Almelo.
Figure 1.1: Links in the transportation chain from factory to distribution centre
In Figure 1.1, we see that in this particular case, the container is transported by truck in the first link of the transportation chain. After that, it is shipped by sea vessel and then transshipped to an inland barge in Rotterdam. The barge brings the container to the inland terminal in Hengelo, where the container is transshipped to a truck, which brings the container to Timberland’s distribution centre in Almelo.
planning capacities of the operators. Furthermore, plans tend to change several times, even during execution.
The Port of Rotterdam is the only non-Asian port in the top 10 of the World Port Ranking 2011. It has the fourth position in the overall ranking and the tenth position in ranking of container traffic [Amercain Association of Port Authorities, 2012]. This makes that the Port of Rotterdam plays an important role for transportation chains starting or ending in Western Europe. The Port of Rotterdam invested in Maasvlakte 2, an extension of the port, to reinforce its position by increasing their container traffic capacity.
Combi Terminal Twente B.V. (CTT) is an operator, which manages links between the Port of Rotterdam and Hengelo, in a transportation chain to and from the Western European hinter-land. CTT strives for optimal use of the upcoming growth of the Port of Rotterdam. As an operator, CTT aims to manage their part of the transportation chain good as possible in order to serve its customers’ needs.
CTT’s main tasks are to ship and transport cargo containers from Rotterdam to Hengelo, from Hengelo to the customer, and vice versa. The majority of containers that are shipped between Rotterdam and Hengelo are transported by inland barges. The remaining part is mainly transported by truck and occasionally by train. In Hengelo, containers are transshipped from barges to trucks, which bring the containers to the customers. CTT’s planners currently solve planning problems without the use of decision support. The goal of this research is to support barge planners at CTT to make more efficient plans and guide real-time decisions.
Section 1.1 describes the problem we tackle in this study. Next, Sections 1.2 and 1.3 give the motivation and the scope of the research, followed by the research objective and questions (Section 1.4).
1.1
Problem description
A barge planner at CTT makes different decisions at different moments in the planning process of a barge. These decisions are based on data, experience, common sense, and intuition. The number of bookings for transportation services keeps growing at CTT. This positive development results in a growing number of information to process by CTT’s barge planners. Besides the large amount of data they also need to deal with unreliable and missing information. A lack of overview leads to inefficient decisions.
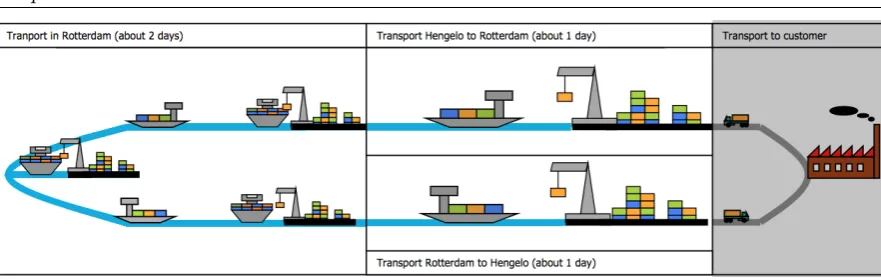
Currently, the roundtrip time of a barge, transporting containers to and from Rotterdam, is about four days. The trip can be divided into three parts. The first part is loading at CTT and sailing to Rotterdam. The second part is visiting different terminals in Rotterdam, unloading and loading containers. The third part is returning from Rotterdam and unloading at CTT.
Figure 1.2: Schematic overview of the distribution of the current tour time of a barge
is about 130 km. With a average sailing speed of 10 km/h it would mean that every efficient tour takes at most 13 hours of sailing time in Rotterdam. So the total duration of an efficient trip, thus without waiting time and delay, in the Port of Rotterdam would not take longer than 19 hours. This is less than half of what it takes currently. CTT expects that by supporting barge planners in the planning process, more efficient transportation plans can be made, which thus results in lower sailing and waiting time, which increases revenues and decreases costs.
A plan of a barge tour can be divided into subproblems with several preconditions that must be met. We briefly describe these subproblems with their preconditions to give an impression of when in the process which decision must be made. Furthermore, it shows the complexity of the planning problems a barge planner has to deal with. The following sections present the subproblems in a particular order, but it is important to realize that the problems are strongly related and partly depend on each other.
1.1.1 Container information
Before containers and their content are allowed to be shipped by CTT, CTT requires certain information and several forms. CTT needs to know where to pick-up certain containers and where to deliver them. Permission forms are required because containers belong to shipping companies and the content belongs to CTT’s customers and not to CTT itself. Furthermore, containers must be checked on valid customer forms and seals. This is a large amount of data, which is almost never complete when the container is booked. Missing information becomes available gradually, but the planners need to watch closely that all required information and forms are available at the moment of pick-up. Appendix H gives a list of all required information. With the changing information and its availability, it is desirable to make a plan as late as possible, because then the most up-to-date information is available. This means that many real-time decisions are made without having the time to gain the total overview of the situation.
1.1.2 Composition of cargo for one tour
as well as export containers and turn-in dates of empty import containers. Simultaneously, the planner tries to minimize the traveling time of a barge. This can be done by minimizing the number of terminals and visiting terminals in a smart way. There are about 30 terminals that CTT visits regularly (Appendix I provides a complete list of all terminals). Most of them are located at the port of Rotterdam. There are roughly two locations with terminals in the port of Rotterdam, called Rotterdam City and Maasvlakte. Figure 1.3 shows a rough overview of the locations of terminals. Currently, containers are planned as soon as they enter the system. By speeding up the planning process, a plan can be made at a later moment, which makes it more reliable.
Figure 1.3: Schematic overview of terminals visited by CTT
When making a composition of containers for one barge, the barge planner has to take into account both export and import containers. Export containers are located in Hengelo and need to be in Rotterdam at a certain terminal at a certain time. Import containers arrive at terminals in the Port of Rotterdam. They have a pick-up date and need to be at the costumer before a certain time, and after that they need to be delivered at the corresponding terminal in Rotterdam within a certain number of days after pick-up. In the ideal situation, the barge visits a number of terminals where it both picks-up and delivers containers. CTT hires four barges to do container transportation, which are in service of CTT 24/7. So, some flexibility is available to assign containers to trips.
When the barge planner has a global overview of the composition of the cargo on a barge, he will contact the operators of the terminals that the barge needs to visit to make appointments. From that moment, he also has to bear in mind the preconditions such as those mentioned before.
1.1.3 Synchronization of transportation
also more expensive, when comparing the price per container of a full truck and barge load. The planner can also choose to let trucks or a train do parts of the trip a container needs to make, e.g., when a batch of containers needs to be picked-up at one of the terminals at Maasvlakte, it can be transported to CTT-R by train. That could save a barge a trip to the Maasvlakte.
CTT wants to implement the concept of synchromodal transportation. CTT defines synchro-modal transportation as follows:
“Synchromodality is the optimal, flexible, and sustainable usage of different transport modalities in a network under direction of a logistic service provider, such that the customer is offered an integrated solution for its transportation.”
A more extensive definition is given by Tavasszy et al. [2010] in a TNO report:
“The core of the concept is that synchromodality is to coordinate within and between the three layers that form the transportation system, namely shippers, carriers/terminals, and infrastruc-ture managers, in such a way that given aggregated transportation demand at any time the right modalities are used, in such a way that:
1. the shipper is offered a transportation means that suits his competitive strategy.
2. a business economical exploitation is possible for the carrier (or terminal).
3. use of infrastructure and available space is maximized.
4. chain performance is optimized in terms of sustainability.”
The most important aspects of synchromodal transportation for CTT is the flexibility of us-ing different means of transportation in a network to make transportation more efficient and sustainable. To do so, they want to change the perspective from a point centric view to a net-centric view, which means that information on the whole or large parts of the transportation chain are taken into account when making decisions.
To increase flexibility, CTT purchased a terminal in Rotterdam (CTT-R) recently. This was acquired to take advantage of the growth of the Port of Rotterdam. CTT opened this terminal on January 1, 2013. Since then, it serves as an intermediate terminal between the sea terminals in Rotterdam and the transshipment terminal in Hengelo. The introduction of the terminal not only opens up new opportunities, but also makes planning more complex.
1.1.4 Stowage
Until the moment of loading, the container composition may change several times, sometimes even during loading. The captain makes the stowage plan for his barge. He decides which container gets which position on the barge. He needs to take into account that the barge needs to be in balance that the containers are stacked to a maximum height, and that the barge has a maximum draught it may reach. Furthermore, to minimize loading and unloading time, containers should be stacked in such a way that no repositioning of containers is needed when loading or unloading a batch of containers.
1.1.5 Uncertainties in plan execution
When the barge is loaded, it immediately leaves Hengelo to sail to Rotterdam. As mentioned before, it takes about a day to reach the Port of Rotterdam. During this day, several factors influence the global plan made. Frequently, terminal operators in Rotterdam change appoint-ments with and without communicating it to planners and captains, because sea vessels are late or they find other customers more important. A barge operator has hardly any influence on the decisions a terminal operator makes. The only thing they can do is to advise their customers to book at transshipment agents that do not collaborate with certain terminals. In the situation that an appointment is cancelled or moved, the captain is the first to try to make a new plan. He is the one that is on location and is able to see which terminals have available berths. He contacts the terminal operators to make new appointments and communicates this with the barge planners at CTT.
Another factor that influences sailing times is the weather. Wind and precipitation can de-and increase the shipping time. Furthermore, the barge passes several locks de-and bridges, where waiting time can arise. When barges are delayed, customers and terminals in question are informed about the delay as late as possible for two reasons. First, because more certain information can be given at a later time. Second, it can happen that terminals move their appointment for certain reasons, in that case no rearrangements are needed.
1.2
Research motivation
To anticipate the growing amount of information, CTT wants to increase the efficiency of their transportation streams by optimizing the deployment of their own and hired means. To do so, they want to change their point-centric view to a net-centric view. This means that they want to make decisions based on information from the whole or large parts of the transportation chain. This makes decision making based on experience, common sense, and intuition even harder.
A good plan is essential for CTT, because it decreases waiting times and thus shortens lead times. Shorter lead times mean that barges can sail more often, which result in a higher shipping capacity, which leads to increased revenue. Furthermore, when transportation time by barge decreases, more containers can be transported by barge instead of truck. This second effect results in lower transportation costs per container.
1.3
Scope of research
by truck is beyond the scope of this research.
[image:17.595.158.440.210.365.2]Transportation by barge is the preferable modality in this study, because it is less expensive, emits less CO2 than transportation by truck, and is more reliable in a number of aspects. Also transportation by train emits less CO2 than truck, but the connection from CTT to the nearby train terminal is not easily accessible yet. These are the reasons why we focus on transportation with barge in this study. Figure 1.4 shows the differences in CO2 emission for different modalities.
Figure 1.4: CO2 emissions per ton-kilometer in 2010, adapted from den Boer et al. [2009]
Other modalities will only be taken into account, when barge transportation is not feasible. As described in Section 1.1, the planning of a round trip includes different optimization decisions. We focus on the real time planning of the composition of containers on the barges that enter that day. We expect to gain the largest increase in efficiency here.
1.4
Research objective, questions, and approach
As described in Section 1.1, there are a considerable number of aspects that planners must oversee. This makes it hard to meet the conditions to make a good barge plan. The goal of this research is to help barge planners to make more efficient plans and better real-time decisions. From this, we formulate the research objective:
Design a method to support CTT’s barge planners to improve the quality of CTT’s transportation flows.
From this problem, four main research questions follow. We divide each question into sub research questions and assign it to a chapter. This division gives us the following overview of this research:
Chapter 2: What is the current situation at CTT?
2.1 What are the expectations for future development of the container sector?
(a) What services does CTT provide? (b) What are CTT’s networks?
2.3 What is CTT’s current planning procedure?
(a) What is the current decision making process? (b) Which factors influence plans and decisions? (c) What are current problems at planning process?
We answer these questions by the information received from CTT via documentation, observation, and interviews.
Chapter 3: What is said in academic literature about barge loading, planning and scheduling, and transportation quality?
3.1 What is known about barge loading, planning and scheduling?
3.2 What is considered as good container transportation quality?
We answer these questions by performing a literature study.
Chapter 4: What is suitable decision support for CTT’s barge planners? 4.1 Which output should the solution provide?
4.2 Which requirements should the solution meet?
4.3 Which approach should be used to come to the required output?
Based on the knowledge gained from literature and CTT’s current insight, we will design a suitable method for CTT.
Chapter 5: Which performance can be expected when implementing the so-lution method?
5.1 How can we test whether the developed method increases transportation quality?
(a) How do we test the performance of the method?
(b) Which key performance indicators do we use to test the performance? (c) How do we define successful improvement of performance?
5.2 What are the advantages and disadvantages of the solution method?
Chapter 2
Context analysis
This chapter describes the current situation at Combi Terminal Twente. We start with an introduction to the container transportation sector in Section 2.1. The section describes the current situation and development of the sector. In Section 2.2 we give an introduction to CTT, a description of the services CTT provides, and the networks in which CTT participates. Section 2.3 describes how the planning and booking process is managed now and the system CTT uses. The chapter ends with a conclusion on the context analysis (Section 2.4).
2.1
Container sector
[image:19.595.187.411.557.700.2]The worldwide volume of transported goods in containers keeps on growing. Figure 2.1 shows the growth in the past and gives an expectation of growth in the future [ESCAP, 2007]. The volumes shown in the figure are full origin-destination containers only, so empty containers are not included and each container is counted once on a roundtrip. United Nation’s ESCAP [2007] expects the total number of containers shipped internationally to grow to 177.6 million TEU (twenty-foot equivalent unit) by 2015. This is based on the numbers from 1980 tot 2002, where the growth factor was 8.5% per annum.
Figure 2.1: Past and forecast global TEU’s (1980-2015). Adapted from ESCAP [2007]
container throughput in the Port of Rotterdam grew from 100.3 million (gross weight x metric tons) in 2009 to 112.3 millions in 2010 to 123.6 millions in 2011 [Port of Rotterdam, 2011a].
To anticipate the expected growth, the Port of Rotterdam invested in broadening of the Ama-zone port and the development of Maasvlakte 2. These investments enable double port capac-ity. The growth of transshipment leads to higher stress on the hinterland connections. The transportation to the hinterland is in 2012 mainly done by road (46.9%) which is compared to waterway and rails extra burdening for the environment and burdens the traffic flow on the road network. To counter the increase inCO2-emission and relief the road network, the Port of Rot-terdam wants to make a shift in modality for its transportation to the hinterland. This means a shift in container transportation from road transportation to less polluting transportation means, such as rail and water [Port of Rotterdam, 2012].
These developments also play a major role in Port of Rotterdam’s vision for 2030. The Port of Rotterdam wants to grow into a “leading European junction for mondial freight flows. The European global hub for containers, fuel and energy flows.” Furthermore, they want to build up
“an integrated network with the hinterland” and become“leader in the field of sustainable and efficient chains” [Port of Rotterdam, 2011b].
Based on forecasts of ESCAP and visions Port of Rotterdam, we expect that future developments will influence the inland navigation in a positive way. Demand for inland navigation will continue to increase, because of the growth of container transportation and because of the shift to less polluting transportation means.
2.2
Combi Terminal Twente
Combi Terminal Twente is an inland terminal located in Hengelo. Its main activity is to trans-port containers from the Port of Rotterdam to customers and vice versa. The transtrans-portation from the Port of Rottedam to CTT is mainly done by inland barges. Sometimes, trucks and trains are used to transport containers along the route or parts of it. CTT is also able to transport containers from and to Amsterdam and Antwerpen. From CTT, containers continue to the customer by truck. Customers vary from local farmers that receive a container once a year to large international companies that receive multiple containers on a daily basis. The transportation from and to the customer is provided in collaboration with Bolk Transport BV. Bolk is CTT’s permanent partner and provide the largest part of the trucks that drive for CTT.
CTT expands its activities to more than the normal activities of a transshipment terminal. On January 1st, 2013, CTT opened a new terminal in the Port of Rotterdam (CTT-R). This terminal serves as an intermediate terminal between the sea terminals and the transshipment terminal in Hengelo. It opens up new opportunities for CTT. The three main reasons for the acquisition of CTT-R are:
- The realization of Maasvlakte 2 means an increase in transportation, especially container transportation, which results in an increased need for depots and transshipment terminals. - CTT-R can serve three transportation modalities: transportation by water, road, and rail.
This makes it possible to switch between modalities at one trip.
Furthermore, CTT invested to build a public warehouse next to the terminal in Hengelo. A public warehouse is a business that provides short or long-term storage to companies that need extra storage.
2.2.1 CTT in numbers
[image:21.595.180.419.318.463.2]The number of TEUs transported by CTT is growing. Figure 2.2 shows that in the past five years a growth of almost 100,000 TEUs has been realized. These are incoming and outgoing containers transported by barge or truck. In the last year, the growth comes from TEUs transported by truck, while the transportation by barge even decreases. This is because of the broken lock in Eefde in the beginning of 2012. This resulted in that no barge transportation was possible for more than a month. After that, the trust in the inland navigation transportation had to be rebuild.
Figure 2.2: Number of incoming and outgoing TEUs at CTT
CTT transports different types of containers. The main distinction is made in the lengths of a containers. Figure 2.3 shows the distribution of the different length of container that are transported by CTT. More than half of all containers have a length of 20 foot (one TEU) and 39% have a length of 40 foot (two TEU). Only 6% are 45 foot containers, which correspond with 2.25 TEU per container.
Figure 2.3: Distribution of incoming and outgoing TEUs from January 2012 to May 2013
[image:21.595.250.347.594.701.2]Bookings
Table 2.1 shows the number of bookings made in 2012. A difference is made between bookings that consist of one container, bookings that consist of 2 to 10 containers, bookings that consist of 11 to 99 containers, and bookings that consist of more than 99 containers. The first column signifies which group of bookings is dealt with. In the second column we see the number of booking in a certain group and the third column gives the corresponding percentage. The fourth column shows how many containers belongs to the corresponding group and the fifths column give the corresponding percentages. The last column shows the average number of containers in a booking of a certain group.
Containers number of % of all total % of all avg. containers per booking bookings bookings containers containers per booking
1 4600 51.69 4600 15.19 1.00
2 to 10 3762 42.27 14183 46.85 3.77
10 to 99 534 6.00 11176 36.92 20.93
100 or more 3 0.03 315 1.00 105.00
Total 8899 100 30274 100 3.4
Table 2.1: Distribution of containers among bookings
We see that more than half of all bookings consists of only one container, while these are only 15% of all containers. On the other hand 6% of all bookings, are booking that are composed of 2 tot 10 containers, which are almost 47% of all containers.
[image:22.595.194.404.558.662.2]Voyages
Table 2.2 shows the number of planned incoming and outgoing voyages. The data are based on the planning date. This means that the date when the voyages was executed may differ from the planned date. However, they are all executed. The table shows the number of days with 1, 2, 3, or 4 voyages in 2012.
Voyages
per day Incoming (%) Outgoing (%)
1 245 (73) 239 (73)
2 83 (25) 83 (25)
3 7 (2) 7 (2)
4 1 (>0.5) 1 (>0.5)
Total 336(100) 330 (100)
Table 2.2: Distribution of number of voyages per day
in 2012. Due to the broken lock in January 2012, there has been almost no transportation by barge for more than a month.
Missing data
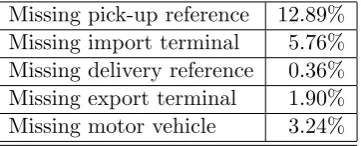
A problem that barge planners and workers from customer service encounter each day, is missing and incorrect data. It is hard to check whether entered data are correct, but it is possible to check absent data. Table 2.3 shows the results from a study on data from seven days, where we distinguish between five types of missing data.
[image:23.595.209.390.241.314.2]Missing pick-up reference 12.89% Missing import terminal 5.76% Missing delivery reference 0.36% Missing export terminal 1.90% Missing motor vehicle 3.24%
Table 2.3: Percentage of missing relevant data for planning
[image:23.595.142.455.507.700.2]For each day, we studied bookings, for which hold that the closing or pick-up date lays within a week ahead. It is striking that almost 13% of relevant import bookings miss their pick-up reference. This is not crucial for the planning but it must be available to the shipper when picking-up the container. More concerning is the fact that the import terminal is unknown for more than 5% of all containers that must be picked-up within a week. This means that these containers cannot be planned at all. Figure 2.4 shows the percentage of bookings that miss data categorized per number of days remaining to handle on time. The horizontal axis presents the number of days remaining to deal with a booking with missing data and the vertical axis the percentage of bookings with missing data. Thus, we see that approximately 1% of all export bookings that must be dealt with within a day, have incomplete information.
Figure 2.4: Distribution of missing data
the different types of bookings. Some bookings are made weeks ahead while others only a few days. This explains why there is still a lot of unknown information only few days before the pick-up or delivery date of a container.
CTT’s competition
[image:24.595.170.425.313.422.2]InlandLinks is an organization that examines every year participating inland terminals on five quality criteria. These five criteria are: ‘accessibility and connectivity’, ‘services’, ‘safety and security’, ‘customs’, and ‘ICT’. From all European inland terminals, rated by InlandLinks and located within a radius of 250 kilometers of CTT, CTT is on the shared first place with a score of 92%. InlandLink collects data from inland terminals and presents them on its webpage to give shippers and transport providers information on intermodal services and options. Figure 2.5 shows CTT’s scoring on these categories. The lacks in ‘accessibility and connectivity’ are caused by the lack of the rail modality in Hengelo.
Figure 2.5: CTT’s rating by InlandLinks [InlandLinks.eu]
2.2.2 Services offered by CTT
As mentioned before, CTT’s main activity is to transport containers from and to Rotterdam. The different types of transportation of a container that CTT offers its customers are divided into three categories.
- Round trip
- Single trip
- Depot transportation
Note that ‘a trip’ in this section is different from ‘a trip’ in the remaining chapters. A roundtrip is a trip where a container is shipped from Rotterdam to CTT, from CTT to the customer, from the customer back to CTT, and then back to Rotterdam. Figure 2.6 shows an import round trip.
Figure 2.6: Example of an import roundtrip
Figure 2.7: Example of a single trip
[image:25.595.206.397.465.507.2]In a depot transportation, a container is just transported from Rotterdam to CTT or vice versa. Figure 2.8 shows an example of a depot transportation. This means that the container is transported from Rotterdam to CTT, where no further actions are taken. This happens in situations where customers pick-up their containers themselves.
Figure 2.8: Example of a depot transportation
Besides transportation, CTT offers some other services related to the container transportation:
- Storage of containers
- Repair of containers and trucks
- Sale and lease of containers
- Gas measurement of import containers
- Care taking of customs forms for import and export containers
2.2.3 Networks
Port of Twente
Port of Twente (PoT) is a collaboration between entrepreneurs, government, and research and education authorities that are concerned with the wellbeing of the Twente Region. This asso-ciation has the goal to strengthen the Twente region by investing in logistics, which promotes employment at different educational levels. To reach this goal, Twente has to turn itself into a logistic hotspot [Regio Twente, 2012]. Twente already has some important ingredients for this development:
- Twente has several large inland ports including the largest in the Netherlands (CTT). - Twente has the most modern Dutch water-related container terminal (CTT).
- Twente has a direct waterway connection with the Port of Rotterdam. - Twente has enough space for new logistic businesses.
CTT is one of the main initiators of this collaboration.
Vereniging van Nederlandse Inland Terminal Operators (VITO)
VITO is an association for transshipment terminals in the Netherlands that are accessible by train or by barge. CTT and the other members of VITO have the common goal to increase the quality of their services, promote collaboration between members, and give meaning to a sustainable mobility policy in a commercial way. This is done by sharing knowledge and experiences between members, running a national network of inland terminals, and developing additional services to improve the transportation chain [VITO, 2013].
Nextlogic
Nextlogic is a collaboration of different parties that aim to tackle the inefficient handling of inland container shipping in the Port of Rotterdam. Together, the parties involved in the logistic chain have developed a solution that will benefit barge operators, inland terminals, deep sea terminals, and depots and shipping companies [Nextlogic, 2013]. The aims are reliable and thus predictable turnaround times, better use of the quays, cranes and barges and fewer (small) calls in the sea port [Nextlogic, 2013]. CTT has interest in these developments, because it includes several advantages for the company and is therefore part of one of the subgroups that works on one of the subjects.
2.3
Process flow
We explain each step of an order through the system. The first step is the creation of a booking in CTT’s system. Based on the booking, a plan is made. In the planning process first a barge plan is created, after that, if necessary, a truck plan at the sea port is made, and after that a truck plan at CTT. After the planning comes the execution of the plan, followed by billing of the services. In this section, we give a more extensive description of the booking and barge planning process.
Figure 2.9: A bookings flow through CTT
2.3.1 Booking
The transportation of a container starts with a booking. This booking can enter CTT in several ways. Mainly, bookings are done by email or telephone, but also the fax is still used and sometimes customers even visit CTT to do their booking. Members of customer service take up all bookings and register them in a database called Modality. This database system is widely used by different companies in the container logistic sector. At CTT, all planners and members of customer service work with it.
result is that one booking number can represent several containers. The other way around, a container number does not imply a booking because containers are reused. This makes it difficult to track individual tours of containers.
Most bookings are not complete when they are registered, because at the time of the booking not all necessary information is available. The minimum information needed to book an order is:
- customer
- shipping company - container number
- container type
- pick-up reference (PIN-number) - pick-up and delivery location
- pick-up date and time
When the container is shipped, more information is needed:
- customs forms
- permission forms to handle the container - seal number
- closing time - detention time - demurrage time
The members of customer service report to the customer which information is missing. Some-times customers prefer a modality for the transportation of their containers. That depends on the reliability, transportation time, and costs of the modality.
The customer service department keeps all contacts with the customer. It does the bookings, makes agreements on price, and sends invoices.
2.3.2 Barge planning
As mentioned before, planners work with Modality. This database system contains all important information of a container. All information entered by customer service can be seen by the planners.
Figure 2.10 gives an overview of the barge planning process at CTT. The oval part signify a start or stop event, the diamond denotes a decision, and the quadrangles are actions.
Appendix C gives a more detailed flowchart of the barge planning process.
outgoing trip. Initially, outgoing trips are put together based on the closing time of export containers. Future trips are mostly overbooked at the moment the corresponding barge enters CTT. When the barge enters CTT the number of container is decreased to a feasible number. First, all containers with missing information are moved. When, after that, the load still exceeds the barges capacity, containers are moved that have a late closing date. next, an estimation of the leaving time at CTT is made. Based on that, an estimation of the production time in Rotterdam is made. The actual composition is made based on the following characteristics:
- Dimensions of the container - Destination terminal
- Closing time
- Completeness of information - Contents of containers
When a container lacks information, the planner asks customer service to contact the customer to get the information needed. Some information can also be found on websites from the shipping companies, but it is preferable that planners do not have to search for information. The containers that are removed from a trip are booked on a later trip with another barge.
Three hours before the barge enters Rotterdam, the plan for import containers is made. This composition of import containers is based on the same characteristics as the export containers, but now the planner also has to take export containers into account. A preferable tour through the Port of Rotterdam is either loading roughly as many containers as unloading at a certain terminal or first visiting the unloading terminals and after that the loading terminals. These choices made by planners are based on intuition and common sense, but are not included in the planning procedure described by CTT (Figure 2.10).
When making the plan, the planners main goal is to let containers arrive in time. When this is satisfied, they try to use the capacity of the barge as good as possible and after that they try to plan in such a way that they provide the shipper with a nice route. This means that a shipper does not need to visit the same terminal twice and visit all terminals next to each other in one go, such that he does not need to ship up and down between places.
The most difficult part for the planner is to keep an overview of all factors that influence a plan. To manage the planning of hundreds of containers, the planners work with lists. Containers are categorized based on delivery/pick-up date or destination. This has the advantage that hundreds of units with information are reduced to dozens of units with information. The disadvantage is that a part of the overview gets lost. That can result in situations where the planner cannot locate the bottleneck in a plan and thus does not know how to fix it. If a planner is not able to make a plan feasible with respect to meeting closing and pick-up dates, the most common action is to call the customer and ask to move the corresponding closing or pick-up date. If the customer does not agree with that, the container is transported by truck and CTT has to pay for additional costs. If the barge cannot be filled or the shipper has to visit the same terminal twice to make a plan feasible, no actions are taken to change that. Examples of available means that a planner can use to make a plan feasible or better are:
- Repositioning in CTT-R
- Transporting with other means from CTT-R - Delivering to other terminal
2.4
Conclusions
Based on the sketched situation in the container sector and the planning situation at CTT, we conclude that there are several reasons to support barge planners in the planning process. First, because the sector is growing, especially for inland navigation. Second, the amount of data and information that planners need to manage is already extensive. This will only become worse when the demand for container transport grows.
Literature overview
A good start to tackle a problem is to investigate existing knowledge in the field. To do so, we describe relevant literature in this chapter. It consists of three parts. The first part describe literature that discuss container logistics with focus on container loading, planning and scheduling. In this first part we start with a brief overview of planning and scheduling techniques (Section 3.1) followed by a section on ship routing and scheduling (Section 3.2). Section 3.3 focusses on container loading problems that largely can be translated to barge loading problems and Section 3.4 gives an overview of terminal operations in general discussed in literature. The second part of this literature overview (Section 3.5) focusses on the definition of transportation quality. This is discussed to be able to judge whether or not this study contributes to increase in transportation quality. The third and last part (Section 3.6) describes a way of structuring programming, which we use to structure our solution method.
3.1
Planning and Scheduling
This section gives an overview of methods to make plans and schedules. The goal is to position the method used in this study in existing methods from literature. Planning and scheduling is a topic extensively discussed several fields, such as health care and production. The methods can be divided into nine categories.
- Mathematical Programming
- Constructive Heuristics
- Meta-heuristics
- Simulations
- Constraint programming
- Queuing
- Artificial Intelligence
- Hybrid-methods
The full list of all methods, which is composed based on the findings of Cardoen et al. [2010] and Van den Bergh et al. [2013], can be found in Appendix E.
The priority method that we use in this study is a combination of Constructive Heuristics and Decision Rules, which is positioned under Other. Constructive Heuristics start with an empty solution, which is extended repeatedly to a complete solution. If necessary the solution can be improved after constructing it.
From the overview provided in Section 3.1 and Appendix E we conclude that no type of planning method, as used in this study, is found in literature.
3.2
Ship routing and scheduling
This part of the literature overview presents several models that make relevant contributions to ship routing and scheduling. Furthermore, this section discusses some heuristics to solve routing and scheduling problems. We review this literature to give an overview of problems related to barge loading and planning problems. The backbone of this part of the literature review about ship routing and scheduling is the review paper of Christiansen et al. [2012]. They review ship routing and scheduling and related problems published between 1999 and 2012. All literature discussed in this section is also discussed in Christiansen et al. [2012].
The review executed by Christiansen et al. [2012] is divided into four parts:
- Liner shipping
- Industrial and tramp shipping
- Sailing speed, bunkering and emissions - Offshore logistics, lightering and stowage
The part about ‘Industrial and tramp shipping’ is interesting for this research, because it presents a basic model for ship routing and scheduling and several extensions for this or similar models. ‘Liner shipping’ is beyond our scope, because it is comparable to public bus services that have a fixed route and a fixed schedule according to which they operate [Christiansen et al., 2012]. This is not applicable to CTT because the route is not fixed but depends on available containers. Furthermore, the paper discusses several papers that discuss heuristics to solve the basic problem and extended problems. From the review, it follows that user experience and interaction of planning and decision supporting tools play a major role. We pay attention to this topic too.
First, we introduce the basic model and some extensions in Section 3.2.1. Next, Section 3.2.1 introduces several heuristics and their performance. Finally, we deal with user experience and interaction in Section 3.2.2.
3.2.1 Ship routing and scheduling methods
deals with heuristics that are developed to find solutions for different models.
Basic model The basic cargo routing model discussed by Christiansen et al. [2012] is in-troduced by Christiansen and Ronen [2007]. Specified cargoes are the input for the planning process. Routing becomes a scheduling problem when the time-aspect is taken into account. This model is a routing and scheduling model for tramp shipping, which is a more advanced version of the industrial shipping problem.
Christiansen and Ronen [2007] formulate a model to maximize profit gained by operating a fleet. The model includes different types of loading (mandatory and spot cargo), vessel capacity, and time windows. A considerable amount of problems faced in reality are not included in this model. One important extension is the variability in cargo size. The paragraph below discusses this extension.
Extensions When considering variable cargo, a routing and scheduling problem also includes optimizing the size of cargo. This problem is studied by Brønmo et al. [2006] and Korsvik and Fagerholt [2008]. Brønmo et al. [2006] present a mathematical programming model and a set partitioning approach with a priori column generation to tackle the tramp problem extended with flexible cargo sizes. Brønmo et al. [2006] states that the results of the study show that it has an positive economical effect to use flexible cargo sizes.
In order to be able to save computation time and solve larger problems, Korsvik and Fagerholt [2008] develop a tabu search algorithm with an embedded specialized heuristic for determining optimal cargo quantities in each route. Korsvik and Fagerholt [2008] state that the heuristic is able to give optimal and near-optimal solutions to real-life cases within reasonable time. Furthermore, they also found that using flexible cargoes increases the quality of solutions.
Brø nmo et al. [2010] extend their previous approach with a static column generation to an approach with dynamic column generation in which ship routes are generated when needed. In this approach no optimal solutions are guaranteed, but more extensive problems can be solved faster than in the static column generation case. Real world cases are solved optimal or near-optimal.
Heuristics Different heuristics can be used to find solutions to the problems mentioned above. As mentioned before, Brø nmo et al. [2010] use column generation to solve the mathematical programming model. Earlier, Brø nmo et al. [2007] used a multi-start local search, but this was outperformed by the tabu search heuristics by Korsvik and Fagerholt [2008] and Korsvik et al. [2009]. Malliappi et al. [2011] present a variable neighborhood search metaheuristic for this problem. Compared to the multi-start and tabu search heuristics, this heuristic gives better solutions with respect to the quality of the solutions and the computation time.
3.2.2 Decision support
necessary for the analysis, and an interface for communication with the user [Perimenis et al., 2011]. A DST aims to analyze the problem, evaluate the performance of alternatives based on criteria, and express the priorities of the decision makers [Shim et al., 2002]. When Fagerholt et al. [2009] implemented and tested a DST at a shipping company, they experienced that there are constraints and secondary objectives that are hard to model in a proper way. From this experience and from discussion with the planners, they conclude that it is desirable for a DST to provide several high quality solutions that planners can analyze and choose from.
3.2.3 Conclusions on ship routing and scheduling
We see that barge planning and loading only plays a minor role in the literature discussed in this section, while in practice it is an important part of ship routing and scheduling problems. Loading, planning and routing are problems dependent on each other, which makes it too complex to analyze them in total and thus are split into subproblems.
From the part on decision support, we learn that it is desirable to provide planners with a number of solutions from which they can choose and adjust to plans they want to execute.
3.3
Constraints on loading problems
An extensively discussed topic in the literature is the container loading problem. This problem is easily translated into other problems such as loading a truck, a pallet, or a barge. Bortfeldt and W¨ascher [2013] define a container loading problem formally as a three-dimensional geometric assignment problem. In these types of problems, three-dimensional items are assigned to a bigger cube such that a given objective function is optimized and two basic geometric feasibility conditions hold:
- all small items lie entirely within the bigger cube - the small items do not overlap
In our situation, we interpret the bigger cube as a barge, because a barge also is limited in three dimensions. We see small items as container that must be loaded in barges. In this literature review, we use the term ‘cargo’ for the small items and for the bigger cube the term ‘container’, because that is terminology mainly used in literature.
Bortfeldt and W¨ascher [2013] did a recent literature review on this topic. The review goes from 1980 to the end of 2011 and makes a difference between problems where the number of containers to load all cargo is minimized and problems where the amount of cargo loaded in a fixed number of containers is maximized. We focus on the second type of problem, because in this study the number of barges is limited. Within this problem type, Bortfeldt and W¨ascher [2013] distinguish between seven problems. The problems relevant for this study are:
- Multiple Identical Large Object Placement Problem (MILOPP): Loading a set of identical containers with a selection from a weakly heterogeneous set of cargo such that the value of the loaded items is maximized.
In our study, we deal with barges that are almost identical. That is why it can be translated into problems with one or multiple identical barges (containers in terms of container loading problems). The containers (small items in terms of container loading problems) we load, are considered to be weakly heterogeneous, because they can be grouped into few classes, where each container type is available in relatively large quantities.
Within these problems, literature focusses on different constraints related to container items and cargo. The difference between item- and cargo-constraints is that item-constraints are related to single items and cargo-constraints to groups of items. Bortfeldt and W¨ascher [2013] divide the constraints into ten categories. We only discuss eight out of the ten because these are relevant for our study. For the complete list we refer to Bortfeldt and W¨ascher [2013].
3.3.1 Container-related constraints
This section discusses constraints related to the container. A container is, among others, re-stricted by carrying weight and stability. In the context of our study these can be translated to constraints that are imposed by the characteristics of a barge.
Weight limits The load of a container must not exceed a certain weight. This may have different reasons such as the capacity of a container or the carrying capacity of handling means. Bortfeldt and W¨ascher [2013] state that weight limits can be modeled as linear Knapsack con-straints, where the sum of the weights of the loaded items must be smaller than or equal to the weight capacity of the container. For literature discussing this topic we refer to Bortfeldt and W¨ascher [2013].
Weight distribution Weight distribution constraints require that the weight of the cargo is spread evenly across the container floor. This is useful because balanced loads reduce the risk that the cargo shifts when moved, reduce the wear of axles in truck transportation, and makes it easier to handle containers [Bortfeldt and W¨ascher, 2013].
3.3.2 Item-related constraints
This section discusses the constraints related to items. The positioning or orientation of an item can be limited. In the context of our study this type of constraints can be translated to constraints related to containers.
Loading priorities constraints This constraint type is a typical constraint that belongs to maximization type problems, which means that there are a limited set of containers and the number of items loaded must be maximized. Available container space is insufficient to load all small items, so a decision must be made which items to load and which to leave behind. In prac-tice, the loading of some items may be more desirable than the loading of others, which results in priorities [Bortfeldt and W¨ascher, 2013]. Loading priorities can be translated into multiple hard and soft constraints. Even though loading priorities are characterized as important constraints, by e.g., Junqueira et al. [2012], Bortfeldt and W¨ascher [2013] only found little literature that discusses this type of constraints. Ren et al. [2011a] and Ren et al. [2011b] introduce algorithms for problems where allocation constraints are combined with priority constraints. Ren et al. [2011b] give big items higher priorities than smaller items, because they are more difficult to load. Bischoff and Ratcliff [1995] mention that the case of relative priorities could be modeled as objective function coefficients which define or adjust the value ratings of the items. However, Bortfeldt and W¨ascher [2013] state that no one introduces a corresponding algorithm.
Orientation constraints This type of constraints are needed when items need to have a specific orientation within the container. For example boxes with one side labeled with “This side up!”. Containers do also have the restriction that they must be positioned with their top side up. Bortfeldt and W¨ascher [2013] distinguish five cases, from these two are interesting for our case:
- One single orientation is permitted for each item (type) in both vertical and horizontal direction.
- One single vertical orientation is permitted for each item (type). No restriction is given to their horizontal direction.
For the division of literature among all five types we refer to Bortfeldt and W¨ascher [2013].
3.3.3 Cargo-related constraints
Constraints discussed in this section can, in the context of our study, be translated into order or booking constraints. Items belonging to one cargo or containers belonging to one order may not be separated in some situations. Furthermore, it can be preferable to have items belonging to one cargo located near to each other.
or as one in a shipment. If this is not possible, the consequence is that total cargo is left behind. Bortfeldt and W¨ascher [2013] states that Eley [2003] is the only one to consider this type of constraints.
Allocation constraints Allocation constraints are divided into two different types of con-straints. First, separation constraints, where cargo that cannot be shipped in the same container, must be separated (e.g., food and perfumery articles). Second, connectivity constraints, where specific cargo needs to be shipped in one container. Bortfeldt and W¨ascher [2013] states that most literature refers to connectivity constraints. These types of problems are often used in pallet-stacking problems where a pallet with just one type of items is more preferable than mixed pallets. Bortfeldt and W¨ascher [2013] find that in area of pallet loading, allocation constraints are often treated as soft constraints. However, allocation constraints discussed in papers that also concern vehicle routing, often consider them as hard constrains. For more literature that discuss these constraints we refer to Bortfeldt and W¨ascher [2013].
Positioning constraints Positioning constraints restrict the location of items within the container, either in absolute terms (i.e., where items are to be located or not to be located within the container) or in relative terms (i.e., where items are to be located or not to be located relative to each other). Position of items within a container are often related to the items size, weight, or content. Haessler and Talbot [1990] describe a problem where handling means have limited access to the container so positioning of some items is restricted. Bortfeldt and Gehring [1999] divide containers into different zones (front, middle, back) and link specific item types to zones in the container.
In relative positioning constraints, Bortfeldt and W¨ascher [2013] found a separation in con-straints that require items to be placed closely to each other (grouping) and concon-straints that separate items from each other. In multi-drop situations, combinations of these two types are made [Bischoff and Ratcliff, 1995]. Items of the same customer should be grouped and the positioning within the container should correspond to the sequence of customer visits.
Bortfeldt and W¨ascher [2013] state that literature addressing combined container loading and vehicle routing problems typically introduce a specific multi-drop condition which aims at fa-cilitating the unloading operations. More literature that discusses position constraints can be found in Bortfeldt and W¨ascher [2013].
3.3.4 Conclusions on constraints for container loading problems
3.4
Container Terminal Operations
The purpose of this part of the literature review is to give an overview of container terminal operations. Voß et al. [2004] provide an overview of literature (1983-2004) discussing the main logistic processes and operations at container terminals. They classify these processes and provide a literature review concerning operation research models and applications in this logistic field. They describe possible means of handling equipment used in container terminals and the different types of container terminals. The subjects discussed in the sections about terminal logistics and optimization methods are:
- Berth allocation - Stowage planning - Crane split
- Storage and stacking logistics
- The quayside transportation optimization - The landside transportation optimization - Crane transportation optimization - Simulation systems
For a detailed description of the subjects and corresponding methods we refer to Voß et al. [2004]. Although, the titles of some subjects may suggest that part of the review discusses barge or truck loading, no attention is paid to this topic. Note that this is a gap in the literature, because barge loading and planning problems do belong to the operations of most container terminals.
3.5
Transportation Quality
In this section, we discuss quality measures of transportation. This is required because we want to be able to analyze transport quality within this study. Literature about freight transportation quality is scarce while literature on passenger services quality, especially on public transporta-tion, is extensive. In this sectransporta-tion, we present one paper on freight transportation quality and a literature review on public transportation quality. We think useful information can also be obtained too from the study on public transportation, because there are many factors that are similar or can be translated into a situation with freight transportation.
3.5.1 Freight transportation quality measures
Zamparini et al. [2011] collected a number of measures to evaluate the quality of freight trans-portation. The goal of their survey was to determine the relative importance, as well as financial values of the freight transportation quality seen from Tanzanian shippers perspectives. Zam-parini et al. [2011] determined the following six attributes to be the most important:
- Frequency is related to the number of shipments offered by a transportation company, or any freight forwarding agent, in a given period of time.
- Flexibility considers the number of unexpected shipments that is dealt with, without excessive delay.
- Loss and damage may refer to the percentage of the commercial value of shipped goods that is lost because of theft, damages, or losses.
- Reliability has been defined in several heterogeneous ways. It has been defined as the absolute variation in transit times, as the relative variation (measured as the coefficient of variation), or as the percentage orders that arrive within scheduled time.
Zamparini et al. [2011] conclude that improvements in travel time, loss and damage, and fre-quency have a higher economic value than the upgrading of flexibility and of reliability.
3.5.2 Public transportation quality measures
Carse [2011] assesses an evaluation tool for the impact of public transportation projects. Part of this research is about the evaluation of the quality measures of transportation. Carse [2011] divides the measurements into five categories: access and availability, environment, sustainable transportation, personal safety and transportation costs. Within these categories the measure-ments are categorized as follows:
- Access and availability
Availability Reliability
Transportation diversity Services access
- Environment
Noise pollution Climate change Air quality
- Sustainable transportation
Sustainable transportation infrastructure investment Walking and cycling quality
- Personal safety
Passenger behaviour
Safety on public transportation
- Transportation costs
Translating these quality measures to freight transportation quality measures we end up with ‘Access and availability’, which can directly be copied and includes ‘Frequency’. ’Sustainable transportation’ where we skip ’Walking and cycling quality’ and include the measurements from ‘Environment’. ’Personal safety’ is translated to ’Cargo safety’, which includes loss and damage of cargo. Finally, we have ‘Costs’ that only consists of the costs for transporting freight. Carse [2011] concludes that an equal distribution between the five categories is a good distribution of the importance between the categories.
3.5.3 Conclusions on transportation quality
The six quality measures for freight transportation discussed in Section 3.5.1 share similarities with the quality measures for public transportation discussed in Section 3.5.2. The conclusions drawn by Zamparini et al. [2011] for Tanzanian freight transportation may not be directly relevant for freight transportation in Europe. We expect that reliability plays a more important role than travel time, because it is easier to plan longer travel times than it is to take into account uncertainties. The complete set of quality measures considered in this study is: ‘Travel Time’, ‘Frequency’, ‘Flexibility’, ‘Costs’, ‘Safety’ and ‘Reliability’.
3.6
Method Architecture
To structure the heuristics and decision rules that together form the solution design, we use an architecture from Computer Science. This is the Pipes and Filters architecture.
Buschmann et al. [2007] describes this architecture for data stream as follows: data flows through pipes and is processed by filters. Each processing or transformation step is integrated in a filter component. The output of one filter is the input of another filter. Translated to our situation, this means that a filter executes a heuristics that processes the data. Filters receive data from other filters or the source via its inbound pipe, process it, and send the transformed data via the outbound pipe to a successive filter. Data producing filters write data to a pipe, data consuming filters receive data from a pipe. Filters can be both producing and consuming. The first filter of a system is called source filter and is responsible for the transformation of external data to fit into the system. The last component of a system is the sink filter that consumes the data.
Pipes are used to pass data between adjacent filters, it connects one filter to the next. Pipes are also able to buffer information, when a filter is not ready to process the information. Data flow only one way. When data need to flow to preceding filters, a pipe will loop back to that filter.
3.7
Conclusions
A considerable amount of studies and literature reviews are available on different topics of container shipping and container terminal operation. However, no direct literature on barge loading and planning is found, while an extensive amount of literature is found on container loading, and planning and scheduling in the health care sector. From these studies, many results can easily be translated into results for barge loading problems.
From the small intermezzo about decision support we learn that the optimal solution according to a heuristic may deviate from the optimal solution for a planner. To satisfy planners, several solutions must be given.
We discussed transportation quality. Although little literature is available on freight trans-portation quality, we can draw some important conclusions. Frequency, travel time, flexibility, costs, safety and reliability of transportation are considered as important. These results are also confirmed by literature concerning public transportation.


![Figure 1.4: CO2 emissions per ton-kilometer in 2010, adapted from den Boer et al. [2009]](https://thumb-us.123doks.com/thumbv2/123dok_us/9902574.491652/17.595.158.440.210.365/figure-co-emissions-ton-kilometer-adapted-den-boer.webp)
![Figure 2.1: Past and forecast global TEU’s (1980-2015). Adapted from ESCAP [2007]](https://thumb-us.123doks.com/thumbv2/123dok_us/9902574.491652/19.595.187.411.557.700/figure-past-forecast-global-teu-adapted-from-escap.webp)


![Figure 2.5: CTT’s rating by InlandLinks [InlandLinks.eu]](https://thumb-us.123doks.com/thumbv2/123dok_us/9902574.491652/24.595.170.425.313.422/figure-ctt-s-rating-by-inlandlinks-inlandlinks-eu.webp)

