Received Jan 29, 2016 / Accepted Aug 21, 2016
Editorial Académica Dragón Azteca (EDITADA.ORG)
Uncertainty Modelling for Project Portfolio Problem using Interval
Analysis
Fausto Balderas
1, Eduardo Fernandez
2, Claudia Gómez
3, Gilberto Rivera
4, Laura
Cruz-Reyes
3, Nelson Rangel V
5.
1
Computer Science in the Graduate Division, National Mexican Institute of
Technology/Tijuana Institute of Technology, 22500, Baja California, Mexico.
[email protected]
2
Faculty of Civil Engineering, Autonomous University of Sinaloa, 80040, Sinaloa, Mexico.
[email protected]
3
Postgraduate & Research Division, National Mexican Institute of Technology/Madero
Institute of Technology, 89440, Tamaulipas, Mexico.
[email protected], [email protected],
[email protected]
4
Institute of Engineering and Technology, Autonomous University of Juarez City, 32310,
Chihuahua, Mexico.
[email protected]
5
Catedrático CONACyT, División de Estudios de Posgrado e Investigación,
Tecnológico Nacional de México, Instituto Tecnológico de Ciudad Madero
[email protected]
Abstract. The problem of selection of project portfolio is often approached by organizations. The decision maker, along with the decision analyst must often provide information about the portfolio values, that most of the time come with uncertainty. An interval number is a set of numbers, which the exact value is not known. In this paper, we apply the interval approach to the problem of the project portfolio, modeling the imprecision in resources available, projects and the total resource, as well as restrictions relevant to the problem. The experiment is performed on two fronts: uncertainty modeling approach with interval analysis and without the interval approach in order to compare results. The results show that modeling the uncertainty and imprecision with interval numbers, were able to overcome results to those found without the application of interval approach.
Key words: project portfolio selection, uncertainty, interval approach.
1.
Introduction
The decision analysis for portfolios (DAP) can be defined as a set of theories, methods and practices that help the actors of the decision-making process select a group options from a very large set of them, using mathematical modeling, and considering relevant restrictions, preferences, uncertainty and imprecision [12]
Let us suppose we have a set A composed of N projects, each one described by estimations of its impacts and resource consumption. A portfolio is a subset of A that can be modeled as a vector of binary components X x x1, 2,...,xn ,where the value 1 of the component
x
i indicates that the i-th project will be financed.21
The use of multi-objective optimization techniques is necessary, which have been addressed by Multi-Objective Evolutionary Algorithms (MOEAs). The MOEAs dealt simultaneously with a set of possible solutions, allowing them to obtain an approximation to the Pareto frontier [2]. One of the algorithms mainly used to solve multi-objective problems is the Non-Dominated Sorting Genetic Algorithm II (NSGA-II, [4]), which has gained much popularity in solving problems efficiently and to a low computational cost.
Interval analysis is a method originated independently by Sunaga in [14] and Moore in [8] and developed ever since the 1950s by a score of mathematicians as an approach to putting bounds on rounding errors in mathematical computations. It represents a numerical quantity as an interval within which the true value of the quantity lies.
This paper intends to contribute in the study of the problem of project selection using mathematical modeling integrated with interval analysis, and considering relevant constraints, uncertainty, and imprecision, to deal with the project cost, and the total of the available resources, six experiments are proposed that model different reaction attitudes that the DM when facing uncertainty.
2.
An overview of different approaches for modeling uncertainty in the project portfolio problem.
Uncertainty is known as the lack of knowledge about what will happen in the future. The term may be used in different situations, but his usage is common in the statistical and economic field, where particular circumstances make it impossible to produce an accurate diagnosis of what will happen. Uncertainty is also applied in the decision-making process. Two kinds of uncertainty can be distinguished:
Firstly, the uncertainty associated with future uncertain states of nature, which cause variability in the benefits of the projects. Secondly, the imprecision associated with the vagueness; the uncertain knowledge of the non-stochastic character.
The probabilistic modeling has been used, mainly to model the variability of project impacts; the majority of the works have presented it introducing additional criteria that try to minimize the risk at a certain extent, in the multi-objective optimization problem. Various papers differ from the way in which this measure is defined [e.g., 1, 5, 7, 9, 10, 13].
When evaluating projects, the amount of resources sufficient to realize the project is not known exactly and the budget is frequently overestimated by the DM [6]. The DM often feels more comfortable expressing the imprecision or qualitative judgments than establishing a probability distribution function or a measure of risk. The probability distributions have been used in project portfolios to model the variability of the impacts of the projects, but these have not been used (at least in the work that we know) for modeling variability in the resources that the project consumes, or in the available resources.
3.
Uncertainty in the portfolio problem
A portfolio is represented as a one-dimensional vectorX x x1, 2,...,xN ; of size 𝑁. To give values to xi we will applied the well-known model for assigning 0-1, where 𝑥 is the indicator variable of the portfolio, if xi 1, represents that the project 𝑖 is supported inside the portfolio, otherwisexi 0.
Let's consider 𝑁 projects that fulfill minimal requirements of acceptability that compete for financing. An important element of the portfolio problems is the interaction between the projects that can be in the sense of the benefits or in the sense of re sources that are consumed, but in this paper, we will consider only independent projects, i.e. we will assume that there is no synergy of benefits or resources.
𝑃𝐺 represents the total amount of available financial resources. 𝐽 is the total number of project objectives. The information about
a project will be in a vector form, Equation (1):
1 , ,..., ,
i J
p c o o (1)
22
Once the projects that are in the portfolio are known, the cost associated with the finance of𝑋is denoted as𝐶𝑙and, under the
premise of non-interaction of resources, it can be calculated using Equation (2) that represents the sum of the costs of all the proposals favored in the𝑋portfolio:
(2)
Under the condition of assumed independence, the integrated contribution of all the projects in the portfolio 𝑋 to the j-th objective, can be calculated by the Equation (3):
(3) The best portfolio is obtained by solving:
(4)
whereRF,is the space of feasible portfolios limited byCl PGand the area and region constraints.
4.
Method of solution for the multi-objective portfolio problem
To work out a solution to the problemenunciated in Section 3, the NSGA-II was implemented, obtaining the Pareto frontier with solutions not dominated among themselves. The final decision to choose which is the best result depends on the DM and the DM-analyst.
4.1The NSGA-II working with interval analysis.
The NSGA-II is considered one of the benchmarks of the multi-objective optimization to solve problems preferably of two or three objectives. It is based on the creation of non-dominated fronts establishing an elitism on the first front in addition includes an indicator of diversity called crowding distance.
Dominance between two interval vectors:Let p and q be two interval vectors we say that p dominates q (denoted byp q
) if pi qi for all i values and there is at least one i such thatpi qi.
A fundamental step of our proposal is to generalize the NSGA-II for the treatment of interval analysis multi-objective optimization problems, and then we propose to adapt the most important strategies to interval analysis (Algorithm 1):
Algorithm 1. 𝒇𝒂𝒔𝒕 − 𝒏𝒐𝒏 − 𝒅𝒐𝒎𝒊𝒏𝒂𝒕𝒆𝒅 − 𝒔𝒐𝒓𝒕(𝑷)
1: for each 𝑝⃗ ∈ 𝑃
2: 𝑆𝑝= ∅
3: 𝑛𝑝= 0
4: for each 𝑞⃗ ∈ 𝑃 𝑝⃗ and 𝑞⃗ are interval vectors
5: if(𝑝⃗ ≺ 𝑞⃗) then if 𝑝⃗ dominates 𝑞⃗
6: 𝑆𝑝= 𝑆𝑝∪ {𝑞⃗} Add 𝑞⃗ to the set of solutions dominated by 𝑝⃗
7: else if (𝑞⃗ ≺ 𝑝⃗) then
8: 𝑛𝑝= 𝑛𝑝+ 1 Increment the domination counter of 𝑝⃗
9: if 𝑛𝑝= 0 then 𝑝⃗ belongs to the first front
10: 𝑟𝑎𝑛𝑘𝑝= 1
11: 𝐹1= 𝐹1∪ {𝑝⃗}
12: 𝑖 = 1 Initialize the front counter
13: while 𝐹𝑖≠ ∅
14: 𝑄 = ∅ Used to store the members of the next front
15: for each 𝑝⃗ ∈ 𝐹𝑖
1
* ; 1, 2,..., . N
l i i
i
C c x i N
1,2,..., N
j i, j i i=1
z =
o *x ; j = J.1 2
(x), (x),..., (x), ,
P
F
Maximizing z z z
23
16: for each 𝑞⃗ ∈ 𝑆𝑝
17: 𝑛𝑞 = 𝑛𝑞− 1
18: if 𝑛𝑞= 0 then 𝑞⃗ belongs to the next front
19: 𝑟𝑎𝑛𝑘𝑞= 𝑖 + 1
20: 𝑄 = 𝑄 ∪ {𝑞⃗}
21:𝑖 = 𝑖 + 1
22:𝐹𝑖= 𝑄
To sort the population of size N according to the level of non-dominance,each solution must be compared with all the solutions in the population to find out if it is dominated (Lines 4 to 10). For the set of solutions of the population 𝑃, on line 5, comparison is performed by vector of objectives corresponding to the solution in turn to determine if 𝑝⃗ dominates 𝑞⃗ (𝑝⃗ and 𝑞⃗ are interval vectors), if so, this solution is included in any structure, to identify which solutions were dominated by 𝑝⃗. Otherwise, i.e. if 𝑞⃗ dominate 𝑝⃗, increments the value of 𝑛𝑝,this variable indicates the number of solutions that 𝑝⃗ did not dominates (Lines 7 and 8).
In the lines 9 to 11 since the evaluation of the solution is known 𝑝⃗ in the previous process, and if there are no solutions that dominate it, the solution 𝑝⃗ will be part of the first front 𝐹0. To find the individuals of the following front, the solutions of the first
front are temporarily discounted and the process is carried out again (Lines 13 to 22). The procedure is repeated to find the other fronts; the worst case would be that there is only one solution in each front.
5.
Computer Experiments
This section presents the necessary experiments to validate the effectiveness of our proposal, for this, we worked with the characterization of uncertainty without using interval analysis and later the interval analysis was included in order to make a quality analysis comparing the results between treatments.
In addition, the necessary experiments are described to validate the quality of the algorithm NSGA-II applying the interval analysis and without applying the interval analysis, we compare the results of the two algorithms. To carry out these experiments are described below the conditions, under which the experiments are performed:
A. Test Environment. The algorithm NSGA-II was implemented in Java Programming Language. In order to compute the results, the program was run in a computer with the following characteristics: Intel Core i7 3.5 GHz CPU, 16 GB of RAM, and Mac OS X Yosemite 10.10.4 as the operating system.
B. The solutions were obtained from 30 independent runs of NSGA-II and NSGA-II applying interval analysis.
C. Algorithm Configuration. In order to set the algorithm NSGA-II, we experiment with the configuration given by Cruz-Reyes et al. in [3]: population size = 100, number of generations = 500, mutation probability = .05 and cross-over probability = 1.
5.1 Description of the case of study
In the project portfolio problem, we have a set 𝐴 of N projects,the DM should describe the contributions of the objectives, which refer to the number of persons benefited by each project; the costs of those projects must also be described. As for the general information of the problem, there is a budget to distribute (𝑃𝐺)that had to be analyzed, evaluated and calculated by the DM
previously. The proposals are classified into three areas (K) by their nature, and by their impact location into two regions (M). The DM requires a certain level of balance in the supported portfolio. Now, in this section the information where the treatment of uncertainty is included shall be described in detail.
A portfolio is a subset of 𝐴 that indicates which projects are contained within. There are 28 projects in area one, 41 to the area two, 31 the area three; the projects are divided equitably into two regions.The available budget is250 thousand dollars.
In Table 1 we can see that for project 1,the DM assumes that it is going to cost $6,125, and the objective 1 will be benefited with a value of 12 555 and the objective 2 in 9 145, this information is the one estimated for the projects.
Table 1. Estimated Information of 1 of the 100 available projects.
Id 𝑐𝑖 Area Region 𝑜𝑖1 𝑜𝑖2
24
The DM has to deal with the uncertainties encountered in the instance, therefore it is considered to treat these imprecisions reflected in intervals,as it can be observed in Table 2, which shows the same project from Table 1, but now reflected with intervals in the estimated values. The problem is not only to provide the estimated information; but the question is how to reflect the uncertainty found. In this work, the uncertainty is modeled in the cost of the projects (column 2), and the benefits of the projects (columns 5 and 6), as intervals. Also, the available budget is presented in the form of interval, calculated using a reduction of 4% (𝑃𝐺𝑚𝑖𝑛= $240 000 dollars) and in the same way it increases 4% (𝑃𝐺𝑚𝑎𝑥= $260 000 dollars).
Table 2. Information about 1 of the 100 available projects reflecting the imprecision in the form of intervals. Id [𝑐𝑖𝑚𝑖𝑛, 𝑐𝑖𝑚𝑎𝑥] Area Region [𝑜𝑖1𝑚𝑖𝑛, 𝑜𝑖1𝑚𝑎𝑥] [𝑜𝑖2𝑚𝑖𝑛, 𝑜𝑖2𝑚𝑎𝑥]
1 [$6 025 , $6 225] 2 1 [12 405 , 12 705] [9 095 , 9 195]
We took the first step to solve this problem without applying the intervals; the purpose of this first stage is to apply certain heuristics to model the effects of uncertainty in the instance data. Afterwards, the second stage was carried out wherewe presented the results of the experiments designed to validate the advantagesof dealing with the uncertainty applying interval analysis.
5.2 Treatment of the uncertainty without the application of the interval analysis.
To work with the treatment of uncertainty it is necessary to model the attitude of the DM before uncertainty. Six experiments are proposed that model different reaction attitudes that the DM when facing risk, where the total availability of resources, and the total cost of the projects varies.
In experiments 1, 2 and 3, the value of 𝑃𝐺 is calculated as
𝑃𝐺𝑚𝑖𝑛 + ( 𝑃𝐺𝑚𝑖𝑛+𝑃𝐺𝑚𝑎𝑥 )2
2
.
Therefore𝑃𝐺= $245, 000 dollars.Experiment 1: Taken to the extreme the cost of the projects, producing:
1. 𝑃𝐺= $245 000 dollars.
2. 𝑐𝑖= 𝑐𝑖𝑚𝑎𝑥.
Experiment 2: In half of the projects the cost is taken to the upper end, in the remaining projects the midpoint is considered, thus yielding:
1. 𝑃𝐺= $245 000 dollars.
2. 50% of all the projects: 𝑐𝑖= 𝑐𝑖𝑚𝑎𝑥.
3. 50% of all the projects: 𝑐𝑖=
(𝑐𝑖𝑚𝑎𝑥+𝑐𝑖𝑚𝑖𝑛)
2 .
Experiment 3: The midpoints of cost are considered for all projects, yielding:
1. 𝑃𝐺= $245 000 dollars.
2. 𝑐𝑖=
(𝑐𝑖𝑚𝑎𝑥+𝑐𝑖𝑚𝑖𝑛)
2 .
In experiments 4, 5 and 6, the value of 𝑃𝐺 is taken as 𝑃𝐺𝑚𝑖𝑛
.
Therefore𝑃𝐺= $240 000 dollars. Experiment 4: For all the projects the cost is taken to the upper end.1. 𝑃𝐺= $240 000 dollars.
2. 𝑐𝑖= 𝑐𝑖𝑚𝑎𝑥.
Experiment 5: In half of the projects the cost is taken to the upper end and in the remaining projects the midpoint is considered, yielding:
25
2. 50% of all the projects: 𝑐𝑖= 𝑐𝑖𝑚𝑎𝑥.
3. 50% of all the projects: 𝑐𝑖=
(𝑐𝑖𝑚𝑎𝑥+𝑐𝑖𝑚𝑖𝑛)
2 .
Experiment 6: The midpoints of cost for all projects are considered, yielding:
1. 𝑃𝐺= $240 000 dollars.
2. 𝑐𝑖=
(𝑐𝑖𝑚𝑎𝑥+𝑐𝑖𝑚𝑖𝑛)
2 .
Notice that in this work the uncertainty is not contemplated in the objectives,but uncertainty is taken into account in the cost of each project. The number of projects, areas and regions, is the same one for the six experiments.
5.3 Results
This section describes the results of the comparison made among the different experiments (treatment of the uncertainty witho ut the application of the interval analysis) with the purpose of determining whether the solution proposed provides competitive or better results when incorporating uncertainty to the estimated information (treatment of uncertainty applying interval analysis). In the MOEAs, the algorithm performance is measured in terms of non-dominated solutions inside the last generation; this set is known as the approximation to the Pareto frontier. Validation of the results of both experiments was performed through two types of analysis of non-dominated solutions:
Quality Analysis: It determines if the solutions obtained by applying the interval analysisto the treatment of uncertainty provides the best quality solution. This is accomplished by comparing the non-dominated solutions obtained from the NSGA-II by applying interval analysisagainst the non-dominated solutions obtained from modeling the DM’s attitude without applying the interval analysis.
Cardinality: We verify the number of projects contained in the portfolio, inside the column *Card.
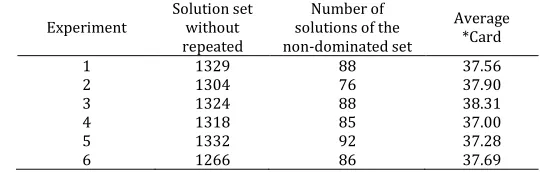
[image:6.612.167.437.536.622.2]In Tables 3 and 4, the results of the entire Pareto front were taken, we shown the comparison of the results obtained with the NSGA-II with Interval Analysis (Table 3) again each of the six heuristics (Table 4) described in the previous section.
Table 3. Results of the analysis realized with NSGA-II with Interval Analysis. Algorithm Solution set without repeated Number of solutions of the non-dominated set Average *Card
NSGA-II
Interval Analysis 1233 45 39.06
Table 4. Results of the analysis realized with NSGA-II without Interval Analysis. Experiment Solution set without
repeated
Number of solutions of the non-dominated set
Average *Card
1 1329 88 37.56
2 1304 76 37.90
3 1324 88 38.31
4 1318 85 37.00
5 1332 92 37.28
6 1266 86 37.69
26
6.
Discussion
In this work, we presented a new tool useful to describe and represent the uncertainty associated with the problems of decision-making in real life. The study of the project portfolio problem was treated using mathematical modeling with interval analysis and considering relevant constraints, preferences, uncertainty and imprecision; to deal with the cost of projects and the total resources available.
The uncertainty and imprecision, were handled in the total availability of the resources, with two quantities of available budget and in the total cost of the projects, through 6 experiments without the application of interval analysis. Therefore, it is proposed to handle the uncertainty with interval analysis, where the total availability value of resources is provided the form of an interval number, as well as the total cost of the projects, generating a single execution in the treatment of uncertainty.
The solution method proposed to solve the portfolio problem consists of generalize the NSGA-II for the interval analysis. After presenting the results, our proposal gives evidence of obtaining good compromise solutions in terms of our quality metrics and robustness. Therefore, we can say that:
i. In a single execution, interval non-dominated solutions were found able to prevail with the analyses without the interval analysis.
ii. The best solutions were obtained in the cardinality of the portfolios.
iii. The treatment with the interval analysis addresses the uncertainty attempting to model the variability in the resources that the project consumes and in the available resources.
As future work, we are going to: (a) increase the number of objectives, (b) include preferences of the DM, (c) implement another algorithm.
Acknowledgements
This work has been partially supported by: a) Consolidation National Lab Project 280712, Project supported by CONACyT; b) Fronteras de la Ciencias Project 1340, Project supported by CONACyT; and, c) Project 3058 from the program Cátedras CONACyT.
References
1. Badri, M.A., Davis, D., Davis, D. A comprehensive 0-1 goal programming model for project selection. International Journal of Project Management, 19 (2001) 243-252.
2. Cruz-Reyes, L., Fernandez, E., Olmedo, R., Sanchez, P., Navarro, J. Preference Incorporation into evolutionary multiobjective optimization using preference information implicit in a set of assignment examples. In Fourth International Workshop on Knowledge Discovery, Knowledge Management and Decision Support. Atlantis Press, (2013) 179-187.
3. Cruz-Reyes, L., Fernandez, E., Gomez, C., Sanchez, P. Preference Incorporation into Evolutionary Multiobjective Optimization Using a Multi-Criteria Evaluation Method. In Recent Advances on Hybrid Approaches for Designing Intelligent Systems. Springer International Publishing, (2014) 533-542.
4. Deb, K., Agrawal, S., Pratap, A., Meyarivan, T. A fast elitist non-dominated sorting genetic algorithm for multi-objective optimization: NSGA-II. Lecture notes in computer science, 1917 (2000) 849-858.
5. Dickinson, M.W., Thornton, A.C., Graves, S. Technology portfolio management: Optimizing interdependent projects on multiple time periods. IEEE Transactions on Engineering Management, 48 (4) (2001) 518-527.
6. López Irarragorri, Fernando, Igor Litvinchev, Miguel Mata Pérez and Elisa Schaeffer. Usando Herramientas de MILP para Estudiar el Modelo de Selección de Portafolios R&D para Casos de Grandes Carteras de Proyectos en el Sector
Social. Computación y Sistemas, 2008, vol. 12, no 002.
7. Klapka, J., Pinos, P. Decision support system for multicriterial R&D and information systems projects selection. European Journal of Operational Research, 140 (2) (2002) 434-446.
8. Moore, R.E.: Interval arithmetic and automatic error analysis in digital computing. Ph. D. Dissertation, Department of Mathematics, Stanford University, Stanford, CA (1962)
27
Control, 10 (4) (2001) 275-286.
10. Rabbani, M., Aramoon, M., Baharian, G. A multi-objective particle swarm optimization for project selection problem. Expert Systems with Applications, 37(1) (2010) 315-321.
11. Rivera, G., Cruz, L., Fernandez, E., Gomez, C., Perez, F. Many-objective portfolio optimization of interdependent projects with ‘a priori’incorporation of decision-maker preferences. Appl. Math, 8(4) (2014) 1517-1531.
12. Salo, A., Keisler, J., Morton, A. Portfolio Decision Analysis. Improved methods for resource allocation, International Series in Operations Research & Management Science. Springer New York, 162 (2011) 3-27.
13. Santhanam, R., Kyparisis, J. A multiple criteria decision model for information system project selection. Computers and Operations Research, 22-8 (1995) 807-818.
14. Sunaga, T.: Theory of interval algebra and its application to numerical analysis. RAAG