EXTERNALITIES IN SOLID WASTE MANAGEMENT:
VALUES, INSTRUMENTS A N D CONTROL
submitted by
Inger Edith Brisson
in fulfilment o f the Ph.D. in Economics Economics Department
ProQuest Number: 10017231
All rights reserved
INFORMATION TO ALL USERS
The quality of this reproduction is dependent upon the quality of the copy submitted.
In the unlikely event that the author did not send a complete manuscript and there are missing pages, these will be noted. Also, if material had to be removed,
a note will indicate the deletion.
uest.
ProQuest 10017231
Published by ProQuest LLC(2016). Copyright of the Dissertation is held by the Author.
All rights reserved.
This work is protected against unauthorized copying under Title 17, United States Code. Microform Edition © ProQuest LLC.
ProQuest LLC
789 East Eisenhower Parkway P.O. Box 1346
Abstract
Acknowledgements
I would like to take this opportunity to thank the following individuals for their assistance during the completion o f this study and my stay at CSERGE:
I would like to thank Professor David Pearce for his patience and guidance, and for providing the opportunity to study at CSERGE.
I would also like to thank the following, all o f whom provided invaluable assistance at different times: Mark Ambler, Ed Calthrop, Amelia Craighill, Stavros Georgiou, Dominic Moran, Ece Ozdemiroglu, Jane Powell and others too numerous to mention.
I would also like to express my gratitude to Jorgen Birk Mortensen, S0M , my funding body, and AKF, for their assistance, financial or otherwise, at different stages o f my studies.
Joint Work
I would like to take this opportunity to accept responsibility for the majority o f the work involved in this thesis, but would also like to acknowledge, and thank for, the contributions o f others. The social cost-benefit analysis o f MSW management systems in the European Union, included as Chapters 4-6, has been adapted from a study for DG XI, European Commission; a collaboration between Coopers & Lybrand, CSERGE and EFTEC. I had primary responsibility for the economic valuation o f environmental effects, and a significant share o f responsibility in respect o f the concluding policy implications, which I have extended further for this thesis. The life cycle inventory, discussed in Chapter 4, was developed in cooperation with my colleagues. Dr Powell and Ms Craighill, at CSERGE at University o f East Anglia. The development process was essentially iterative, where each step involved a process o f checking and, often, recalculation following my inquires, to ensure that the resulting inventory estimates could be employed in the economic valuation, without further conversion.
TABLE OF CONTENTS
ABSTRACT 1
ACKNOWLEDGEMENTS 2
JOINT WORK 3
TABLE OF CONTENTS 4
LIST OF TABLES 10
LIST OF FIGURES AND BOXES 14
0. AIM AND SCOPE OF THE THESIS 16
1. THE PROBLEMS OF SOLID WASTE MANAGEMENT 18
1.1 Waste Arisings Over Time 18
1.1.1 The Quantity o f Waste 18
1.1.2 Changes in Waste Composition 26
Toxic Waste 26
Organic Waste 27
Which Materials Are the Main Environmental Culprits
in the Waste Stream? 28
Packaging Waste 30
1.2 The Main Issues in Waste Management 32
1.2.1 Environmental Costs o f Solid Waste Management 32
Landfill 32
Incineration 33
Recycling and Composting 34
1.2.2 Private Costs o f Waste Management 35
1.2.3 Land Scarcity 36
1.3 Waste Management Methods 40
1.3.1 Dumping or Landfilling 40
1.3.2 Burning or Incineration 42
1.3.3 Biological Gasification 45
1.3.4 Thermochemical Gasification 45
1.3.5 Composting 45
1.3.6 Recycling 46
1.4 The Waste Hierarchy 47
1.5 Summary o f Chapter 1 51
ANNEX 1. THE TELLUS PACKAGING STUDY 53
A. 1.1 Damage Costs Versus Control Costs 53
A. 1.2 Direct Environmental Values 55
A. 1.3 Linked Environmental Values 57
A. 1.4 Conclusion 62
2. ECONOMICS OF WASTE MANAGEMENT: A THEORETICAL
OVERVIEW 63
2.2 Optimal Configuration o f Disposal Options 66
2.2.1 Reuse 66
2 .2.2 Composting 67
2.2.3 The Choice between Recycling, Incineration and
Landfilling 67
The Choice between Landfill and Incineration 68
Full Social Costs 71
2.3 Net Social Costs o f Disposal 75
2.3.1 Net Social Costs o f Landfill Disposal 75
2.3 .2 Net Social Costs o f Incineration 79
2.3.3 Net Social Costs o f Recycling 80
2.4 Summary o f Chapter 2 81
3. ASSESSING THE WASTE HIERARCHY 82
3.1 Appraisal Methods 82
3.1.1 Financial Appraisal 82
3.1.2 Environmental Impact Assessment 82
3.1.3 Multi-criteria Analysis 84
3.1.4 Cost-Benefit Analysis 85
3.2 The Cost-Benefit Approach 89
3.2.1 Landfill 89
3.2.2 Incineration 91
3.2.3 Recycling 92
Collection 92
Displaced Virgin Materials Production 94
3.3 Valuation o f Externalities 95
3.3.1 Life Cycle Inventories 96
3.3.2 Valuing Environmental Impacts 98
Benefits Transfer 100
Transferring Mean Unit Values 101
Transferring Adjusted Unit Values 101
Transferring Benefit Functions 102
3.3.3 Unit Damage Cost Estimates 103
Critical Loads 106
Transboundary Dispersion 109
Differences in Willingness to Pay 110
Damage Estimates 111
Transport Linked Casualties 118
3.4 Summary o f Chapter 3 121
ANNEX 3. UNIT DAMAGE ESTIMATES FOR AIR POLLUTANTS 123
A 3.1 Unadjusted Pollution Damage Costs 123
A3.1.1 Health Effects 123
Mortality Effects from Particulates - PMio 124 Mortality Effects from Acidic Aerosols 125
Morbidity Effects from PMjq 126
Morbidity Effects from Acidic Aerosols 127
4.
5.
A 3.1.3 Damage to Forests 128
A 3.1.4 Control Costs for Neutralising Fresh Waters 129
A 3.1.5 Damages to Buildings and Materials 130
A3.2 Adjusting Damage Estimates for Trans-boundary Effects, Income Elasticities and Differences in Purchasing
Power Parity Rates 132
A3.2.1 Transboundary Dispersion 132
A 3.2.2 Differences in Willingness to Pay 135
A 3.2.3 Transboundary Pollution 136
A 3.2.4 Calculating the Adjusted Damage Estimates for each
o f the EU-12 140
A 3.2.5 Adjusted Damage Estimates for SO2 and N0% 142
Practical Issues 147
A 3.2.6 Adjusted Damage Estimates for Particulates 154
A 3.2.7 Total Damage Estimates 156
A 3.2.8 Damage Estimates for each o f the EU-12 Member
States 158
THE EXTERNALITIES OF MUNICIPAL SOLID WASTE
MANAGEMENT 165
4.1 Partial Economic Life Cycle Assessment 165
4.2 Scoping o f the LCA 166
4.3 Life Cycle Inventory: Assumptions and Data Sources 171
4.3.1 Waste Inputs 171
4.3.2 Collection o f Household Waste 172
4.3.3 Recycling 173
4.3.4 Composting 174
4.3.5 Incineration with Energy Recovery 174
4.3 .6 Landfilling 175
4.3.7 Displaced Energy 175
4.3.8 Future Scenarios 181
4.3.9 Sensitivity Analyses 194
4.4 Summary o f Chapter 4 195
FINANCIAL COSTS OF MUNICIPAL SOLID WASTE DISPOSAL 198
5.1 Financial Cost Categories and Elements 198
5.1.1 MSW Categories 198
5.1.2 Financial Cost Elements in MSW Treatment 199
5.1.3 Adjustment o f Financial Costs 200
5.2 Financial Cost Estimates o f Present MSW Treatment in EU
Member States 202
5.2.1 Estimating the Financial Costs o f Present MSW
Treatment Practices in EU Member States 202 Present - mixed refuse collection, bring system f o r
recyclable and organic materials 202
5.2.2 Co-collection versus Separate Collection 205 Present - co-collection o f mixed refuse and recyclable
Present - separate collection o f mixed refuse and
recyclable & organic materials (wheelie bins) 207 5.3 Ranking o f Present MSW Treatment Methods According to
Financial Costs 210
5.3.1 Ranking o f Present MSW Treatment Practices
According to Financial Costs 210
Bring Systems 210
Co-collection at Kerbside 211
Separate Kerbside Collection 211
5.4 Financial Cost Estimates o f Future MSW Treatment in EU
Member States 212
5.4.1 Estimating the Financial Costs o f Future MSW
Treatment Scenarios in Four EU Member States 212 Future - co-collection o f mixed refuse and recyclable
& organic materials (blue box) 212 Future - separate collection o f mixed refuse and
recyclable & organic materials (wheelie bins) 214 5.4 .2 Comparison o f Present and Future Financial Costs 216 5.5 Financial Costs o f Recycling Selected Materials 217
5 .6 Summary o f Chapter 5 218
6. THE NET SOCIAL COSTS OF MSW MANAGEMENT: RESULTS
AND POLICY IMPLICATIONS 220
6.1 The Net Social Costs o f Present MSW Management Practices 220 6.1.1 Average Ranking o f Present MSW Management
Practices in the EU 221
6.2 Net Social Costs o f Future MSW Management 225 6.2.1 Average Ranking o f Future MSW Management
Options in the EU 225
6.3 Net Social Costs o f Recycling o f Selected Materials in the UK 227
6.4 Assessment o f the ‘Waste Hierarchy’ 230
6.4.1 Source Reduction 231
6.4.2 Reuse 234
6.4.3 Recycling 236
6.4.4 Incineration 238
6.4.5 Landfill 238
6 .4 .6 Composting 239
6 .4.7 The ‘New Waste Hierarchy* 239
6.5 Site Disamenity Effects 242
6.5.1 Survey o f Studies Estimating the Disamenity Effects
from Waste Treatment Facilities 242
6.5.2 A Survey o f Hedonic Property Price Studies o f
Disamenity Effects from Waste Facilities 243 A Linear Regression o f the Hedonic Property Price
Studies 247
6.5.3 A Survey o f Contingent Valuation Studies o f
6.5.4 A Possible Benefits Transfer Function for Site
Disamenities 250
6.6 Summary o f Chapter 6 252
7. THE ROLE OF ECONOMIC INSTRUMENTS IN WASTE
MANAGEMENT 254
7.1 Economic Instruments 255
8.
7.1.1 Unit Pricing for Waste Services 255
Practical Experiences o f Unit Pricing f o r Waste
Services 259
7.1.2 Landfill Taxes 263
Examples o f Landfill Levies in Practice 263
7.1.3 Recycling Credits 272
Recycling Credits in the United Kingdom 273
Effects o f the Recycling Credits 274
7 .1.4 Product Charges 275
7.1.5 Deposit-refund Systems 276
Calculation o f Deposit-Refunds 278
DRSs in the USA 282
DRSs in Australia 285
DRSs in the UK 291
7.1.6 Tradeable Quotas 292
7.2 Summary o f Chapter 7 and Evaluation o f Economic
Instruments 294
PACKAGING WASTE 297
8.1 The German Packaging Ordinance and the Dual
System 298
8.1.1 The Packaging Ordinance 298
8.1.2 Evaluation o f the German Packaging Ordinance 299
8.1.3 Duales System Deutschland 302
8.1.4 Evaluation o f the DSD 305
8.2 The EU Directive on Packaging and Packaging Waste 311
8.2.1 Prevention 313
8.2.2 Recovery and Recycling Targets 313
8.2.3 Economic Instruments 315
8.2.4 Evaluation o f the Packaging and Packaging Waste
Directive 315
8.3 Producer Responsibility for Packaging in the United Kingdom 315 8.3.1 Proposed Options for Sharing the Responsibility
for Packaging Recovery 317
8.3.2 Shared Producer Responsibility 319
8.3.3 Key for Sharing Responsibility 320
8.4 A Packaging Tax 321
8.4.1 Costs Associated with Packaging 322
8.4.2 Using Life Cycle Assessment in Determining a
8.4.3 External Costs to be Included in the Packaging Tax 324 8.4.4 The Basic Model for calculating a Packaging Tax 325 8.5 An Example o f Packaging Taxes in the United Kingdom 329
8.5.1 The Beverage Containers Selected for Illustrating
the Packaging Tax 330
8.5.2 Excluding or Including ‘Up-Stream’ Externalities? 331
8.5.3 Conclusions about Packaging Taxes 335
9. CONCLUSIONS 341
9.1 Introduction 341
9.2 Cost-benefit Analysis - Methodology 341
9.3 Cost-benefit Analysis - Results 342
9.4 A Preferred Economic Instrument? 348
9.5 Caveats and Areas for Further Research 349
LIST OF TABLES
Chapter 1 Table 1.1 Table 1.2 Table 1.3 Table 1.4 Table 1.5
Annex 1 Table A. 1.1 Table A. 1.2
Table A. 1.3
Chapter 3 Table 3.1 Table 3.2 Table 3.3 Table 3.4
Annex 3 Table A 3.1.1 Table A 3.1.2 Table A 3.1.3 Table A 3.1.4 Table A 3.1.5 Table A 3.2.1
Table A 3.2.2
Table A 3.2.3
Table A 3.2.4
Table A 3.2.5
Table A 3.2.6
Table A 3.2.7
Controlled Waste Arisings 22
Municipal Solid Waste Arisings 26
Perceived Versus Actual Volumes o f Waste in Landfills 29
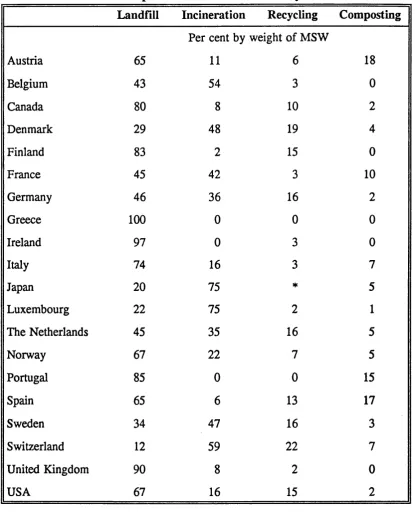
Disposal o f MSW: Breakdown by Method 44
Potential Savings from Recycling 47
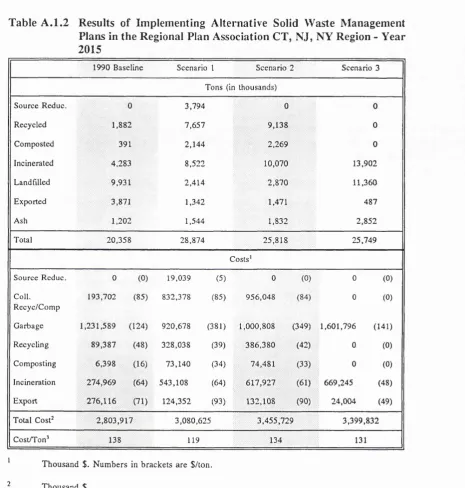
Control Cost Estimates for Criteria Pollutants: Tellus Study 56 Results o f Implementing Alternative Solid Waste
Management Plans in the Regional Plan Association
CT, NJ, NY Region - Year 2015 60
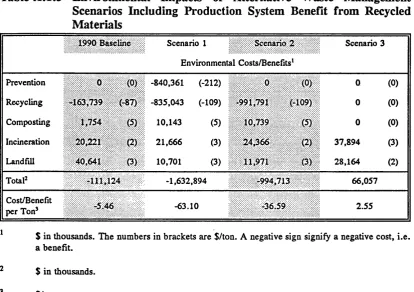
Environmental Impacts o f Alternative Waste Management Scenarios Including Production System Benefit from
Recycled Materials 61
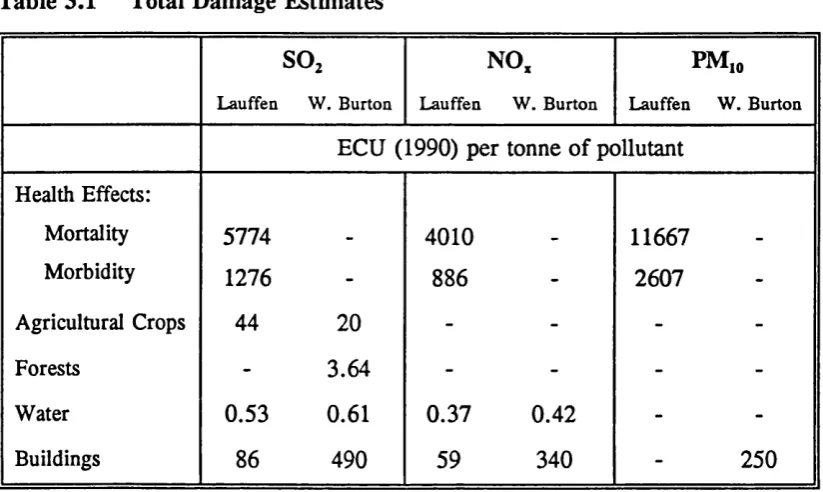
Total Damage Estimates 112
Total Damage Estimates - income elasticity o f 0.3 115 Total Damage Estimates - income elasticity o f 1 116 The Risk o f Casualties Due to HGVs and Passenger Cars in
EU Member States 120
Agricultural Crop Damages 128
Forest Damages 129
Water Control Costs 129
Building Damages 131
Total Damage Estimates 132
Relative Dispersion o f Oxidised Sulphur Emissions
- Average 1985-1994 138
Relative Dispersion Of Oxidised Nitrogen Emissions
- Average 1985-1994 139
Total Adjusted Damage Estimates for SO% Emissions from
each EU-12 Member State (e = 0.3) 143
Total Adjusted Damage Estimates for SO; Emissions from
each EU-12 Member State {e = 1) 144
Total Adjusted Damage Estimates for NO* Emissions from
each EU-12 Member State (e = 0.3) 145
Total Adjusted Damage Estimates for N0% Emissions from
each EU-12 Member State (6 = 1) 146
Purchasing Power Parity Rates (1993) (GNP per capita) and Income Elasticity o f Demand for Environmental
Table A 3.2.8
Table A 3.2.9
Table A 3.2.10
Table A 3.2.11
Table A 3.2.12
Table Table Table Table Table Table Table Table Table Table Table Table Table Table A 3.2.13 A 3.2.14 A 3.2.15 A 3.2.16 A 3.2.17 A 3.2.18 A 3.2.19 A 3.2.20 A 3.2.21 A 3.2.22 A 3.2.23 A 3.2.24 A 3.2.25 A 3.2.26
Purchasing Power Parity Rates (1993) (GNP per capita) and Income Elasticity o f Demand for Environmental Quality = 1
The Value o f a Statistical Life - adjusted with incomes at PPP-rates and an income elasticity o f demand for reduced risk o f mortality o f 0.3
The Value o f a Statistical Life - adjusted with incomes at PPP-rates and an income elasticity o f demand for reduced risk o f mortality o f 0.3
Particulate Damage Estimates - adjusted with incomes at PPP-rates and an income elasticity o f 0.3
Particulate Damage Estimates - adjusted with PPP-rates and an income elasticity o f 1
Total Damage Estimates - income elasticity o f 0.3 Total Damage Estimates - income elasticity o f 1 Damage Estimates for Belgium
Damage Estimates for Denmark Damage Estimates for France Damage Estimates for Germany Damage Estimates for Greece Damage Estimates for Ireland Damage Estimates for Italy
Damage Estimates for Luxembourg Damage Estimates for the Netherlands Damage Estimates for Portugal
Damage Estimates for Spain
Damage Estimates for the United Kingdom
150 152 153 155 156 157 157 158 159 159 160 160 161 161 162 162 163 163 164
Chapter 4
Table 4.1 Present MSW Management Configuration 168
Table 4.2 Boundary Definitions for the Life Cycle Inventory o f
MSW Treatment 169
Table 4.3 Estimated MSW Composition 170
Table 4.4 Economic Values for Road Traffic Accidents 177
Table 4.5 Net External Costs Associated with Present MSW Management Practices in the EU (income elasticity
= 0.3) 179
Table 4 .6 Projected MSW Management Configuration in Future
‘Technological’ Scenario 182
Table 4.7 External Costs Associated with Future ( ‘Technological
Table 4.15 External Costs o f Present MSW Management in
Luxembourg 190
Table 4.16 External Costs o f Present MSW Management in the
Netherlands 191
Table 4.17 External Costs o f Present MSW Management in Portugal 191 Table 4.18 External Costs o f Present MSW Management in Spain 192 Table 4.19 External Costs o f Present MSW Management in the
United Kingdom 192
Table 4.20 Accident Costs* Relative Share o f Total External Costs
Associated with Present MSW Management in the EU 193 Table 4.21 External Benefits Associated with Recycling in the UK 195
Chapter 5
Table 5.1 MSW Treatments Analysed 198
Table 5.2 Financial Costs Elements in MSW Treatment 200
Table 5.3 Total Present Net Unit Financial Costs o f each MSW
Treatment Method by Member State 203
Table 5.4 Present Composition o f MSW recovered for Recycling 208 Table 5.5 Financial Costs o f Present MSW Management in the
European Union 209
Table 5.6 Future (‘Technological Scenario*) Net Unit Financial
Costs o f each MSW Treatment Method 213
Table 5.7 Composition o f MSW recovered for Recycling (Future
‘Technological* Blue Box Scenario 215
Table 5.8 Composition o f MSW recovered for Recycling (Future
‘Technological* Split Bin Scenario 215
Table 5.9 Financial Costs o f Future (‘Technological* MSW
Management in the European Union 216
Table 5.10 Financial Costs o f Recycling in the United Kingdom 217
Chapter 6
Table 6.1 Total External and Financial Costs Associated with Present MSW Management Practices in the EU
Table 6.2 Average Ranking o f Presently Employed MSW Management Options
Table 6.3 Total Environmental and Financial Costs Associated with Future (‘Technological Scenario’) MSW Management Practices in the EU
Table 6.4 Average Ranking o f Future MSW Management Options Table 6.5 Total Environmental and Financial Benefits Associated
with Recycling in the UK
Table 6.6 A ‘New Waste Hierarchy* - Based on Ranking o f Average Net Social Costs o f MSW Treatment
Table 6.7 Summary o f Hedonic Property Price Studies
Table 6.8 House Price Reduction as a Function o f Distance from Waste Facility
Table 6.9 Summary o f Contingent Valuation Studies
Chapter 7 Table 7.1 Table 7.2
Chapter 8 Table 8.1 Table 8.2 Table 8.3
Table 8.4
Table 8.5
Table 8.6
Chapter 9 Table 9.1
Table 9.2
Table 9.3
Table 9.4
Results o f the BRRU Study Effects o f Economic Instruments
287 295
German Collection and Reprocessing Targets 302 Prescribed and Achieved Reprocessing Rates for 1994 307 A Weight related Packaging Tax for UK Beverage
Containers - Excluding Up-Stream Externalities 332 A Weight-Volume related Packaging Tax for UK Beverage
Containers - Excluding Up-Stream Externalities 333 A Weight related Packaging Tax for Beverage Containers
in the UK - Including Externalities from Production
and Recycling Processes 337
A Weight-Volume related Packaging Tax for Beverage in the UK Containers - Including Externalities from
Production and Recycling Processes 338
Total External and Financial Costs Associated with Present
MSW Management Practices in the EU 343
Total External and Financial Costs Associated with Future (‘Technological Scenario*) MSW Management Practices
in the EU 344
Total External and Financial Benefits Associated with
Recycling in the UK 345
LIST OF FIGURES AND BOXES
Chapter 1 Figure 1.1 Figure 1.2
Chapter 2 Figure 2.1 Figure 2.2
Figure 2.3
Development in Total MSW Arisings 23
Municipal Solid Waste per Capita per Year 25
Demand for Solid Waste Services 65
Optimal Levels o f Landfill and Incineration, Taking Account
o f Private Costs Only 70
Optimal Levels o f Recycling, Incineration and Landfill under
Full Social Costs 74
Chapter 3 Figure 3.1a Figure 3.1b Figure 3.1c
Critical Loads - Equal Marginal Damage Critical Loads - Importance o f Current Position
Critical Loads - Different Marginal Damage Functions
Annex 3
Figure A3.1 Dispersion o f Pollutant k
Chapter 4 Figure 4.1
Figure 4.2
Figure 4.3
External Costs Associated with Present MSW Management in the EU
External Costs Associated with Future ‘Technological* MSW Management
External Benefits Associated with the Recycling o f Selected Materials in the UK
107 108 108 133 180 184 196
Chapter 6 Figure 6.1 Figure 6.2
Figure 6.3 Figure 6.4
Figure 6.5
Chapter 7 Figure 7.1 Figure 7.2 Box 7. A Figure 7.3a Figure 7.3b Figure 7.4 Figure 7.5
Total External and Financial Costs o f MSW Management 223 External and Financial Costs o f MSW Management
- shown separately 223
Total External and Financial Benefits o f Recycling in the UK 229 Reduction in Property Prices as a Function o f Distance from
Waste Facilities 246
House Price Reduction Regressed on Distance from Waste
Facility 248
Optimal Demand for Waste Services 256
Marginal versus Average Costs o f Waste Services 257
A Landfill Levy 265
Configuration without a Landfill Levy 265
Configuration with a Landfill Levy 265
A Recycling Credit 272
Figure 7.6 A Government run Deposit-Refund System 279
Figure 7.7 Consumer Surplus Losses 284
Figure 7.8 Demand for Soft Drinks 289
Chapter 8
Figure 8.1 Weight-related Packaging Tax for UK Beverage Containers - Excluding Externalities o f the Production and
Recycling Processes 334
Figure 8.2 Weight-volume related Packaging Tax for UK Beverage Containers - Excluding Externalities o f the Production
And Recycling Processes 334
Figure 8.3 Weight-related Packaging Tax for UK Beverage Containers - Including Externalities o f the Production and
Recycling Processes 339
Figure 8.4 Weight-volume related Packaging Tax for UK Beverage Containers - Including Externalities o f the Production
0.
Aim and Scope of the Thesis
This thesis employs a cost-benefit methodology in an attempt to answer several fundamental questions about waste management policy, both in the European Union, and more generally. These questions include the following:
(a) is it possible to determine a social ranking o f waste disposal and recovery options? This issue is widely discussed in the literature under the heading o f the ‘waste hierarchy*, in which some forms o f waste management, notably recovery and reuse, are ranked above others, e.g. incineration and landfill;
(b) Having ascertained some approximation o f the optimal configuration o f waste management options, what is the potential rôle o f economic instruments such as taxes, tax-subsidy systems, tradeable permits, etc., within that configuration?
The main focus o f the study will be on the management o f municipal solid waste (MSW) in the developed world, or more particularly, the European Union. The study will concentrate on four core waste treatment options: Landfill, incineration, composting and recycling. Source reduction and reuse will be discussed briefly in Chapter 6.
Chapter 1 offers a brief exposition on the trends in waste generation, together with the environmental problems, the main waste management methods and the associated costs. Chapter 2 endeavours to provide a theoretical overview o f the economics o f solid waste management. It considers both the idea o f optimal waste generation, together with the identification o f the optimal distribution between the discrete waste management options; landfill, incineration and recycling. Chapter 2 continues by considering those elements that constitute the marginal net costs o f each o f those waste management methods.
hierarchy’. It continues by detailing the actual methodology employed, including the utilisation o f a simple benefits transfer model to transfer economic damage estimates for air pollutants.
Chapters 4 utilises the results o f this benefits transfer and life cycle inventories compiled for municipal solid waste (MSW) management, to estimate the external costs o f landfilling, incineration, recycling and composting in the European Union. Chapter 5 reports the results o f a study that estimated the private costs o f these MSW management systems in the European Union.
Chapter 6 draws together the estimates o f Chapters 4 and 5, to undertake a social cost-benefit analysis o f MSW management in the European Union. The results o f this analysis are then employed to assess the tenets o f the ‘waste hierarchy’. Although the particular social costs associated with source reduction and reuse, are not included in this study, their likely benefits and costs are discussed, relative to recycling, to ascertain likely implications in relation to the ‘waste hierarchy’. Thus, on the basis o f the social cost-benefit analysis and the discussion o f source reduction and reuse, a ranking o f waste management methods is provided. Chapter 6 also reviews the existing literature on disamenities associated with landfills and incinerators, and assesses the extent and implication o f this external cost for the analysis.
1.
The Problems of Solid Waste Management
If the media are to be believed, the western world is on the brink o f a major crisis, one that has, apparently, grown in both scale and significance over the past five to ten years. The underlying problem is the increasing material and energy consump tion o f the economies o f the developed world, together with the resultant problem o f how to dispose o f the resulting waste. This concern appears to have been deepened by a perception that suitable landfill space is limited. Whether true or not, landfilling is only one o f a number o f possible solutions, and one beneficial aspect o f the higher profile o f this issue is a greater awareness of, and sometimes the introduction of, alternative policy options. These alternative policy options have ranged from the banning o f certain types o f packaging and disposables, to the introduction o f comprehensive recycling schemes. However, the arguments put forward for the promotion o f one waste treatment option over another, or one policy instrument over another, appear weak. This partly reflects the problem that all the alternatives appear to suffer from a paucity o f supporting economic evidence. This thesis makes a modest contribution to addressing this issue. This chapter starts with an illustration o f the general trends in waste arisings, prior to identifying the main issues in the debate, together with the related environmental problems. It also offers an exposition o f the various waste management methods that are available.
1.1
WASTE ARISINGS OVER TIME
The scale and significance o f the problem is best illustrated by consideration o f the development in waste arisings over time. There are two main aspects to this issue: The quantity o f waste produced, and the quality o f waste produced.
1.1.1 The Quantity of Waste
generating more waste than his, or her, predecessor? Although the answer to the first question is undoubtedly yes, the answer to the second question appears less clear cut. The main problem is the paucity o f suitable data, a reflection o f the lack o f tradition for measuring the amount o f waste disposed, let alone generated, in the past. Indeed, it was not until the late nineteenth century that comprehensive systems o f public-sector waste management were initiated, as a response to the cholera epidemics which swept Europe at that time. The result was a concerted effort to improve both hygiene and sanitation across Europe and the United States.
In the United Kingdom, which provided the inspiration for a number o f other countries, local health boards and commissions were set up following the Public Health Act o f 1848. In 1858, Denmark, following the British example, introduced health regulations which initiated the setting up o f local health boards (Blomquist, 1990 and Jensen, 1977). Whilst one o f the most prominent concerns was water supply, the health boards* area o f responsibility also extended to the removal o f wastes. Prior to the health regulations, the removal o f human wastes, and to some extent garbage, in market towns was governed by bye-laws, which had been in place since the Middle Ages. However, the extent o f garbage removal was rather limited; common practice involved throwing garbage and slops into the streets, and only occasionally would the worst excesses be collected and carted away (Blomquist, 1996). In Sweden, local health boards were created following the first national Public Health Act o f 1874, but as Rogers & Nelson (1992) point out:
‘sanitation, the removal o f human waste and garbage, is clearly that area o f preventive
public health that received the least attention. It was only after 1890 that the larger
cities began to deal with this and by 1910 a quarter still had not resolved the problem.
Several different procedures were adopted. In some cities local sanitation authorities
were created to provide for the removal and treatment o f waste products. In others
garbage and latrine removal was leased out to private companies. In several towns
removal o f wastes was left to individual property owners, at times under local
supervision, at times not. Only a minority o f the small and very small towns had
Rathje & Murphy (1992) note that in the United States the first municipal streetcleaning service was instituted by Benjamin Franklin in Philadelphia in 1757. The practice o f American households digging refuse pits, as opposed to just discarding the refuse outside the house in the street or the yard, also dates to around that time (Deetz, 1977). However, the first comprehensive system o f public-sector garbage management in the country was not set up until 1895, when the first street cleaning commissioner was appointed in New York. Rathje & Murphy (1992) note, referring to data gathered by the historian Melosi, that in 1880 fewer than a quarter o f all American cities had a municipally run garbage disposing system, compared to eight out o f ten by the year 1910.
However, actual statutory responsibility for waste management was only placed on local governments much later: In the United Kingdom, it was the Public Health Act o f 1936 that first imposed the statutory responsibility to collect and dispose o f rubbish on local government (Szymanski & Wilkins, 1993). In Denmark, although local authorities had taken on the responsibility o f setting up waste collection and disposal schemes, and these had developed with time since the establishment o f local health boards, following the 1858 Health Regulations, this only became their statutory responsibility with the introduction o f the First Environmental Protection Act in 1974.
But even after the introduction o f public-sector waste management, there was still no incentive to keep any record o f the amount o f waste collected and disposed of. As a consequence, there are few, if any, countries in the world, that have totally reliable data for waste generation and disposal.
received, is an average measure, based on the above reports o f arriving lorries together with an estimate o f their average load.
A further important aspect o f measuring waste is the choice o f definition. Often in the debate about waste, and particularly in the debate about waste and recycling, only municipal solid waste (MSW), and in some cases only household waste, is considered. But, while in England and Wales an estimated 20 million tonnes o f MSW was generated per year in the late 1980s, an estimated 56 million tonnes o f industrial waste, 13 million tonnes o f waste from energy production, 80 million tonnes o f agricultural waste, 107 million tonnes o f mining waste, 32 million tonnes o f construction and demolition waste, 21 million tonnes o f dredge spoils and 1 millions tonnes o f sewage sludge was generated in each year, totalling roughly 330 million tonnes annually. Of total waste arisings, the United Kingdom defines MSW*, demolition and construction waste, industrial waste and waste from energy production as controlled waste; that is, waste which must be disposed o f in a controlled manner^. It is this fraction o f the total waste stream which ought to be o f primary concern in the discussion o f waste management and a possible crisis. Controlled waste arisings were estimated at around 120 million tonnes per year for England and Wales in the late 1980s.
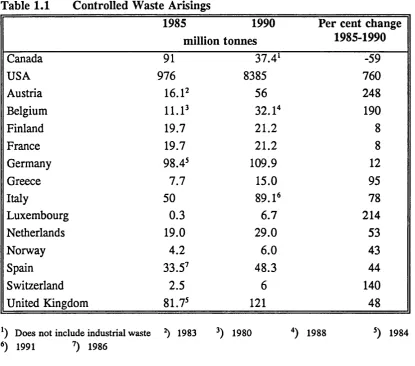
The lack o f data makes it difficult to provide a long term picture o f the development in the arisings o f controlled waste. Table 1.1 shows the best available data for controlled waste for a number o f OECD countries in the mid-1980s and in 1990 (OECD, 1989 & 1993).
Which consists of household and small scale commercial waste.
Table 1.1
Controlled Waste Arisings
1985
1990
Per cent change
million tonnes
1985-1990
Canada 91 37.4' -59
USA 976 8385 760
Austria 16.U 56 248
Belgium 11.P 32. U 190
Finland 19.7 21.2 8
France 19.7 21.2 8
Germany 98.4^ 109.9 12
Greece 7.7 15.0 95
Italy 50 89.1^ 78
Luxembourg 0.3 6.7 214
Netherlands 19.0 29.0 53
Norway 4.2 6.0 43
Spain 33.5^ 48.3 44
Switzerland 2.5 6 140
United Kingdom 81.7^ 121 48
Does not include industrial waste ^ 1983 1980 '^) 1988 1984
1991 '’) 1986
Source: OECD (1989 & 1993)
If one ignores definitional problems, the data suggest a general trend o f increasing waste arisings over time. It is a reasonable assumption that in a ‘business-as-usual’ scenario, this trend will continue in line with economic development.
In the same way that the debate has focused on MSW, rather than the larger category o f controlled waste, so the data available concentrate on MSW arisings rather than controlled waste. Thus, data are available for a longer period for MSW. Figure 1.1 shows the development in total MSW arisings for selected OECD countries for the period 1970 to 1985.
arisings has been calculated which uses 1980 as the base year^. A general trend can be identified and appears indicative of an increase in total MSW arisings'*. However, the significance of this trend is partly qualified by the relative brevity of the time period covered by the data.
Index 1980=100
1 6 0
-U K /
140
-A ustria
1 2 0
-Belgium Japai
100
-8 0
-U SA
tjennany
6 0
-Liechtenstein
40
-Switzer land
2 0
-Y ear
70 71 72 73 74 75 76 77 78 79 80 81 82 83 84 85
Figure 1.1 Development in Total MSW Arisings
Source: OECD (1989 & 1993)
Rathje & Murphy (1992) provide two examples which illustrate that the contempo rary consumer may not necessarily be more wasteful than his ancestors. In the first, they compare ancient Troy with present day New York:
except in the case o f Austria and Switzerland where no data are available for 1980; 1979 is then used as base year instead.
An exception is W est Germany which displays a considerable dip after 1980. W hether this is because o f an actual change in the waste generation rate or w hether it is due to inconsistencies in the data gathering is unclear. Another exception is Japan which throughout the period oscillates in the interval betw een 92 and 102 with no clear trend. Sw itzerland shows a clear upward trend for the period 1970 to 1980 from an index o f 43 to 100. D ata are also available for 1983 for Switzerland. H ow ever, as there is a wide disparity betw een the figure for 1983 (the index is 381) and the rest o f the period, this observation has been omitted from the diagram . The United Kingdom displays an implausible increase from 1983 to 1985 which may be due to inclusion o f other types o f waste than M SW in the 1985 figure.
In 1973 Charles Gunnerson, a civil engineer with the U.S. Department o f Commerce's
Environmental Research Laboratories, calculated that the rate o f elevation due to debris
accumulation in Troy was about 4.7 feet per century... [Gunnerson also] calculated that
if all o f the garbage from Manhattan that is currently sent to Fresh Kills [the landfill
on Staten Island] and all the construction and demolition debris from Manhattan that is
currently dumped at sea were instead spread out evenly over the island, the rate o f
accumulation per century would be exactly the same as that o f ancient Troy.
In the second example, the authors refer to the excavations in Colorado by the archaeologist Joe Ben Wheat, which revealed the remains o f a herd o f bison killed by palæo-Indian hunters:
Two hundred bison were killed, and o f these the hunters butchered 150. By one
estimate, the hunters carried off enough meat to feed 150 people for some 23 days.
Behind them they abandoned the leftovers that archaeologists uncovered 8500 years
later: 18,380 pounds of bones. Compare those 18,380 pounds to the total amount o f
garbage that, according to the highest estimates put forth by the Environmental
Protection Agency, 150 latter-day Americans throw away in 23 days: a relatively
modest 14,145 pounds, which includes all household food debris and food packaging,
all non-food packaging, all yard waste and other household waste, and all the garbage
for which these 150 people are responsible in schools, offices, stores, and restaurants.
Left in the open, as the bison carcasses were, much o f that 14,145 pounds o f modem
garbage would rapidly biodegrade.
As Rathje and Murphy concede this comparison is, o f course, extreme. Today, most household waste consists o f materials that have been processed, and waste is generated in the process and not attributed to the household. A proportion o f that residue has further uses, e.g. as animal fodder, but the remaining waste is categorised as e.g. industrial or agricultural waste. Thus, Rathje and Murphy suggest that the demands o f present day consumers still create far more waste than the amount they personally dispose of.
kg/capita/year
800
700
U SA 600
500
Belgium^
Japan UK
400
West Germany
300 Switzerland
200
Austria Liechtenstein
100
Year
70 71 72 73 74 75 76 77 78 79 80 81 82 83 84 85
Source: OECD (1989 & 1993)
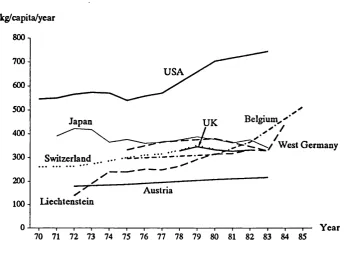
Figure 1.2
Municipal Solid Waste per Capita per Year
In line with Rathje and Murphy’s (1992) assertion, Figure 1.2 shows that there has been a steady increase in MSW generation rates per person over the 15-year period from 1970 to 1985, although similar concerns relating to the period o f data coverage arise. Despite these concerns, it appears a reasonable assumption that society today does indeed generate more waste per capita than in the past.
Table 1.2 Municipal Solid Waste Arisings
Low Income $350/capita/year
M iddle Income $l,950/capita/year
H igh Income $ 17,500/capita/year MSW Arisings
per capita 200 kg/cap/yr 300 kg/cap/yr 600 kg/cap/yr
MSW/$ income 0.51 kg/$ 0.15 kg/$ 0.03 kg/$
Source: Pearce & Turner (1994)
On this basis, it can reasonably be assumed that waste arisings will increase over time, both as the world’s population grows and with rising income levels.
1 .1.2 Changes in W aste Composition
In the disposal o f waste, it is not only the quantity o f waste arisings that is o f concern, but also the composition o f the waste. The composition o f the waste is important both in determining the particular types o f emissions that will result from incineration or landfilling, and how much o f the waste can be reused or recycled.
Toxic Waste
As will be discussed in section 1.2.1, even MSW landfills, where no co-disposal o f MSW and industrial waste has taken place, can cause serious environmental pollution. The pollution reflects the toxicity o f some o f the elements present in the waste stream. Is this a new phenomenon? Has the composition o f waste changed significantly over, say, the last century? Once again, Rathje & Murphy (1992) provide some indications in this direction:
Comparisons o f the relative volume o f toxic materials in today’s Sunnyvale landfill
[California] and in a dump in Florence, Arizona, that was active between 19(X) and
1945 confirm what most people would suspect: Contemporary society is dependent on
far more products with a toxic potential than was the society inhabited by our
grandparents and great-grandparents. The Florence excavations reveal, however, that
by the 1940s the quantity o f hazardous waste entering the dump there had risen to
metals). The results suggest that Americans have been producers o f highly contami
nated garbage not for ten or twenty years but for at least half a century.
And yet, as another Garbage Project study shows, people generally have no idea o f the
amount - or the nature - o f the hazardous waste they discard. When asked, residents
o f Marin County tended to say that most o f the hazardous waste they throw away
consists o f motor oil (46.1% o f household hazardous waste discards, according to
self-reports) and paints and thinners (41.4%). Their actual garbage says otherwise: People
throw out a lot less paint (28.1%) and motor oil (23.0%) than they think, and a lot
more household cleaners and pesticides (37.5 %) than they suspect.
...It is not true, however, that municipal landfills, in terms o f toxicity, are indistin
guishable from industrial waste landfills - a claim that one occasionally hears,
particularly from some spokesmen for manufacturing groups.
Thus, it appears that in present-day society more, potentially toxic, waste is disposed o f than, say a hundred years ago. This is not to say, however, that there was little toxic waste a hundred years ago; indeed the disposal patterns o f yesteryear are still causing problems today, as toxic waste was often dumped at numerous local sites, rather than in central landfills. This dispersion was central to the UK Government’s decision to abandon plans to open a contaminated land register, reflecting fears that knowledge o f the widespread nature o f the problem might inflame public concern. The increased presence o f toxic materials in the waste stream also raises the risk o f serious pollution from landfill leachate (see Reinhart, 1993) and reinforces the requirement for pollution control on waste incinerators.
Organic Waste
In addition to an increase in toxic materials in the waste stream, together with concerns over the impact o f new chemical compounds whose effects^ are little known, changing waste management practices have led to an increase in the proportion o f organic materials in the waste stream. Until the beginning o f this century, slopping was common practice. This involved the dumping o f food waste
in gutters to feed domestic animals. Rathje and Murphy (1992) refer to a 1930 survey o f 557 American cities, which found that 40 per cent o f the cities still saved their wet garbage for slopping, although the waste was now fed to the animals on farms rather than in the streets. This was despite increasing concern over the incidence o f trichinosis in pigs fed on garbage. The practice was finally prohibited in the U .S . in the mid-1950s, in a bid to contain the spread o f a vesicular exanthema epidemic. In less developed countries, the practice is still commonplace. In some cities, whole communities, such as thepepenadores in Mexico City and the zabaline in Cairo, make their living from landfills by scavenging and keeping their livestock on them.
Which Materials Are the Main Environmental Culprits in the Waste Stream? Over the last decade, media attention has focused disproportionately on certain elements o f the waste stream as being the main culprits in the ‘waste crisis*. Table 1.3, from Rathje & Murphy (1992), compares perceived with actual volumes o f waste. The second column reports the results o f a 1990 Roper poll, asking people how much space they thought different materials took up in the landfill. Note the apparent inconsistency between the individuals* perception o f the relative importance o f newspaper vis à vis all paper in this column. The third column reports the results from landfill excavations undertaken by the Garbage Project o f the University o f Arizona. Note that this column appears to sum to greater than 100 per cent, but this is explained by the category o f newspapers being included both individually and with all paper.
Table 1.3 Perceived Versus Actual Volumes of Waste in Landfills
Roper survey Perceived volumes
%
Garbage Project Actual volumes
%
Disposable diapers 41 < 2
Plastic bottles 29 < 1
Large appliances 24 < 2
Newspapers 11 - 1 3
All paper 6 > 4 0
Food and yard waste 3 - 7
Construction debris 0 - 1 2
Source: Rathje & Murphy (1992)
landfills is actually only 16 per cent. They also refute the claim that the relative proportion in the landfill is increasing year by year. Although, a larger number o f objects are made from plastic today than in 1970, or indeed 1950, the amount o f physical landfill space required to dispose o f it is unchanged. Rathje & Murphy (1992) ascribe this phenomenon to ‘light-weighting’ - the manufacture o f objects in such a way that they retain all the necessary functional characteristics, but require the use o f less resin^. An additional advantage o f this process is the fact that when the plastic is lighter, it is also easier to crush, thus allowing more plastic items to be compressed into a given volume o f landfill.
As Table 1.3 illustrates, one material that makes up a significant proportion o f MSW is paper. Despite predictions about ‘the paperless office’ and a new paperless culture, the proportion o f paper in the waste stream has remained fairly stable.
For all the competition since the 1950s from plastic, metal, construction-and-demolition
debris, and non-paperaceous organics, paper’s contribution to a landfill’s contents has
remained relatively even, at well over 40 per cent. Newspapers alone may take up
some 13 per cent or more o f the space in the average landfill - nearly as much as all
plastics. Paper used in the packaging o f consumer goods has grown in volume by
about a third since 1960. Non-packaging paper - computer paper, stationery, paper
plates and cups, junk mail - has doubled in volume. The volume o f discarded
magazines has likewise doubled, to about 1.2 per cent - about as much as all the
thrown-away fast-food packaging and expanded polystyrene foam combined.
Rathje & Murphy (1992)
These statistics suggest that if society wants to reduce the volume o f waste going to landfill, it may be worthwhile commencing with paper. This suggestion is reinforced by the finding that paper does not degrade appreciably over time in landfills, so will not reduce in volume.
Packaging Waste
Another alleged villain in the ‘waste crisis* is packaging, with many countries recently imposing strict recycling targets in order to significantly reduce the amount o f waste requiring disposal (see Chapter 8 for a full discussion). The Garbage Project (Rathje & Murphy, 1992) analysed its data for packaging for the period
1978-1988, and found that:
In per-capita terms the amount o f material in municipal solid waste than can be
classified as packaging has experienced a gradual but real decline. The decline has
occurred in packaging made o f virtually every kind o f material. The amount o f paper
is down^. Aluminum has declined precipitously, thanks to recycling programs. Glass
is down because o f recycling, light-weighting, and the major switch by beverage
bottlers from glass to plastic. Plastic packaging, despite that switch, and owing largely
to continuing efforts at light-weighting, has nevertheless held steady in its contribution
to solid waste.
The advent o f sophisticated packaging has, in addition to its other functions, also partly helped to decrease waste. The World Health Organisation estimates that in
Third World countries, 30-50 per cent o f food decays before it reaches the consumers. In contrast, only 2-3 per cent o f food in the developed world suffers the same fate (O’Hanlan, 1992). Pearce & Turner (1994) estimate that some 20-30 per cent o f cereals production, and up to 50 per cent o f vegetables, did not reach the consumer in the old Soviet Union, partly due to inefficient organisation o f transport, but also because o f poor protection in transit. They also estimate that in Brazil, 20 per cent o f rice output, 25 per cent o f flour output and 30 per cent o f beans are lost during warehousing, transport and sales, with a significant portion o f the blame falling on inadequate packaging. In a comprehensive study o f fresh household garbage from Mexico and the United States, the Garbage Project found that even after correcting for family size, U .S. households, on average, produce a third less garbage than do households in Mexico City (Rathje & Murphy, 1992). This appears to be explained by two facts; firstly, ‘in the United States, the skillful packaging o f food products markedly reduces the wastage o f foods’, and secondly, U .S. households rely, to a much greater extent, on processed foods, than Mexican households who buy a higher percentage o f fresh food.
Although consumers in the United States waste edible fresh produce at a rate ten times
greater than Mexicans do, their overall record on waste is better because o f their far
heavier reliance on processed, packaged foods, which is the food category that
generates by far the least amount o f waste.
Rathje & Murphy (1992)
In addition to the prevention o f food loss, packaging also serves a number o f other purposes. It insures the safety and hygiene o f food and drink, it protects people and the environment from hazardous materials, it allows the possibility o f self-service in shops and, in some instances, it increases profit by promoting and advertising the product.
packaging waste in a number o f countries may be misguided, after reflecting on the relative importance o f packaging vis à vis paper in the waste stream. In addition, reducing the quality and quantity o f packaging may, ironically, increase other types o f waste. This conclusion assumes that the evidence from landfill excavations carried out both in Arizona, and elsewhere in the United States, is representative.
1.2
THE MAIN ISSUES IN WASTE MANAGEMENT
The problem o f solid waste disposal, or solid waste management, can be divided into the following three cost categories:
a) environmental costs o f waste management; b) private costs o f waste management;
c) land scarcity.
1.2.1 Environmental Costs of Solid Waste Management
Landfill
neighbourhood was built on top o f what transpired to be a former dumping ground for toxic waste. This unfortunate occurrence only came to light when the residents began to experience deteriorating health.
The above discussion might convey the impression that such occurrences are only likely to arise in those cases where, either hazardous or industrial waste is involved, or, the co-disposal o f municipal and industrial waste has taken place. However, this is, unfortunately, not true. There are significant quantities o f hazardous materials present in municipal solid waste, as illustrated in the following excerpt from Rathje & Murphy (1992) (see also Reinhart, 1993):
In 1972, scientists Irom the Environmental Protection Agency conducted a study o f a
dump in Norman, Oklahoma, that had been placed on highly permeable ground in an
area where the water table was high. They discovered that a variety o f industrial
organic chemicals - ethyl carbonate, triethyl phosphate, dicyclohexyl phthalate, and a
number of other challenges to orthographic serenity - had begun to leach slowly into
nearby ground water. Further investigations revealed, however, that the source o f these
chemicals was not industrial waste: In its lifetime, the Norman dump had never
received any. The source must therefore be common commercial and household
products. Ethyl carbonate is a stabilizer and co-solvent for pesticides, fumigants, and
cosmetics. Triethyl phosphate is a plasticizer for resins, plastics, pesticides, solvents,
and lacquer remover. Dicyclohexyl phthalate is a plasticizer for rubber and polyvinyl
chloride.
Incineration
The rationale underlying the choice o f incineration for waste disposal is the attainment o f a reduction in the volume o f the waste, so the residue utilises less space in a landfill. The process is generally successful in its aim, as incinerator ash amounts to only 20-30 per cent by weight, and ten per cent, or less, by volume, o f the original waste*. In addition, the process can result in an useful by-product in the form o f power or heat, or some combination o f the two. However, the incineration
process can result in significant environmental air pollution. These pollutants include carbon dioxide, acidic pollutants, such as SO2, N0%, and particulates. These, either acting independently or synergistically, can lead to significant environmental damage to human health, crops, forests, buildings and eco-systems.
A second concern, possibly o f equal importance, relates to the emission o f dioxins from the incineration process, although this latter problem can be partially alleviated by maintaining the temperature at which the waste is burnt, at a very high, but stable, level. However, the attainment o f such an objective is costly, as it requires sophisticated technology and skilled personnel. Moreover, the heterogenous nature o f waste, together with seasonal influences, often leads to significant fluctuations in the moisture content o f the waste. This can undermine the attainment o f the desired stability in temperature. In the United Kingdom it was estimated that dioxins emitted from municipal incinerators contributed about a third o f the dioxins emitted to air from combustion sources, or about a fifth o f total man-made releases to the environment in 1989 (Royal Commission o f Environmental Pollution, 1993). However, it is expected that the new standards coming into effect at the end o f 1996 will result in a considerable reduction in dioxin emissions from incinerators. Thus it has been forecast that if the amounts o f waste being incinerated remains approximately the same, emissions o f dioxins from municipal incinerators will fall to less than two per cent o f the 1991 level (Royal Commission o f Environmental Pollution, 1993).
Recycling and Composting