DEVELOPMENT AND VALIDATION OF A NOVEL HPTLC METHOD FOR SIMULTANEOUS ESTIMATION OF EMBELIN AND CATECHIN
5
0
0
Full text
(2) Krishna R. Sharma et al. Int. Res. J. Pharm. 2016, 7 (8) development was carried out in 20 cm x 10 cm twin trough glass chamber (Camag, Muttenz, Switzerland) saturated with the mobile phase. The optimized chamber saturation time for mobile phase was 30 min at room temperature (25 0C ± 2) at relative humidity of 60% ± 5. The length of chromatogram run was 8 cm. Subsequent to the scanning, TLC plates were dried in a current of air with the help of an air dryer. Densitometric scanning was performed with Camag TLC scanner III in the reflectance-absorbance mode at 254 nm and operated by Win CATS software (1.3.0 Camag). Concentrations of the compound chromatographed were determined from the intensity of diffusely reflected light. Evaluation was carried out by comparing peak areas with linear regression. Standard Solutions Standard stock solutions (1 mg/mL) of reference catechin and embelin were prepared in methanol. Working solutions of catechin and embelin were prepared by appropriate dilutions of the stock solutions with methanol. All solutions were prepared freshly prior to analysis. Preparation of Sample Solutions Twenty tablets containing cashew leaves extract and amla fruit extract were powdered and 200 mg of powdered tablet was dissolved in 100 mL methanol. The solution was filtered and the filtrate was used for analysis. 1 gm of cream was suspended in 100 mL methanol. The suspension was sonicated for 30 min and then centrifuged for 15 min at 3000rpm. A constant application volume of 10.0 µL/spot was employed for all the sample solutions. Assay Validation The proposed HPTLC method was validated according to the International Conference on Harmonization guidelines.8-16 All measurements were performed in triplicates. Calibration studies. area versus concentration was subjected to least square linear regression analysis and the slope, intercept and correlation coefficient for the calibration curve were determined. LOD and LOQ were determined by using standard deviation method. Detection limit =3.3σ /S and quantitation limit=10 σ /S where σ is the residual standard deviation of a regression line and S is the slope of the calibration curve. Precision studies Precision of the method was evaluated by repeatability (intraday) and instrumental precision. Each level of precision was investigated by three sequential replicates of injections of catechin and embelin at concentrations of 150 ng/spot, 300 ng/spot and 450, 900 ng/spot respectively. Accuracy studies In order to evaluate the validity of the proposed method, accuracy of the method was determined the percentage recoveries of known amounts of mixture of catechin and embelin added to sample containing a mixture of all three standards. The analyzed samples were spiked with 80, 100 and 120 % of median concentrations (1500ng/spot catechin and 2000 ng/spot embelin) of standard solution in a solution containing the 100 % of respective concentration of two standards. Accuracy was calculated from the following equation: [Practical concentration/ theoretical concentration] × 100. Robustness For the determination of the robustness of method, chromatographic parameters, such as mobile phase composition and detection wavelength, were intentionally varied to determine their influence on the retention factor and quantitative analysis. The mobile phase composition was altered by ± 5 % changes in the composition of methanol. The two composition of ethyl acetate were tried 5.775 (+5% of 5.5) and 5.225 (-5% of 1.5) were tried. The chamber saturation time was altered from 15 min to 30 min.. Linearity was evaluated in the range of 500-2500 ng / spot and 1000-3000 ng / spot for catechin and embelin respectively. Peak Table 1: LOD and LOQ of both markers Markers Catechin Embelin. LOD 300 150 LOD : ng/spot. LOQ 900 450. Table 2.1: Results of Precision Studies of Catechin Type of Precision Sr. No Mean % RSD. Intra-day AUC for concentration of Catechin 1500 2000 2500 834.2 1107.54 1405.12 0.19 0.26 0.74 AUC concentration of Catechin. Inter-day AUC for concentration of Catechin 1500 2000 2500 750.1 1204.10 1511.02 0.64 0.58 0.32 : ng/spot. Table 2.2: Results of Precision Studies of Embelin Type of Precision Sr. No Mean % RSD. Intra-day Inter-day AUC for concentration of Embelin AUC for concentration of Embelin 1000 1500 2000 1000 1500 2000 1395.42 1980.15 2599.01 1379.89 1983.80 2564.17 0.89 0.76 0.44 0.78 0.42 0.70 AUC concentration of Embelin : ng/spot. 80.
(3) Krishna R. Sharma et al. Int. Res. J. Pharm. 2016, 7 (8) Table 3.1: Recovery studies of Catechin In 2000 ng Catechin In sample 939.09 1117.01 1302.1. 1600 (80%) 2000 (100%) 2400 (120%). Mean AUC of catechin In standard In spiked samples 986.25 2025.04 1120.52 2156.71 1314.01 2616.01. Recovery ± S.D. (%) 105.17 ± 0.91 96.38 ± 0.75 95.60 ± 0.66. Table 3.2: Recovery studies of Embelin In 2000 ng Embelin In sample 1579.08 1900.25 2399.01. 1200 (80%) 1500 (100%) 1800 (120%). AUC of embelin In standard In spiked samples 1602.11 3204.67 1955.14 3855.39 2487.20 4626.77. Recovery ± S.D. (%) 100.74 ± 1.11 94.72 ± 0.95 96.24 ± 1.07. Table 4.1: Robustness (Mobile phase variation) studies of Catechin Sr. No 1. 2. 3. 4. S.D. Mobile phase composition Ethyl acetate Formic acid 5.5 0.5 5.5 0.5 5.775 0.5 5.225 0.5 Mobile phase composition : v/v. Toluene 4.2 3.8 4 4 -. Rf. AUC. 0.59 0.59 0.59 0.59 0.0. 1142.05 ± 0.11 1142.15 ± 0.27 1140.07 ± 0.74 1142.01 ±0.38 1.00. Table 4.2: Robustness (Chamber saturation time) studies of Catechin Sr. No 1. 2. 3. 4. S.D.. Chamber saturation time 15 20 25 30 Chamber saturation time: min. Rf 0.59 0.59 0.59 0.59 0.0. AUC 1145.11 ± 0.11 1142.99 ± 0.27 1143.77 ± 0.74 1141.52 ±0.38 1.5. Table 4.3: Robustness (Mobile phase variation) studies of Embelin Sr.No . 1. 2. 3. 4. S.D. Mobile phase composition Methanol Formic acid 5.5 0.5 5.5 0.5 1.625 0.5 1.375 0.5 Mobile phase composition : v/v. Toluene 4.2 3.8 4 4 -. Rf. AUC. 0.39 0.39 0.39 0.39 0.0. 1987.11 ± 0.28 1984.99 ± 0.58 1989.58 ± 0.42 1986.88 ± 0.63 1.88. Table 4.4: Robustness (Chamber saturation time) studies of Embelin Sr. No. 1. 2. 3. 4. S.D.. Chamber saturation time 15 20 25 30 Chamber saturation time : min. Rf 0.12 0.12 0.12 0.12 0.0. AUC 1985.71 ± .36 1988.32 ± .52 1985.08 ±0.47 1987.11 ± 0.22 1.45. Table 5: Stability Studies of solution containing two markers Temperature. Marker compounds 24 h 98.97 97.68. Catechin Embelin. 4 °C 48 h 98.57 98.91. 72 h 98.19 98.48. 24 h 98.17 99.04. 25 °C 48 h 97.77 98.74. 72 h 97.41 98.23. Table 6: Percent Content of Catechin and Embelin in in-house formulations containing cashew leaves and Amla fruit powder Percent Content ± S.D. (%). Extract & Formulation Tablet Cream. Catechin 00.574±0.24 00.412 ±0.11. Embelin 00.314 ±0.19 00.298 ±0.21. 81.
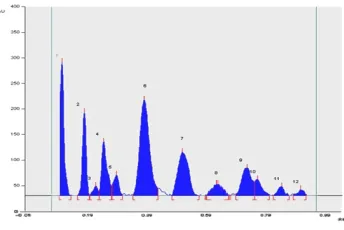
(4) Krishna R. Sharma et al. Int. Res. J. Pharm. 2016, 7 (8). Figure 1: HPTLC profile of standard Embelin and Catechin. Figure 2: Linearity graph of Standard Catechin. Figure 4: HPTLC profile of in-house tablet formulation. RESULTS AND DISCUSSION Method Optimization The proposed method gave very good separation and resolution of all the two markers as indicated in Table 1 and Figure 1. Method Validation Linearity, limit of detection and quantitation Under the above described experimental conditions, linear correlation between the peak area and applied concentration was. Figure 3: Linearity graph of standard Embelin. Figure 5: HPTLC profile of in-house cream formulation. found to occur in the concentration range of 84-504 ng ml-1 for kaempferol, 168-1008 ng ml-1 for rutin, and 800 -1800 ng ml-1 for quercetin. The correlation coefficient of kaempferol, rutin and quercetin was found to be 0.9997, 0.9998 and 0.9998 respectively. The peak area (y) is proportional to the concentration of respective marker and the regression equations as following: For Catechin, y =0.7232x + 11 (Figure 2) For Embelin, y = 0.1542x (Figure 3) The experimentally derived LOD and LOQ for all three markers were determined as mentioned in Table 1.. 82.
(5) Krishna R. Sharma et al. Int. Res. J. Pharm. 2016, 7 (8) Precision Precision data on repeatability (intra-day) and instrumental variation for three different concentration levels are summarized in Table 2.1 and Table 2.2. Precision studies showed R.S.D. less than 1%, indicating a good precision Accuracy The sample containing 1500ng/spot catechin and 2000 ng/spot embelin were spiked with the known amount of standard, and the percent ratios between the recovered and expected concentrations were calculated. Recoveries were obtained in the range of 95.86-99.24% and 97.25-98.12 %, depicting the HPTLC proposed method for simultaneous estimation is accurate for the quantification of two marker compounds. (Table 3.1 and Table 3.2) Robustness No changes were observed in retention time and peak shape of both the markers with the changes made with mobile phase and chamber saturation time (Table 4.1, Table 4.2, Table 4.3, Table 4.4 and Table 5). The resolution and the separation of markers were also unaltered Analysis of in-housed formulations containing cashew leaves and amla fruit Validated method was applied to standardization for both the inhouse formulations. The shape of the peaks was not altered by other substances present in the matrix. The developed and validated HPTLC method gave well resolved peaks of two respective markers in both the formulations (Figure 4 and 5). The percent content of catechin and embelin in two products each of two plants are indicated in Table 6. The content of each marker is also calculated for per unit of each dosage form. CONCLUSION The rapid, simple, precise, accurate and reproducible HPTLC method was successfully developed and validated for simultaneous analysis of both marker compounds in two different plant products. The other ingredients of each product did not affect the analysis. Thus, this method can be applied for a wide range for plant based medicines ranging from traditional to modern dosage form. Thus application of this method commercially can uplift the global acceptance of traditional systems medicine of India. ACKNOWLEDGEMENTS We like to acknowledge instrumentation facilities provided by Dr. Vikram Naharwar, Amsar Goa. pvt. Ltd. Goa. REFERENCES 1. Supriya, S. J., Pratima, A.T., Satish, Y.G., Simultaneous estimation of kaempferol, rutin and quercetin in various plant products containing bhuiamla and amla. J. Planar. Chromatogr 2014; - Mod. TLC. Vol.27 (4), 267-273.. 2. Supriya, J., Satish.Y.G., Pratima T., Marker based standardisation of plant based formulations containing brahmi using bacoside a by HPTLC.international journal of pharma and pharmaceutical sciences. 2014; 6 (1), 202-207. 3. Supriya, J., Satish.Y.G., Pratima T., Marker Based Standardization Of Formulations Containing Ashwagandha Using Withaferin A By HPLC.world journal of pharmacy and pharmaceutical sciences. 2014; 3(1), 441-451. 4. Supriya, S. J., Pratima, A.T., and Satish, Y.G., Development And Validation Of A Novel HPTLC Method For Simultaneous Estimation Of Beta-sitosterol-D-glucoside And Withaferin A international journal of pharmacy and pharmaceutical sciences. 2011; 3 (2), 227-230. 5. Supriya, S.J., Pratima, A.T., Satish, Y.G. Marker based standardization of commercial formulations and extracts containing beta-sitosterol D-glucoside using HPTLC. Int. J. Res. Ayurveda Pharm. 2010; 1 (2): 616-623. 6. R.J., J.P.K., T.M., Free radical scavenging reactions and antioxidant activity of embelin: Biochemical and pulse radiolytic studies Chemico-Biological Interactions 2007; 167, 125-34. 7. J. V. H., B. Frei. “Tea catechins and polyphenols: health effects, metabolism, and antioxidant functions,” Critical Reviews in Food Science and Nutrition, vol. 43, no.1, 2003; 89–144. 8. British Pharmacopoeia, International edn, Vol. II, HMSO, Cambridge; Appendix 112, IB 2002. 9. E. Heftman, Chromatography – Fundamentals and Applications of Chromatography and Related Differential Migration Methods, Vol. 69A, 6th edn, Amsterdam: Elsevier 2004; 253–291. 10. ICH/CPMP guidelines Q2A, Text on Validation of Analytical Procedures, (1994). 11. ICH/CPMP Guidelines Q2B, Validation of Analytical Procedures – Methodology, (1996). 12. J. Cazes, R. P. W. Scott. Chromatography Theory, NY: Marcel Decker 2002; 443-454. 13. P. D. S. HPTLC: Quantitative Analysis of Pharmaceutical Formulations, New Delhi: CBS Publications 1996; 162–165. 14. R. P. W. Scott, Encyclopedia of Chromatography, 10th edn, USA: Marcel Dekker 2001; 252–254. 15. Reviewer Guidance, Validation of Chromatographic Methods 1994. 16. USP 23, NF 19, Asian edn, United States Pharmacopeial Convention, Rockville, M.D., 982, 1225. 17. Shelke O.S., Sable K. S., Neharkar V.S., Mathdevru B. V., Development And Validation of a UV spectrometric method for simultaneous determination of Nifedipine and Atenolol in combined dosage form, Int. Res. J. Pharm. 2012;3(4):360-364. Cite this article as: Krishna R. Sharma, Rutuja G. Rahate, Tejaswi P. Chalke and Supriya S. Jirge. Development and validation of a novel HPTLC method for simultaneous estimation of embelin and catechin. Int. Res. J. Pharm. 2016;7(8):79-83 http://dx.doi.org/10.7897/ 2230-8407.078101. Source of support: Nil, Conflict of interest: None Declared Disclaimer: IRJP is solely owned by Moksha Publishing House - A non-profit publishing house, dedicated to publish quality research, while every effort has been taken to verify the accuracy of the content published in our Journal. IRJP cannot accept any responsibility or liability for the site content and articles published. The views expressed in articles by our contributing authors are not necessarily those of IRJP editor or editorial board members.. 83.
(6)
Figure
Related documents
(At that time, significant parts of the socialist movement were anti-militaristic, holding that war was an integral part of capitalism.) Although most people believed these objectors
We are focusing in this sections on the different ways we can create links of social networks directly derived from the analysis of the video data.. Most of the following networks
Summary: This paper proposes that ethics education has a new contribution to make, in supporting and promoting ethical practice – as it is defined in and by the everyday actions
Shanley LJ, Irving AJ, Harvey J (2001) Leptin Enhances NMDA Receptor Function and Modulates Hippocampal Synaptic Plasticity. Shanley LJ, Irving AJ, Rae MG, Ashford
Expression level of vascular endothelial growth factor receptor-2 in radical nephrec- tomy specimens as a prognostic predictor in patients with metastatic renal cell carcinoma
Same- nested PCR amplification with a pair of borrelial genus- specific primers, followed by direct Sanger sequencing of the nested PCR amplicon using the M2 primer as
have an effect on school counselors’ preparedness with legal and ethical issues (subscale.. 2 subscale 3, and total score). Accordingly, the results are inconsistent
Histamine-releasing factor/translationally controlled tumor protein (HRF/TCTP)-induced histamine release is enhanced with SHIP-1 knockdown in cultured human mast cell and
