Performance of Cassava Starch as a Proton
Exchange Membrane in a Dual Chambered
Microbial Fuel Cell.
Livinus A. Obasi, Charles C. Opara and Akuma Oji .
Department Of Chemical Engineering, University Of Port Harcourt, Choba, PMB 5323, Port Harcourt, Nigeria.
ABSTRACT: This research work shows the feasibility of power generation in a mediatorless dual chambered microbial fuel cell, utilizing cassava starch as the proton exchange membrane (PEM). The study employed swine house effluent (a serious environmental threat) as the substrate (fuel) (pH, 7.2, BOD: 1200mg/l, COD: 3800mg/l) in the anode chamber prepared with a phosphate buffer solution (K2HPO4+KH2PO4), potassium ferry cyanide solution served as the oxygen acceptor in the cathode
chamber using graphite electrodes, the cell operating at room temperature (27
±
30C). The PEM(gelatinized cassava starch) was prepared with varying degrees of modifications for three cells, ranging from the untreated pure starch (A), starch treated with 5.9% sodium chloride (B) and starch modified with sodium alginate (a gum) and activated carbon (C). The open circuit voltages (OCV) and power performances of the three cells were monitored for ten days. Each of the cells was inoculated with the adopted consortium in soil solution obtained from mangrove forest. The maximum power outputs from the cells were 945.69mW/m2, 1068.54 mW/m2 and 570.83 mW/m2 for A, B and C respectively.
Keywords: Bioelectricity; Cassava starch; Coulombic efficiency; Microbial fuel cell; mediator less.
INTRODUCTION
The two major challenges facing the world today are the growing demand for energy and ecologically and environmentally sound methods of waste disposal. These challenges were occasioned by rapid population growth and cumulative industrialization processes. The novel technological approach to facilitate direct conversion of waste water into usable energy is the microbial fuel cell (Barron et al., 2010).
Over the years, electrical energy has been generated by hydro, wind, nuclear, thermal and electromagnetic induction powered by fossil fuels in generators. Green house gases such as oxides of carbon and nitrogen emanating from the operations of these energy sources attack the ozone layer thereby exposing the biomass to hazardous ultraviolet radiation which by implication may ultimately lead to the much dreaded global warming. MFC, being a bi-functional device, has a great potential to offer solution to this global concern as its operation greatly enhances environmental benefits (Pant et al., 2009, Chai et al., 2010). This feat in biotechnology not only produces ‘green energy’ for the world energy augmentation but also simultaneously treats the organic wastewater hence saving the environment from perpetual degradation (Liu and Logan, 2004). MFC consists of anode and cathode chambers separated by a proton (ion) exchange membrane (PEM) (Liu et al., 2005; Pant et al., 2009; Strik et al., 2008). These chambers basically require two electrodes for power generation: the anode
activity of the bacteria in the cell (Scott and Murano, 2007). This tendency often limits the commercial application potential of the MFC.
The electrons thus produced are transferred to the cathode via external circuit while the protons are transferred internally through the PEM. The cathode chamber being fully aerated contains an oxidizing agent which supplies the oxygen that eventually combines with the proton and electrons to form water (Mathuriya and Sharma, 2009).
Recently, a number of bacteria have been isolated based on their ability to transfer electrons to the anode. In mediatorless MFCs, such bacteria may include: shewanella putrefaciens, Geobacter Sulphureduciens, Geobacter metallireduciens Rhodoferax ferrireduciens and Anaeromonas hydrophilla (Liu et al., 2005). The use of these bacteria has rendered the use of mediators unnecessary thus increasing the commercial application potential of the MFC.
In addition to the microorganisms that can transfer electrons to the anode, the presence of other organisms appear to benefit MFC performance as MFCs operated using mixed cultures gave substantially greater power densities than those with pure cultures (Rabaey et al., 2004). Mixed cultures have been found more suitable for water treatment, as single organism metabolizes quite limited organic compounds and this limits the power density output (Kim et al., 2002; Das and Mangwani, 2010). Other factors that affect power density in MFCs include: the efficiencies of the anode and cathode as a measure of their electrode potentials, the presence of the competing electron acceptors and the microbial composition of the electrophilic community at the anode (Scott and Murano, 2007).
In this research a dual chamber MFC was used to investigate the performance of native cassava starch when used as a PEM. The overall cost of the cell has been reduced and its power performance enhanced by the use this cheaply available material as the cation exchange membrane. This serves as a preferred alternative to Agar in plant tissue culture and Nafion in terms of cost. The starch was applied either alone or in combination with other materials (Sharif et al., 2010). The substrate (fuel) used was the swine house effluent treated with a phosphate buffer solution while potassium ferry cyanide was used as the catholyte.
This research work was successfully carried out at the Chemical Engineering Laboratory of the University of Port Harcourt, Choba, Port Harcourt, Rivers State Nigeria, July, 2011.
MATERIALS AND METHODS:
The native starch used for the experiment was obtained from cassava roots, an improved variety (low cyanide high yield), aged fourteen months at harvest time uprooted from a sandy soil farm located behind Federal Polytechnic Ekowe liason office in Yenagoa, Bayelsa state, Nigeria. The cathode and anode were the graphite rods extracted from 1.5 volts dry cells thetips of which had been soldered to copper wires (Barua and Deka, 2010). The cathode and anode chambers were plastic cans, 1.55 liters each, PVC plastic pipe was used for the proton exchange membrane casing, while swine house effluent (fecal matter) collected from Concordial farm Barariya, Norwa Road Tai L. G.A, Rivers State of Nigeria served as the substrate (fuel). The organic waste was treated with phosphate buffer solution to stabilize the operating pH in the anode chamber.
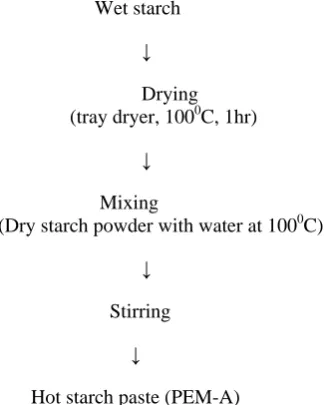
PREPARATION OF STARCH FOR PEMS
Wet starch
↓
Drying (tray dryer, 1000C, 1hr)
↓
Mixing (Dry starch powder with water at 1000C)
↓
Stirring ↓
Hot starch paste (PEM-A)
Figure 1: Flow chart for the preparation of pure starch PEM.
PEM-B: 85.0g of dry starch was mixed with 75.0cm3 of distilled water and heated to a temperature of 80 – 1000C for 30 minutes with continuous stirring. 5g of dry sodium chloride was then added and the stirring continued for another 5 minutes to ensure proper mixing. The added sodium chloride was aimed at improving the electrical conductivity of the starch. The hot gel was immediately charged into a 1 inch diameter PVC pipe, 14.5 cm long, and allowed to cool and set. PEM-B was then ready for use in MFC-B.
Wet starch
↓ Drying
(tray dryer set at 1000C, 1Hr)
↓ Mixing (Dry starch + water at boiling point)
↓
Stirring (Add 5.0g of dry NaCl)
↓ Hot salinized starch paste
(Ready for used as PEM-B)
Figure 2: Flow chart for the preparation of salinized starch PEM-B.
PEM-C: 170g of dry native cassava starch powder was weighed out using top loading digital balance and mixed with 150cm3 of distilled water in a vessel. 5cm3 of 0.5M NaOH and 25cm3 of 2.5M CaCl2 solutions were added to 10g of sodium alginate (NaC6H7O6)n powder in a beaker and stirred thoroughly to obtain a voluminous gelatinous precipitate. The mixture was then carefully poured into the vessel containing a mixture of starch and water and the entire system whirled several times to ensure proper mixing. The system was then heated for 10 minutes while vigorous stirring continued until a homogenous jelly, soft paste was obtained. This hot modified starch was immediately charged into a 14 cm long PVC pipe and allowed to cool and get fitted to the inner wall of the pipe. The PEM-C was then ready for use in MFC
PREPARATION OF THE ANOLYTE: The anaerobic anode compartment was swine house effluent inoculated with 5cm3 consortium solution from mangrove forest at ambient temperature (27±30C) (Ahn and Logan, 2010). 275g of the substance was measured out using the top loading digital balance and mixed with 1550cm3 of buffer solution and sealed properly. The mixture was thoroughly stirred to form homogeneous slurry, maintained at a constant pHof 7.2 as determined using the Hanna pH meter. The concentration of the substrate was 177.4 gdm-3 buffer solution. The buffer solution was a mixture of 4.6g/dm3 di-potassium hydrogen hotophoshphate (K2HPO4) solution (base) and 2.70g/dm3 of potassium di-hydrogen hotophosphate (KH2PO4) solution (acid), 1550cm3 each. The environmental inoculum was used to seed the MFC (Franks and Nevin, 2010).
The anode chamber was covered with a lid and sealed properly with epoxy steel gum in order to prevent atmospheric oxygen from entering the chamber. The bacteria hence functioned in an absolutely anaerobic condition.
PREPARATION OF THE CATHOLYTE. The catholyte is a solution containing 32.93g/dm3 of potassium ferry cyanide, (K3Fe(CN)6) solution, a conductive material. This was charged into the fully aerated cathode chamber.
Alternatively, the cathode can also contain air, in which case oxygen is the oxidant (Schwartz, 2008).
CELL TEST PROCEDURE: The cells were monitored simultaneously for a period of 10 days during which the open circuit voltages (OCV) (potentials) were measured day after day. Each of the 24 hourly readings was taken when the OCV became stable. The current and voltage values were measured using a digital multimeter (DT-830).
The derived readings of current and power densities and coulombic efficiencies were determined by applying the experimental data on the applicable equations. The data were also analyzed graphically by plots of against time to obtain the cell performance and polarization curves
ANALYTICAL CALCULATIONS: The values of currents and voltages were converted to power density P (mW/m2) according to the equation, P=IV/A, where I (A) is the current, V (v) is the voltage, and A (m2) the surface area of the projected anode. Current density (mA/m2) was calculated by dividing the current obtained by the surface area of the projected anode.
Power density as expressed was normalized to the projected surface area of the graphite anode (m2). Power density P was analyzed according to Equation (1) (Rabaey and Verstraete, 2003).
)
(
)
(
)
(
2m
anode
projected
of
area
Surface
v
Volts
mA
Current
P
=
×
(1)And current density C, expressed as (V/RA) (Wang et al., 2008) which produces the equation
( )
( )
2m
anode
projected
of
area
Surface
mA
produced
Current
C
=
(2)Where V= voltage, R= resistance (load) and A= surface area of the projected anode. The coulombic efficiencies were calculated using the Equations 3 and 4 (Liu et al., 2005):
%
100
×
=
n p cC
C
E
(3)Where Cp = total coulomb calculated by integrating the current over time, Cn = theoretical amount of coulombs that can be produced from the cell.
i iv i n
M
S
Fb
Where F= Faraday’s constant (96485 Coulombs/mol-electron), bi=moles of electrons/mole of substrate, Si= substrate concentration and Mi= molecular weight of the substrate (basically carbohydrate).
The pH, BOD and COD were determined at the commencement of operation of the cell using standard methods.
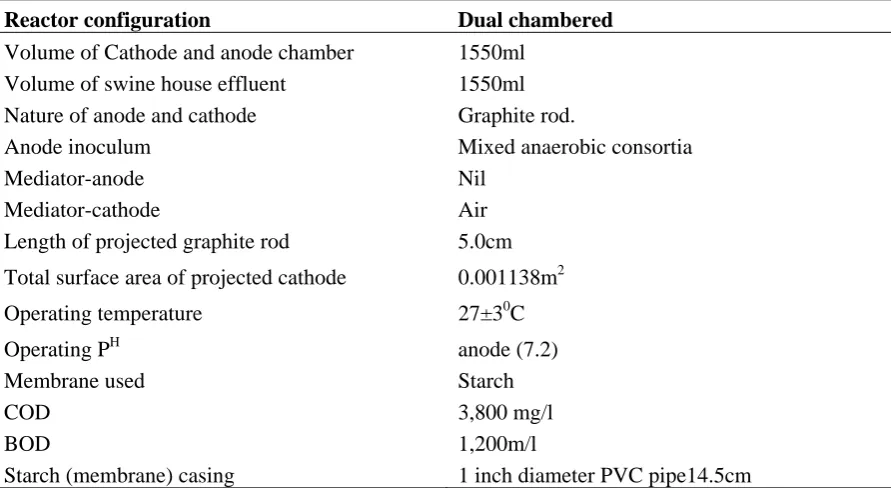
Table 1: Design Criteria for a dual-chambered microbial fuel cell.
Reactor configuration Dual chambered
Volume of Cathode and anode chamber 1550ml
Volume of swine house effluent 1550ml
Nature of anode and cathode Graphite rod.
Anode inoculum Mixed anaerobic consortia
Mediator-anode Nil Mediator-cathode Air
Length of projected graphite rod 5.0cm
Total surface area of projected cathode 0.001138m2
Operating temperature 27±30C
Operating PH anode (7.2)
Membrane used Starch
COD 3,800 mg/l
BOD 1,200m/l
Starch (membrane) casing 1 inch diameter PVC pipe14.5cm
RESULTS AND DISCUSSIONS:
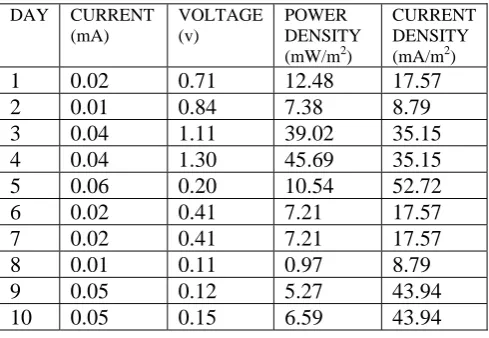
Table 2: Experimental Data for MFC-B with pure satrch starch PEM
DAY CURRENT (mA)
VOLTAGE (v)
POWER DENSITY (mW/m2)
CURRENT DENSITY (mA/m2)
1 0.02 0.71 12.48 17.57
2 0.01 0.84 7.38 8.79
3 0.04 1.11 39.02 35.15
4 0.04 1.30 45.69 35.15
5 0.06 0.20 10.54 52.72
6 0.02 0.41 7.21 17.57
7 0.02 0.41 7.21 17.57
8 0.01 0.11 0.97 8.79
9 0.05 0.12 5.27 43.94
10 0.05 0.15 6.59 43.94
Figure 4b: Power density and Current density against Voltage for a dual-chambered MFC-A with pure starch PEM-A over 10-day period.
Figure 4C: Voltage and Power Density for a dual-chambered MFC-B with pure starch PEM over 10-day period.
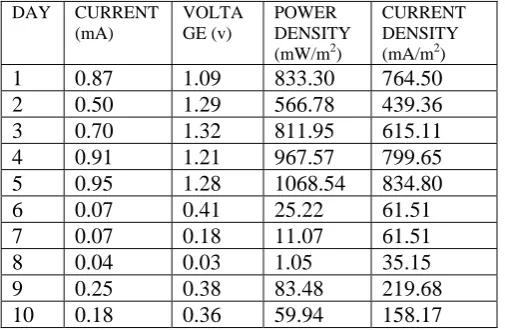
Table 3: Experimental Data for MFC-B with salinized starch PEM
DAY CURRENT (mA)
VOLTA GE (v)
POWER DENSITY (mW/m2)
CURRENT DENSITY (mA/m2) 1 0.87 1.09 833.30 764.50 2 0.50 1.29 566.78 439.36 3 0.70 1.32 811.95 615.11 4 0.91 1.21 967.57 799.65
5 0.95 1.28 1068.54 834.80
6 0.07 0.41 25.22 61.51 7 0.07 0.18 11.07 61.51
8 0.04 0.03 1.05 35.15
9 0.25 0.38 83.48 219.68
10 0.18 0.36 59.94 158.17
Cell with Pure Starch PEM
0 0.2 0.4 0.6 0.8 1 1.2 1.4
1 2 3 4 5 6 7 8 9 10
TIME (DAYS) Voltage (volts)
0 10 20 30 40 50
Power Density (mW/m2) VOLTAGE(V)
POWER DENSITY(mW/m2)
Cell with pure starch PEM
0 10 20 30 40 50
1 2 3 4 5 6 7 8 9 10
Voltage (volts) Power Density
(mA/m2)
0 10 20 30 40 50
60Current Density (mA/m2)
Figure 5a: Voltage and Current against Time (Days) for a dual-chambered MFC-B with salinized starch PEM-B.
Figure 5b: Power density and current density against voltage for a dual-chambered MFC-B with salinized starch PEM-B over 10-day period.
Figure 5C: Voltage and Power density against Time (days) for a dual-chambered MFC-B with salinized PEM over 10-day period.
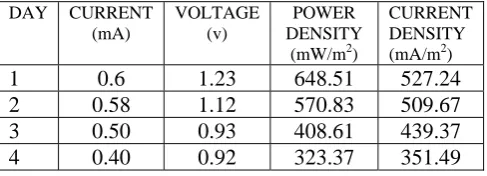
Table 4: Experimental Data for MFC-C with alginate-modified starch PEM
DAY CURRENT (mA) VOLTAGE (v) POWER DENSITY
(mW/m2)
CURRENT DENSITY (mA/m2)
1 0.6 1.23 648.51 527.24
2 0.58 1.12 570.83 509.67
3 0.50 0.93 408.61 439.37
4 0.40 0.92 323.37 351.49
Cell with Salinized starch PEM
0 200 400 600 800 1000 1200
1 2 3 4 5 6 7 8 9 10
Voltage (volts) Power Density (mW/m2) 0 100 200 300 400 500 600 700 800 900 Current Density (mA/m2) POWER DENSITY(mW/m2) CURRENT DENSITY(mA/m2)
Cell with salinized starch PEM
0 0.2 0.4 0.6 0.8 1 1.2 1.4
1 2 3 4 5 6 7 8 9 10
Time (Days) Voltage (volts) 0 0.2 0.4 0.6 0.8 1 Current (mA) VOLTAGE (v) CURRENT (mA)
Cell with salinized starch PEM
0 0.2 0.4 0.6 0.8 1 1.2 1.4
1 2 3 4 5 6 7 8 9 10
Time (Days) Voltage (volts) 0 200 400 600 800 1000 1200 Power Density
5 0.23 0.75 151.58 202.11
6 0.25 0.77 125.22 219.68
7 0.07 0.79 48.59 61.51
8 0.05 0.77 47.36 61.51
9 0.06 0.75 32.95 43.94
10 0.04 0.71 24.96 35.15
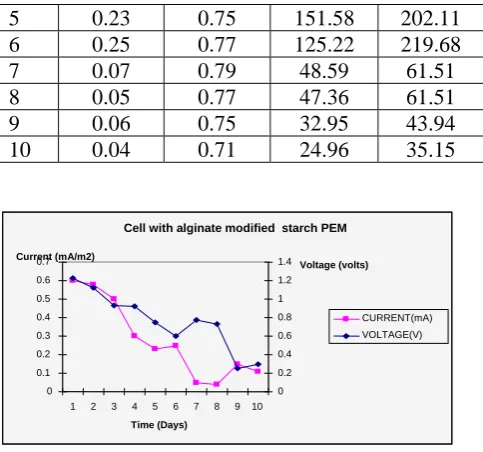
Figure 6a: Current and Voltage against Time (days) for a dual-chambered MFC-C with modified starch (PEM-C) over 10-day period.
Figure 6b: Power density and Current density against voltage for a dual-chambered MFC-C with modified starch (PEM-C) over 10-day period.
Figure 6C: Voltage and Power Density against Time (Days) for a dual-chambered MFC-C with modified starch PEM-C over 10-day period.
MFC-A: Figure (4a, b and c) above show the mode of current generation in MFC-A in which pure starch PEM-A was applied. The values of current showed a sharp decrease from 0.02mPEM-A initial value to 0.01mPEM-A on the second day with increased voltage value. This may be as a result of the low initial proton conductivity of the
Cell with alginate modified starch PEM
0 0.2 0.4 0.6 0.8 1 1.2 1.4
1 2 3 4 5 6 7 8 9 10
Time (Days) Voltage (volts) 0 100 200 300 400 500 600 700 Power Density (mW/m2) VOLTAGE(V) POWER DENSITY(mW/m2)
Cell with alginate modified starch PEM
0 100 200 300 400 500 600 700
1 2 3 4 5 6 7 8 9 10
Voltage (volts) Power Density (mW/m2) 0 100 200 300 400 500 600 Current Density (mA/m2)POWER DENSITY(mW/m2) CURRENT DENSITY(mA/m2)
Cell with alginate modified starch PEM
0 0.1 0.2 0.3 0.4 0.5 0.6 0.7
1 2 3 4 5 6 7 8 9 10 Time (Days) Current (mA/m2) 0 0.2 0.4 0.6 0.8 1 1.2
1.4 Voltage (volts)
starch due to high initial rate of water absorption causing attendant swelling and increased impedance. This had a corresponding negative effect on the rate of electron transport across the biofilm. The value of current thereafter increased until maximum value of 0.06mA was recorded on the 5th day with corresponding voltage value of 0.2volts. The increase in current and decrease in voltage resulted from low internal resistance in the cell. The low internal resistance and improvement in power density may be as a result of the effect of ferry cyanide solution as electron acceptor instead of oxygen (Rabaey et al; 2004; Rabaey et al; 2003). Potassium permanganate solution also produces a similar effect (Momoh and Neayor, 2010).
The voltage drop continued possibly due to attendant decrease in the rate of biodegradation of the substrate by the bacteria with time coupled with lack of enduring viscosity and stability of the starch PEM. Native starch generally has low viscosity (392.33 RVU) with high set back viscosity (66.58 RVU) (Daramola and Osanynlusi, 2006). The rate of power generation dropped gradually after some time but however increased sharply on the 8th day to 0.05mA. This may be as a result of the eventual growth and multiplication of the microorganisms with corresponding increased oxidative activity. The peak current and power densities of the fuel cell were 52.72 mA/m2 and 45.69mW/m2 respectively while the maximum voltage obtained was 1.30 volts.
The non-linear relationship between current and voltage produced could have been due to unsteady rate of microbial activity. This is often part of the reason while the operations of MFCs do not obey Ohm’s law (Ohm’s law draws a direct relationship between current and voltage at constant electrical resistance).
Besides, the rate of potential development in MFC is directly related to the concentration of the electrochemically active microorganism (Kim et al., 2002). The rate of oxidative activity of these organisms is not constant due to the effect of an amount of internal resistance in the system.
As can be observed in Figure (4b), the power density, which is a measure of the amounts of voltage and current produced per unit surface area of the projected anode, increased as the current and voltage values increased up to a maximum value of 45.69mW/m2 at 1.30 volts and 0.04mA voltage and current values respectively. The maximum current density obtained was 52.72mA/m2 and minimum of 17.57mA/m2.
MFC-B: In this phase of the experimentation process, the PEM-B component of the MFC was varied by using a cassava starch treated with 5.9% NaCl. Sodium chloride was considered on the basis of the fact that being a strong electrolyte it imparts higher electrical conductivity potential on the starch.
In accordance with our expectation, the MFC-B showed an improved power generation compared with the MFC-A with pure starch PEM. On the first day, the multimeter read a voltage of 1.09volts which increased to a maximum of 1.32volts on the 3rd day (Figure 5a, b and c). The voltage produced decreased from the 4th day gradually from 1.21 volts to 0.03 volts recorded on the 7th day. This voltage drop may have resulted from gradual decrease in the strength and viscosity of the starch due to presence of NaCl which affected the intermolecular forces between the starch molecules.
This effect of addition of sodium chloride could be removed via modification of the starch with a substance which could impart lasting strength and viscosity to it in order to improve the efficiency and ultimately prolong the life of the cell. The maximum current density, power density and voltage recorded were 834.80mA/m2 1068.54mW/m2 and 1.32 voltsrespectively.
MFC-C: For the third phase of the experimentation, the PEM-C component of the MFC-C was made by
modifying the starch with sodium alginate powder and treated with activated carbon and 5cm3 2.5M calcium chloride solution in 0.5M sodium hydroxide solution. The sodium alginate (NaC6H7O6)n imparted lasting viscosity and stability to the starch while CaCl2 enhanced its proton conductivity. This modification was aimed at improving the PEM performance as far as possible. In the MFC-C under analysis, an improved voltage production was observed at the first day (1.23 volts) and current of 0.6mA, (Figure 6a, b and c), which gave a maximum power density of 648.51W/m2. The set-up was consistently monitored for 10 days. A gradual and steady drop in current and voltage by the day was observed, with the least values recorded on the 10th day, 0.04mA and 0.71volts respectively. These gave the current and power densities to the tune of 24.96mW/m2 and 35.15mA/m2. The maximum current density of 527.24mA/m2 was recorded on the 1st day with a corresponding power density of 648.51mW/m2 and peak voltage value of 1.23 volts, while minimum values recorded on the tenth day.
starch imparted by the salt, compared to that of MFC-A with low power output resulting from relatively high impedance of the pure starch. Comparing the three systems together, it was observed that the rate of polarization of MFC-C (with alginated-modified starch PEM) was relatively low and highest in MFC-A. This indicates that the sodium alginate imparted improved stability, viscosity and decreased retrogradability tendency on the starch and hence produced sustainable voltage output. The maximum power output from these cells however falls below the maximum value of 3600mW/m2 recorded in literature (Liu and Logan , 2004) from a mediatored MFC,
Swine house effluent waste was considered for utilization in the experiments owing to the fact that it contains a highly propagative concentration of micronutrients essential for the survival and growth of bacteria.
The advantage of using the alginate-modified starch PEM in MFC-C is the sustainability of relatively high amount of voltage over time with gradual linear drop, which therefore guarantees longer duration of cell performance during application.
COULOMBIC EFFICIENCY: The coulombic efficiency of a cell indicates a measure of electron recovery from the cell. It is also described as the percentage of total charge transferred to the anode surface over the maximum charge extractable upon complete oxidation of the substrate to electricity (Kassongo and Togo, 2010). The coulombic efficiencies of the cells using swine waste house effluent were 8.70% for the MFC-A with PEM made of pure starch only; 18.68% for MFC-B with salinized starch PEM and 8.90% for MFC-C with sodium alginate modified starch PEM. The heist value of coulombic efficiency obtained in MFC-B shows the greater possibility of proton conductivity of cassava starch when treated with sodium chloride.
The columbic efficiency is dependent in part on the microorganism that are carrying out the oxidation (Franks and Nevin, 2010); and also on the proton conductivity performance of the PEM.
CONCLUSION. This research work investigated the performance of cassava starch as a proton exchange membrane in a mediator-less microbial fuel cell, MFC, with (aerated cathode and anaerobic anode (pH of 7.2) using swine house effluent as the substrate (fuel). The modification processes of the starch showed significant improvement in the overall performance of the cell with respect to power generation. Even though the maximum power density of 1068.54mW/m2 generated in the experiment was less than the maximum value achieved previously as recorded in literature, 3600mW/m2, from a MFC involving a mediator, the process involved low cost materials with uncoated electrodes assembled in an environmentally safe manner. Furthermore, the operation of the cell involved power generation along side effluent water treatment. Hence, the feasibility of successful operation of MFC using cassava starch (low relative cost) PEM is an attractive one as such would significantly increase the commercial application potential of MFCs.
AKNOWLEDGEMENT. We are sincerely grateful to the management of University of Port Harcourt, Choba, Rivers State, Nigeria for providing the laboratory facilities and equipment which assisted this research work.
REFERENCES
[1] Ahn Y. and Logan B.E, (2010); “Effectiveness of wastewater treatment using microbial fuel cell at ambient and mesophilic temperatures.”; Bioresource Technology 101 (2010) 469-475.
[2] Barron B, Rosenbaum M, Balcerzak P and Angenent L.T, (2010), “Microbial Fuel Cell: A Living Battery” A Curriculum for High School Science Education; the angenent Lab (# 0939882).
[3] Barua P.K., Deka D. (2010); Electricity Generation from Biowaste Microbial Fuel cells; International Journal of Energy, information and Communications. Vol 1. Issue 1.
[4] Bettin C. (2006) “Applicability and feasibility of Incorporating Microbial Fuel Cell Technology into Implantable Biomedical Devices” College of Engineering, 122 Hitchcock Hall, The Ohio University.
[5] Chai L.F., Chai L. C., Suhaimi N. and Son R. (2010) “Performance of Air-Cathode microbial Fuel Wood charcoal as Elecrode”. International Food Research Journal, 17: 485-490.
[6] Daramola B. and Aina J.O., (2007), “Effects of Alum on Pasting and some Physicochemical properties of Cassava Starch”, World Journal of Diary & Food Science 2(1); pp 18-22.
[7] Daramola B. and Osanyinlusi S.A (2006), “Investigation on Modification of Cassava starch Using active Components of ginger roots (Zingiber Officinale Roscoe)”, African Journal of Biothnology, Vol 5. (10), PP 917-920).
[8] Das S and Mangwani E., (2010) “Recent Developments in Microbial Fuel Cells: A Review” Journal of Scientific and Industrial Research, vol. 69. pp 727-731.
[9] Franks A. E and Nevin K. P, (2010), ”Microbial Fuel Cells: A Current Review” Energies 2010, vol 3, pp. 899-919, doi: 10.3390/en 3050899
[11] Kasongo J and Togo C.A (2010); “The Potential of Whey in Driving Microbial Fuel Cell: A dual Prospect of Energy Recovery and Remediation.” African Journal of Biotechnology Vol 9 (46) PP. 7885-7890.
[12] Kim J.H; Park H.S; Hyun S.M; Chang S.I; Kim M and Kim H.B, (2002), “A mediator-less microbial fuel cell using metal reducing bacterium, Shwanella putrefaciens” Enzyme and Microbial Technology 30 (2002) 145-152.
[13] Liu H. and Logan B. E. (2004) “Electricity generation using an Air-Cathode Single chamber Microbial Fuel cell in the Presence and Absence of a Proton Exchange membrane”. Environ. Sci. Technol, 38, PP 4040-4046.
[14] Liu H.; Cheng S. and Logan B.E. (2005);” Production of Electricity from Acetate or Butyrate Using a Single Chamber Microbial fuel Cell; Environ. Sci. Technol. 39, PP 658-662.
[15] Lovely D.R., (2006), “Microbial fuel cells: novel Microbial Physiologies and engineering approaches “ Current opinion in biotechnology, 2006, 17: 327-332
[16] Mathuriya A.S and Sharma V.N; (2009) “Bioelectricity Production from Paper Industry Waste Using a Microbial Fuel Cell by Clostridium Specie” J Biochem Tech (2009), 1(2) pp.49-52.
[17] Min B., Cheng S., Logan B.E. (2005), “Electricity Generation using Membrane and salt bridge Microbial fuel cells”, Water Research Vol. 39, PP 1675-1686.
[18] Mohan S.V.; Raghavulu S.V; Srikanth S.; Sarma P.N. (2007), “Bioelectricity Production by mediatorless microbial fuel Cell Under Acidophilic Condition Using wastewater as substrate: Influence of substrate loading Rate”, Bioengineering and environment center, Indian institute of Chemical Tech, Hyderabod 200,007; India, vol. 92, PP.12, 25.
[19] Momo, O.L.Y; Nyeayor B., (2010); “Generation of electricity from Abattoir Waste Water with the Aid of a Relatively Cheap Source of catholyte”; J. Appl. Sci. Environ. Manage. Vol. 14 (2) pp 22-27.
[20] Pant D; Bogaert G.V; Diels L and Vanbroekhoven K, (2009) ”A Review of the Substrates used in Microbial Fuel Cells (MFCs) for Sustainable Energy Production”, Bioresource Technology (2009), do i: 10.1016/ j.biotech. 2009. 10.1017.
[21] Rabaey K; Boon N; Siciliano S. D; Verhaege M; Verstaete W (2004), “Biofuel cells select for Microbial Consortiua that self-wedaite electron transfer”. Appl. Environ. Microbiol. 70(9), 5373-5382.
[22] Rabaey K; Lissens G; Siciliano S. D; Verhaege M; Verstaete W (2003), “A Microbial fuel cell capable of converting glucose to electricity at high rate and efficiency.” Biotechnol. Lett.25(18) 1531-1535.
[23] Schwartz K., (2007) “Microbial Fuel Cells: Design Elements and Application of a Novel Renewable Energy Source”. MMG 445 Basic Biotechnology eJournal, 2007.
[24] Scott K. and Murano C. (2007), “A study of Microbial fiel cell Battery using manure Sludge waste”. J Chem Technol Biotechol 82, pp 809-817.
[25] Scott K., and Murano C. (2007); “ Microbial Fuel Cells utilizing carbohydrate”, J Chem technol Biotechnol 82, PP. 92-100.
[26] Sherif A, Moshtashi N. and Bagheri A. (2010) “Agar Alternative for Micropropagation of African Violet” Saint Paulis ionantha), African J.A Biotechnol. Vol 9(54) pp 9199-9203, 27 Dec. 2010.
[27] Strik D.P B T B, tre Heijne A, Hamelers H.V.M , Saakes M. & Buisman C.J.N, (2008). “Feasibility Study on electrochemical impedance spectroscopy for Microbial Fuel Cells: Measurement, Mode and Data validation.” ECS Transaction, 13(21) PP. 27-41, 10.1149/13036209.
[28] Wang X, Feng Y.J and Lee H., (2008),“Electricity Production from Beer Brewery Wastewater Using Single Chamber Microbial Fuel Cell”, WA Publishing, Water Science and Technology- WST/57.7
[29] Yiu P H; Loh S L; Rajan A; Wong S C and (2008), “Phisicochemical properties of Sago Starch Modified by acid Treatment in alcohol”, American Journal of Applied Sciences 5(4): 307-311 2008,