Enhanced Prediction of Heart Disease with
Feature Subset Selection using Genetic
Algorithm
M. ANBARASI [email protected]E. ANUPRIYA* [email protected] N.CH.S.N.IYENGAR
School of Computing Science and Engineering, VIT University, Vellore – 632 014, India Abstract
Clinical diagnosis is done mostly by doctor’s expertise and experience. But still cases are reported of wrong diagnosis and treatment. Patients are asked to take number of tests for diagnosis. In many cases, not all the tests contribute towards effective diagnosis of a disease. The objective of our work is to predict more accurately the presence of heart disease with reduced number of attributes. Originally, thirteen attributes were involved in predicting the heart disease. In our work, Genetic algorithm is used to determine the attributes which contribute more towards the diagnosis of heart ailments which indirectly reduces the number of tests which are needed to be taken by a patient. Thirteen attributes are reduced to 6 attributes using genetic search. Subsequently, three classifiers like Naive Bayes, Classification by clustering and Decision Tree are used to predict the diagnosis of patients with the same accuracy as obtained before the reduction of number of attributes. Also, the observations exhibit that the Decision Tree data mining technique outperforms other two data mining techniques after incorporating feature subset selection with relatively high model construction time. Naïve Bayes performs consistently before and after reduction of attributes with the same model construction time. Classification via clustering performs poor compared to other two methods.
Keywords: Data Mining; Genetic Algorithm; Naive Bayes; Decision tree; Classification by clustering; Feature Subset Selection.
1. Introduction
Health care awareness and technology developments have led to huge number of hospitals and health care centers. But still, quality of health care service at affordable cost is still a challenging issue in developing countries. Though many countries have taken firm steps in providing healthcare services, reach of these services to poor and needy still remains as a question mark.
In other dimension, un-imaginable services like separation of twin births, discovery of new medicines for deadly diseases are happening. But still cases are reported of poor clinical diagnosis and treatment. Most of the time, the clinical decisions are made by doctor’s expertise and experience. All doctors are not experienced or expert. Hospitals do have information systems, Decision Support Systems, Image and Scan processing systems, but not all hospitals have or applications of these systems are limited. Decision support systems with diagnosis support for naive doctors and for experienced doctors would be a guideline for clinical decision making.
Data mining is a crucial step in discovery of knowledge from large data sets. In recent years, Data mining has found its significant hold in every field including health care. Mining process is more than the data analysis which includes classification, clustering, association rule mining and prediction. It also spans other disciplines like Data Warehousing, Statistics, Machine learning and Artificial Intelligence. Our work attempts to predict efficiently diagnosis with reduced number of factors (i.e. attributes) that contribute more towards the cardiac disease using classification data mining technique.
2. Related Work
Large number of work is carried out in finding out efficient methods of medical diagnosis for various diseases. Our work is an attempt to predict efficiently diagnosis with reduced number of factors (i.e. attributes) that contribute more towards the cardiac disease using classification. Sellapan et al (2008), Asha et al(2010) developed an Intelligent Heart Disease Prediction System to predict the heart disease using three classifiers Decision Tree, Naïve Bayes and Neural Networks. Naïve Bayes performed with good prediction probability of 96.6%. Also, 13 attributes were used for prediction. Our works differs by reducing the number of attributes to 6 and were able to achieve the same performance. Harleen etal (2006) examined the potential use of classification data mining technique like decision tree, rule induction and artificial neural network for diagnosis of diabetic patients. Carlos (2006) implemented efficient search for diagnosis of heart disease comparing association rules with decision trees. Our approach would be an another search for efficient diagnosis. The rest of the sections are organized in the following manner. Section 3.1 explains the data set used. Section 3.2 discusses on reducing the number of attributes using genetic algorithm. Section 3.3 illustrates the classification process and the outcomes. Section 4 discusses the evaluation methods and results.
3. Data Set
4. Feature Subset Selection using Genetic Algorithm
Feature Extraction is the process of detecting and eliminating irrelevant, weakly relevant or redundant attributes or dimensions in a given data set. The goal of feature selection is to find the minimal subset of attributes such that the resulting probability distribution of data classes is close to original distribution obtained using all attributes. Comparison is one of the expensive operations involved in data mining task. In general, the computational cost of data set D is O(n x |D| x log(|D|)), where n – number of attributes, D – number of instances. The number of comparisons required for m attributes and n instances is m * n2.
For a data set D, with n attributes, 2n subsets are possible. Search for an optimal subset would be highly expensive especially when n and the number of data classes increases. Sometimes it may be infeasible. Therefore most of the feature selection techniques are heuristic methods. These heuristic methods are greedy in nature and try to explore possible reduced search space. Feature selection techniques fall under two categories. First, feature ranking techniques and second, feature subset selection techniques. In the former, all features are ranked by a metric like information gain, chi-square etc. The features that do not achieve the adequate score are eliminated. In the later, the search is for optimal subset of features that would be equivalent to original subset of features. The subset of features are evaluated more commonly based on distance metrics like Euclidean, Hamming etc or filter metrics like Entropy or Probabilistic distance. Common search approaches include greedy forward attribute selection, backward attribute selection, simulated annealing, and genetic algorithms.
Genetic Algorithm incorporates natural evolution methodology. The genetic search starts with zero attributes, and an initial population with randomly generated rules. Based on the idea of survival of the fittest, new population is constructed to comply with fittest rules in the current population, as well as offspring of these rules. Offspring are generated by applying genetic operators cross over and mutation. The process of generation continues until it evolves a population P where every rule in P satisfies the fitness threshold. With initial population of 20 instances,
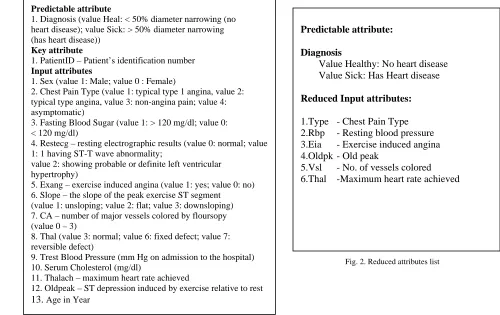
Predictable attribute
1. Diagnosis (value Heal: < 50% diameter narrowing (no heart disease); value Sick: > 50% diameter narrowing (has heart disease))
Key attribute
1. PatientID – Patient’s identification number Input attributes
1. Sex (value 1: Male; value 0 : Female)
2. Chest Pain Type (value 1: typical type 1 angina, value 2: typical type angina, value 3: non-angina pain; value 4: asymptomatic)
3. Fasting Blood Sugar (value 1: > 120 mg/dl; value 0: < 120 mg/dl)
4. Restecg – resting electrographic results (value 0: normal; value 1: 1 having ST-T wave abnormality;
value 2: showing probable or definite left ventricular hypertrophy)
5. Exang – exercise induced angina (value 1: yes; value 0: no) 6. Slope – the slope of the peak exercise ST segment
(value 1: unsloping; value 2: flat; value 3: downsloping) 7. CA – number of major vessels colored by floursopy (value 0 – 3)
8. Thal (value 3: normal; value 6: fixed defect; value 7: reversible defect)
9. Trest Blood Pressure (mm Hg on admission to the hospital) 10. Serum Cholesterol (mg/dl)
11. Thalach – maximum heart rate achieved
12. Oldpeak – ST depression induced by exercise relative to rest 13. Age in Year
Predictable attribute:
Diagnosis
Value Healthy: No heart disease Value Sick: Has Heart disease Reduced Input attributes:
1.Type - Chest Pain Type 2.Rbp - Resting blood pressure 3.Eia - Exercise induced angina 4.Oldpk - Old peak
5.Vsl - No. of vessels colored 6.Thal -Maximum heart rate achieved
Fig. 2. Reduced attributes list
generation continued till the twentieth generation with cross over probability of 0.6 and mutation probability of 0.033. The genetic search resulted in six attributes out of thirteen attributes.
5.
Classifiers
Classification is a supervised learning method to extract models describing important data classes or to predict future trends. Classification methods are largely used in machine learning, pattern recognition and artificial intelligence. Classification methods have numerous applications which includes risk analysis, credit card fraud detection, target marketing, manufacturing and medical diagnosis. Our work intends to use three classifiers Decision Tree, Naïve Bayes and Classification via clustering to diagnosis the presence of heart disease in patients.
Decision Tree is a popular classifier which is simple and easy to implement. It requires no domain knowledge or parameter setting and can handle high dimensional data. Hence it is more appropriate for exploratory knowledge discovery. It still suffers from repetition and replication. Therefore necessary steps need to be taken to handle repetition and replication. The performance of decision trees can be enhanced with suitable attribute selection. Correct selection of attributes partition the data set into distinct classes. Our work uses J48 decision tree for classification. Observations show that Decision trees outperform the other two classifiers but take more time to build the model.
Naïve Bayes is a statistical classifier which assumes no dependency between attributes. It attempts to maximize the posterior probability in determining the class. By theory, this classifier has minimum error rate but it may not be case always. However, inaccuracies are caused by assumptions due to class conditional independence and the lack of available probability data. Observations show that Naïve Bayes performs consistently before and after reduction of number of attributes.
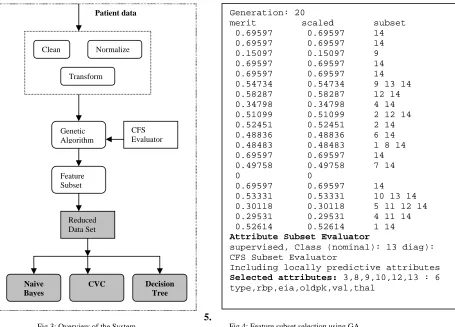
Clean Normalize
Transform Patient data
Genetic Algorithm
CFS Evaluator
Feature Subset
Reduced Data Set
Naive Bayes
CVC Decision
Tree
Generation: 20
merit scaled subset
0.69597 0.69597 14
0.69597 0.69597 14
0.15097 0.15097 9
0.69597 0.69597 14
0.69597 0.69597 14
0.54734 0.54734 9 13 14
0.58287 0.58287 12 14
0.34798 0.34798 4 14
0.51099 0.51099 2 12 14
0.52451 0.52451 2 14
0.48836 0.48836 6 14
0.48483 0.48483 1 8 14
0.69597 0.69597 14
0.49758 0.49758 7 14
0 0
0.69597 0.69597 14
0.53331 0.53331 10 13 14
0.30118 0.30118 5 11 12 14
0.29531 0.29531 4 11 14
0.52614 0.52614 1 14
Attribute Subset Evaluator
supervised, Class (nominal): 13 diag): CFS Subset Evaluator
Including locally predictive attributes
Selected attributes: 3,8,9,10,12,13 : 6 type,rbp,eia,oldpk,vsl,thal
Classification via clustering: Clustering is the process of grouping similar elements. This technique may be used as a preprocessing step before feeding the data to the classifying model. The attribute values need to be normalized before clustering to avoid high value attributes dominating the low value attributes. Further, classification is performed based on clustering. Observations show that Classification via clustering performs poor even after reduction of number of attributes when compared to the other two methods.
5.1 Classifier evaluation measures
We have trained the classifiers to classify the medical data set as either “healthy” or “sick”. The accuracy of a classifier can be computed using sensitivity and specificity. The general and specific confusion matrix of two classes healthy and sick of three classifiers is show in Table 1. It is a crucial measure for analyzing how well your classifier can recognize tuples of different classes. For the given two classes, we consider in terms of positive tuples (diagnosis =healthy) versus negative tuples (eg., diagnosis = sick).
In Table 1, True positives refer to the positive tuples that were correctly labeled by the classifier, while true negatives are the negative tuples that were correctly labeled by the classifier. False positives are the negative tuples that were incorrectly labeled by the classifier, while false negatives are the positive tuples that were incorrectly labeled by the classifier. The sensitivity and specificity measures can be used for above purpose and precision is used for the percentage of samples labeled as “healthy”. These measures are defined as
Sensitivity =
pos
pos
t
t_pos is the number of true positives (i.e healthy samples that were correctly classified) and pos is the number of positive (healthy) samples.
Specificity =
neg
neg
t
t_neg is the number of true negatives (i.e sick samples that were correctly classified) an neg is the number of positive (sick) samples and f_pos is the number of false positives (“sick samples that were incorrectly labeled as healty).
Precision =
)
(
t
pos
f
pos
pos
t
Accuracy = Sensitivity
)
(
pos
neg
pos
+ Specificity(
pos
neg
)
neg
The true positives, true negatives, false positives and false negatives are also useful in assessing the costs and benefits (or risks and gains) associated with a classification model.
6. Experiments and Results
Experiments were conducted with Weka 3.6.0 tool. Data set of 909 records with 13 attributes is used. All attributes are made categorical and inconsistencies are resolved for simplicity. To enhance the prediction of classifiers, genetic search is incorporated. The genetic search for optimal set of attributes start with zero attributes, an initial population and randomly generated rules. The generation of new population continues until it evolves a population where every rule is satisfied by the population. With 0.6 cross over probability and 0.033 mutation probability, the genetic search resulted in 6 attributes which contributes more towards the diagnosis of the cardiac disease.
Predicted class
Actual class
Classification Matrix for classifier: Naïve Bayes
Classification Matrix for classifier: Decision Tree
Classification Matrix for classifier: Classification by clustering
Table 1: Confusion Matrix obtained from three classifiers
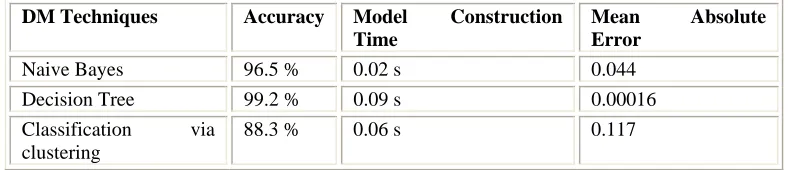
DM Techniques Accuracy Model Construction Time
Mean Absolute Error
Naive Bayes 96.5 % 0.02 s 0.044
Decision Tree 99.2 % 0.09 s 0.00016
Classification via clustering
88.3 % 0.06 s 0.117
Table 2: Comparative Table of the three classifiers
7. Conclusion
The objective of our work is to predict more accurately the presence of heart disease with reduced number of attributes. Originally, thirteen attributes were involved in predicting the heart disease. In our work, Genetic algorithm is used to determine the attributes which contribute more towards the diagnosis of heart ailments which indirectly reduces the number of tests which are needed to be taken by a patient. Thirteen attributes are reduced to 6 attributes using genetic search. Subsequently, three classifiers like Naive Bayes, Classification by clustering and Decision Tree are used to predict the diagnosis of patients with the same accuracy as obtained before the reduction of number of attributes. Also, the observations exhibit that the Decision Tree data mining technique outperforms other two data mining techniques after incorporating feature subset selection with relatively high model construction time. Naïve Bayes performs consistently before and after reduction of attributes with the same model construction time. Classification via clustering performs poor compared to other two methods. Inconsistencies and missing values were resolved before model construction but in real time, that is not the case. Also, the intensity of the disease based on the results was unpredictable. We intend to extend our work applying fuzzy learning models to evaluate the intensity of cardiac disease.
C1 C2
C1 True Positives False Negatives C2 False Positives True Negatives
Healthy Sick
Healthy 455 15
Sick 16 423
Healthy Sick
Healthy 463 1
Sick 1 444
Healthy Sick Healthy 423 21
8. References
[1] Asha Rajkumar and Mrs. G.Sophia Reena (2010): Diagnosis Of Heart Disease Using Datamining Algorithm, GJCST,Vol. 10 Issue 10 Ver. 1.0 Sep2010, pp. 38-43.
[2] Boleslaw Szymanski, et al. (2006): Using Efficient Supanova Kernel For Heart Disease Diagnosis, proc. ANNIE 06, intelligent engineering systems through artificial neural networks, vol. 16, pp. 305-310.
[3] Bressan, M. and J. Vitria (2003): Onthe selection and classification of independent features,Pattern Analysis and Machine Intelligence, IEEE Transactions. pp. 1312-1317.
[4] Carlos Ordonez (2006): Comparing Association Rules and Decision Trees for Disease Prediction, ACM, HIKM’06, Arlington, Virginia, USA. [5] Chen J and Greiner R (1999): Comparing Bayesian Network Classifiers. In Proc. of UAI-99, pp. 101–108.
[6] Franck Le Duff, et al. (2004): Predicting Survival Causes After Out of Hospital Cardiac Arrest using Data Mining Method, Studies in health technology and informatics ,107 pp. 1256-1259.
[7] Harleen Kaur and Siri Krishan Wasan (2006): Empirical Study on Applications of Data Mining Techniques in Healthcare, Journal of Computer Science 2 (2): 194-200, ISSN pp.1549-3636.
[8] Krishnapuram B, et al. (2004): A Bayesian approach to joint featureselection and classifier design.Pattern Analysis and Machine Intelligence, IEEE Transactions on, 6(9): pp. 1105-1111.
[9] Long W.J, et al. (1997) : Reasoning requirements for diagnosis of heart disease. Artificial Intelligence in Medicine, 10(1), pp. 5–24. [10] McCullough C.L, et al. (2007): Use of Neural Networks to Predict Adverse Outcomes from Acute Coronary Syndrome for Male and
Female Patients, 6th International Conference on Machine Learning and Applications (ICMLA), December. Cincinnati, Ohio, USA. pp. 13-15.
[11] Niti Guru, et al. (2007), Decision Support System for Heart Disease Diagnosis Using Neural Network, Delhi Business Review , Vol. 8, No. 1.
[12] Ordonez C, et al. (2001): Mining constrained association rules to predict heart disease. In IEEE ICDM Conference, pp. 433–440. [13] Richard N. Fogoros, M.D, The 9 Factors that Predict Heart Attack 90% of heart attacks are determined by these modifiable risk factors,
About.com Guide.
[14] Sellappan Palaniappan and Rafiah Awang (2008): Intelligent Heart Disease Prediction System Using Data Mining Techniques, 978-1-4244-1968- 5/08/ IEEE.