[Gadgil et al., 5(6): June, 2018]
ISSN 2349-0292
Impact Factor 3.802
GLOBAL JOURNAL OF ADVANCED ENGINEERING TECHNOLOGIES AND
SCIENCES
A COMPARATIVE STUDY OF ZINC, COPPER, IRON AND CALCIUM METALS
BETWEEN BRANDED POWDERED MILK SAMPLES AND PACKED
PASTEURISED MILK SAMPLES
Sarita Gadgil*, Dr Sunita Singh Shekhawat, Dr Renu Sharma, Vikas Kumar
*Department of Chemistry, NIET, Nims University Rajasthan, Jaipur, India
DOI: 10.5281/zenodo.1286739
ABSTRACT
Milk products contain important nutrient elements and are mostly consumed in developing countries. Good quality control is very essential in the production and processing of powdered milk products, also transportation and storage conditions might have effects on composition of these products. The deficiency or excess of any of the mineral elements in powdered milk may create significant health problems for the consumer. In this study, the concentration levels of some mineral elements in different brands of powdered milk sold in India were determined using Atomic Absorption Spectrometer (AAS). The calcium, iron and zinc concentrations have been found higher in powdered milk samples in comparison of pasteurised milk samples.
KEYWORDS: Atomic Absorption Spectroscopy, milk samples, Ca, Fe, Cu and Zn concentrations.
INTRODUCTION
Milk is widely consumed food product for both adults and children, while formula milk may constitute a major nutrient source for infants. Furthermore, milk and milk powdered are used widely in the food industry for the production of other foods. Because of its nutritional importance and widespread consumption, regulations in many countries necessitate that the quality of the milk is routinely monitored. Milk is a complex, bioactive substance that promotes growth and development of human beings. Although, milk is an ideal source of macro elements (Ca, K and P) and microelements (Cu, Fe, Zn and Se), additional amounts of contaminant metals might enter milk
and dairy products reaching levels that are harmful to humans (1). Both dairies and food manufacturers need to carry out the analysis of major, trace and contaminant elements in milk and milk powder to fulfil requirements for labelling purposes, monitor nutritional quality, and safeguard against contamination by toxic elements. In Europe, regulation such as commission regulation (EC) No 1881/2006 set out maximum levels for some contaminants in food. Similarly, in India, Food Safety and Standard Regulations (FSSI) address maximum permitted levels by element over a variety of food group.
Powdered milk has been produced using different techniques. The production method and stages employed makes the whole milk susceptible to contamination and having the required essential element. Most of the powdered
milk available in market is produced from cow’s milk (2). Milk powdered contains on average 25-27% protein,
37- 38% carbohydrates, 25-28% fat, and 6-7% (ash) minerals (3). Essential elements in powdered milk are sodium, potassium, calcium, phosphorus and magnesium. Metals present in milk powdered which are well below 50 mg/kg can be referred to as trace metals. These metals have some nutritional or toxicological significance. For instance, iron, copper and zinc are found to be necessary in certain qualities in food. These elements can cause ill effect when consumed at higher levels. Moreover, metals such as lead, cadmium, mercury and arsenic
are found to be toxic even at low levels of 10-50 mg/kg (WHO,1996) (4).
The presence of heavy metals in milk and powdered milk may be attributed to the contamination of the milk
during lactation, through feeding stuff, pesticides and water (5). Heavy metals are non- biodegradable in nature and become accumulated in the food chains via bio- transformation, bio- accumulation and bio-magnifications (6). Lead and Cadmium heavy metals are non- essential and have no biological effect (7). Accumulation of lead produces damaging effects in the hematopoietic, haematic, renal, gastrointestinal systems (8).
[Gadgil et al., 5(6): June, 2018]
ISSN 2349-0292
Impact Factor 3.802
MATERIALS AND METHODS
Collection of powdered milk samplesThe collected powdered milk samples and packed liquid milk samples were purchased from the market.
Sample digestion prior to analysis
For determination of metal concentrations, all digestion beakers were first washed and rinsed with de-ionized water and then kept in an oven for drying.
For powdered milk samples, 0.6 g and for liquid milk samples, 10 ml samples were taken and transferred to dried beakers. 15.0 ml of concentrated HNO3 and 4.0 ml of HClO4 were added to digest the samples. The digestion beakers were placed in an oven at 200 o C for 15 min. The mixture was allowed to cool and then filtered through a Whatman filter paper into a 50 ml standard volumetric flask. The filtrate was diluted to 50 ml with de-ionized distilled water.
The digested milk samples were analysed for zinc, copper, iron and calcium by an Atomic Absorption Spectrometer [Perkin- Elmer (Germany) Model no. Aanalyst100]. Hollow cathode lamps of Zn, Cu, Fe and Ca were used at specific wavelength of every metal. Measurements were done against metal standard solutions (Merck).
Zinc (Zn)
The digested milk samples were analysed by Atomic Absorption Spectrometer for Zn metal on air-acetylene flame at wavelength 213.86 nm.
Copper (Cu)
The digested milk samples were analysed by Atomic Absorption Spectrometer Cu metal on flame at wavelength 324.74 nm.
Calcium (Ca)
The digested milk samples were analysed by Atomic Absorption Spectrometer for calcium metal using Nitrous oxide-acetylene flame at wavelength 423 nm.
Iron (Fe)
The digested milk samples analysed by Atomic Absorption Spectrometer for Iron metal on air-acetylene flame at wavelength 248.3 nm.
RESULTS AND DISCUSSION
The results obtained after the analysis of various parameters in powdered milk samples from India have been summarized in tables and figures, separately.
Table 1: The various powdered milk samples selected for analysis S.No. Powdered Milk Samples Liquid Milk Samples
1. Powdered Milk Sample 1 (PMS1) Liquid Milk Sample 1 [SLMS(S1)]
2. Powdered Milk Sample 2 (PMS2) Liquid Milk Sample 2 [LMLMS(S2)]
3. Powdered Milk Sample 3 (PMS3) Liquid Milk Sample 3 [LLMS (S3)]
4. Powdered Milk sample 4 (PMS4) Liquid Milk Sample 4 [SLMS (S4)]
5. Powdered Milk Sample 5 (PMS5) Liquid Milk Sample 5 [PLMS (S5)]
[Gadgil et al., 5(6): June, 2018]
ISSN 2349-0292
Impact Factor 3.802
Table 2: Iron concentrations in powdered milk samples S.No. Samples Concentration(μg/g)
1 PMS1 756.00
2 PMS2 241.91
3 PMS3 213.66
4 PMS4 166.16
5 PMS5 140.66
6 PMS6 163.75
Table 3: Copper concentrations in powdered milk samples S.No. Samples Concentration(μg/g)
1 PMS1
6.58
2 PMS2
0.25
3 PMS3
NA
4 PMS4
NA
5 PMS5
NA
6 PMS6
NA
Table 4: Zinc concentrations in powdered milk samples S.No. Samples Concentration(μg/g)
1 PMS1 61.41
2 PMS2 NA
3 PMS3 92.33
4 PMS4 71.66
5 PMS5 79.16
6 PMS6 78.16
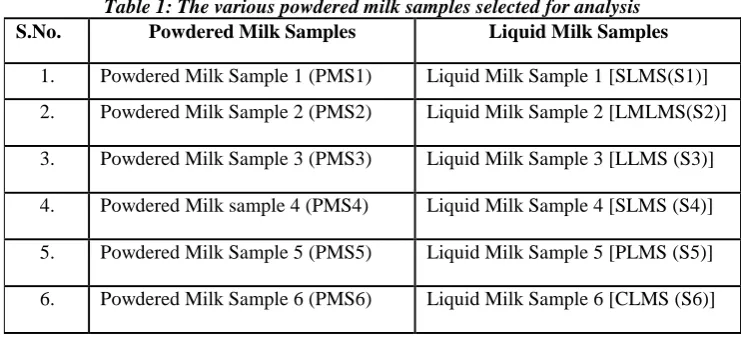
Table 5: Calcium concentrations in powdered milk samples S.No. Samples Concentration(μg/g)
1 PMS1 4166
2 PMS2 4833
3 PMS3 5416
4 PMS4 4583
5 PMS5 4083
[Gadgil et al., 5(6): June, 2018]
ISSN 2349-0292
Impact Factor 3.802
Fig. 1: Iron concentrations in powdered milk samples
Fig. 2: Copper concentrations in powdered milk Samples
Fig. 3: Zinc concentrations in powdered milk samples
[Gadgil et al., 5(6): June, 2018]
ISSN 2349-0292
Impact Factor 3.802
Table 6: Calcium concentrations in liquid milk samples S.No. Samples Concentration(μg/g)
1 SLMS(S1) 590
2 LMLMS(S2) 555
3 LLMS(S3) 420
4 SLMS(S4) 400
5 PLMS(S5) 380
6 CLMS(S6) 540
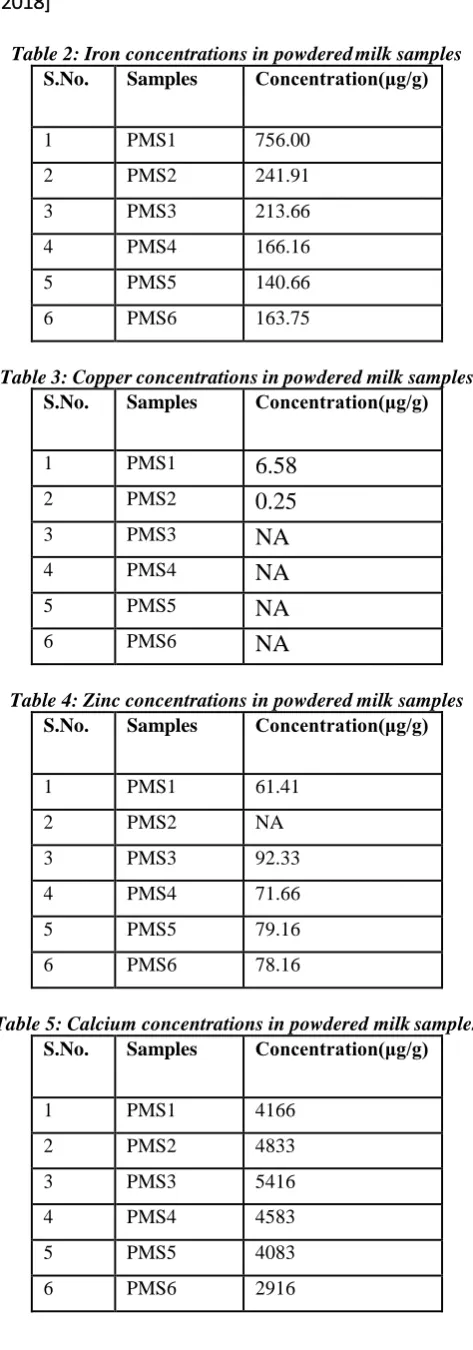
Table 7: Zinc concentrations in liquid milk samples S.No. Samples Concentration(μg/g)
1 SLMS(S1) NA
2 LMLMS(S2) 4.82
3 LLMS(S3) 9.225
4 SLMS(S4) 7.895
5 PLMS(S5) 9.365
6 CLMS(S6) 8.315
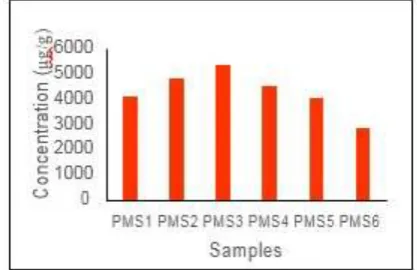
Table 8: Iron concentrations in liquid milk samples S.No. Samples Concentration(μg/g)
1 SLMS(S1) 18.455
2 LMLMS(S2) 12.75
3 LLMS(S3) 15.03
4 SLMS(S4) 13.735
5 PLMS(S5) 12.145
6 CLMS(S6) 10.905
Table 9: Copper concentrations in liquid milk samples S.No. Samples Concentration(μg/g)
1 SLMS(S1) 0.01
2 LMLMS(S2) 0.3
3 LLMS(S3) 0.345
4 SLMS(S4) NA
5 PLMS(S5) NA
[Gadgil et al., 5(6): June, 2018]
ISSN 2349-0292
Impact Factor 3.802
Fig. 5: Calcium concentrations in liquid milk samples
Fig. 6: Zinc concentrations in liquid milk samples
[Gadgil et al., 5(6): June, 2018]
ISSN 2349-0292
Impact Factor 3.802
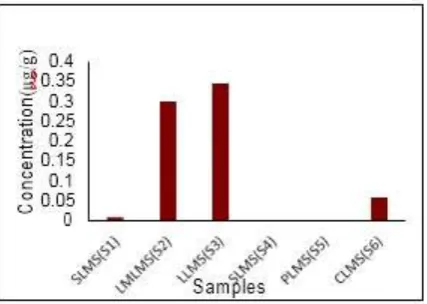
Fig. 8: Cupper concentrations in liquid milk samples
The results show that the minimum iron concentration (140.66 μg/g) have been found in powdered milk sample 5 (PMS5) while maximum iron levels (756 μg/g) have been found in the powdered milk sample1(PMS1). The results show that sample 1 contains the highest levels of iron. The copper concentration has been found only in the powdered milk sample 2 (PMS2) (6.58μg/g) have been found at the site of Powdered Milk Sample1(PMS1). Of PMS1 and PMS2 with high difference range. The minimum zinc concentration (61.41μg/g) have been found in powdered milk sample 1(PMS1) whereas maximum concentration (92.33 μg/g) have been found in powdered milk sample 3 (PMS3). The minimum calcium concentration (2916 μg/g) have been found in powdered milk sample 6 (PMS6) whereas maximum levels (5416μg/g) have been found in powdered milk sample3 (PMS3).
The minimum iron concentration (10.905 μg/g) have been found in pasteurised milk sample 6 (CLMS6) while maximum iron levels (18.455 μg/g) have been found in the liquid milk sample1(SLMS1). The minimum copper concentration (0.01 μg/g) have been found in pasteurised milk sample 1 (SLMS1) while maximum copper levels (0.345 μg/g) have been found in the pasteurised milk sample3 (LLMS3). The minimum zinc concentration (4.82 μg/g) have been found in pasteurised milk sample 2 (LMLMS2) while maximum zinc levels (9.365 μg/g) have been found in the pasteurised milk sample 5(PLMS5). The minimum calcium concentration (380 μg/g) have been found in pasteurised milk sample 5 (PLMS5) while maximum calcium levels (590 μg/g) have been found in the pasteurised milk sample1(SLMS1).
It has been found that iron and calcium concentrations are much higher in powdered milk samples as compared to pasteurised milk samples. Copper concentrations have been found in almost all pasteurised milk samples with low values while copper levels are not found in most of the powdered milk samples. Zinc levels are also found higher in powdered milk samples in comparison of pasteurised milk samples.
CONCLUSION
Finally, it is observed and concluded that powdered milk samples are rich in calcium, zinc and iron essential metals and is more suitable milk product in case of minerals deficiency for human.
ACKNOWLEDGEMENTS
The authors are very grateful to St. John’s College, Agra for providing UV-Vis Spectrometry and Atomic Absorption Spectrometry (AAS) facilities and Department of Chemistry, NIET, Nims University Jaipur.
REFERENCES
1. Qin, L., Q., Wang, X., P., Li, W., Tong, X. and Tong, W. J. “The minerals and heavy metals in cow’s milk from China and Japan”. Journal Health Science 55(2):300-305, 2009.
2. Salah F. A. A. Esmat, I. A. and Mohamed, A. B., “Heavy metals residues and trace elements in milk powder marketed in Dakahlia”, International Food Research Journal 20(4); 1807-1812,2013. 3. Tamine, A.Y. “Dairy powders and concentrated products”, 1st ed. Widey –Black well. Uk p. 2009. 4. World Health Organisation/WHO, “Trace elements in human nutrition and health”, (A report of
[Gadgil et al., 5(6): June, 2018]
ISSN 2349-0292
Impact Factor 3.802
5. Carl, M., “Heavy metals and others three elements, monographs on residues and contaminants inmilk and milk products special issues 901”, International Dairy federation (IDF), Belgium 112-119, 1991.
6. Aslam, B., Jved, I., Hussain, K. F., Ur- Rahman, Z., “Uptake of heavy metal residues from sewerage sludge in the milk of goat and cattle during summer season”, J. Pak. Vet. 31(1), 75-77, 2011. 7. Khan, ZI, Ahmad, K., Bayat, A. Mukhtar, M. K. Sher, M., “Evaluation of lead concentration in
pasture and milk”, A possible risk for Haverstock and public health. Pak. J. Zool45(1) 79-84, 2013. 8. Correia, P.R.M., Oliveira, P.V., “Simultaneous determination of Cd and Pb in foodstuffs by