Iran J Public Health, Vol. 46, No.3, Mar 2017, pp.396-407
Original Article
Climate Change and Simulation of Cardiovascular Disease
Mortality: A Case Study of Mashhad, Iran
Mohammad BAAGHIDEH, *Fatemeh MAYVANEH
Dept. of Physical Geography, Faculty of Geography and Environmental Sciences, Hakim Sabzevari University, Sabzevar, Iran
*Corresponding Author: Email: [email protected]
(Received 04 Mar 2016; accepted 10 Aug 2016)
Introduction
The human body is affected by the thermal envi-ronment, influenced by many different factors air temperature, radiant temperature, humidity and air movement are the four basic environmental variables that affect human response to thermal environments (1-3). The relationship between high temperatures and the increase in mortality and disease rates has been described in detail for all over the world (4, 5). Usually days with high and low temperatures have relationships with mortality rate (6-9). The relationship between temperature and mortality had been extensively studied in Europe (10), United States (11-14) Australia (15-21), Korea (22) and Iran (24). For example, the change in all natural mortality
asso-ciated with 1 °C increase in maximum tempera-ture above the city-specific threshold was 3.12% (95% credibility interval = 0.60% to 5.72%) in the Mediterranean region and 1.84% (0.06% to 3.64%) in the north-continental region. Evaluat-ing the association between ambient air tempera-ture and specific health outcomes can help in identifying vulnerable populations and formulat-ing preventive actions (25).
Cardiovascular diseases are considered as the first causes of morality in the world and the morality caused by these diseases are much more than any other causes (26). Several studies have examined the effects of air temperature on overall cardi-ovascular mortality (10, 27). The relationship
be-Abstract
Background: Weather and climate play a significant role in human health. We are accustomed to affects the weather conditions.By increasing or decreasing the environment temperature or change of seasons, some diseases become prevalent or remove. This study investigated the role of temperature in cardiovascular disease mortality of city of Mashhad in the current decade and its simulation in the future decades under conditions of climate change.
Methods: Cardiovascular disease mortality data and the daily temperatures data were used during (2004-2013) period. First, the correlation between cardiovascular disease mortality and maximum and minimum temperatures were calcu-lated then by using General Circulation Model, Emissions Scenarios, and temperature data were extracted for the next five decades and finally, mortality was simulated.
Results: There is a strong positive association between maximum temperature and mortality (r= 0.83, P-value<0.01), also observed a negative and weak but significant association between minimum temperatures and mortality. The re-sults obtained from simulation show increased temperature in the next decades in Mashhad and a 1 °C increase in maximum temperature is associated with a 4.27% (95%CI: 0.91, 7.00) increase in Cardiovascular disease mortality. Conclusion: By increasing temperature and the number of hot days the cardiovascular disease mortality increases and these increases will be intensified in the future decades. Therefore, necessary preventive measures are required to miti-gate temperature effects with greater attention to vulnerable group.
tween temperature and morality caused by cardi-ovascular diseases in forms of v, u, and j. This issue indicates that the risk of mortality of cardi-ovascular diseases increases for days with hot and cold temperatures (28).
According to the UN‟s Intergovernmental Panel on Climate Change (IPCC) Fourth Assessment Report, climate change is likely to affect human health directly through changes in temperature and precipitation and indirectly through changes in the ranges of disease vectors (e.g., mosquitoes) and other channels (29). Climate change is poten-tially the biggest global health threat in the 21st century (17, 30). Future climate change will in-crease the frequency, intensity, and duration of heat waves (31). Not only has the global average temperature increased, but the frequency and in-tensity of extreme temperatures (e.g., heat waves and cold spells) have, also, the projected changes in surface air temperature in West Asia range be-tween 1.26 and 6.3 °C over the period 2010–2099 (with respect to the baseline period (1961–1990) for the B1 and A1F1 scenarios (32).
The projected temperature rise, along with higher frequency and intensity of heat waves, is expected to increase heat-related premature mortality and illnesses (33, 34). A growing number of studies have projected future heat-related mortality due to climate change in recent years (35-37).
The heat-related mortality were estimated in the UK in the 2020s, 2050s, and 2080s (38). The present-day relationship between daily mean temperature and mortality rates will apply in the future, and have applied an ensemble of climate models working from the Special Report on Emissions Scenarios (SRES) A1B emissions sce-nario. Using the same method (39) investigated future heat-related mortality impacts in six cities (Boston, Budapest, Dallas, Lisbon, London and Sydney), they showed that higher mortality is at-tributed to increases in the mean and variability of temperature with climate change rather than with the change in mean temperature alone.
Besides, Heatwave considered under three differ-ent climate change scenarios for 2081–2100 and in the absence of adaptation (40). Their results
showed city of Chicago, Illinois could experience between 166 and 2217 excess deaths per year at-tributable to heat waves, based on estimates from 7 global climate models. Regional adaptation planning is unfortunately often limited by the lack of quantitative information on potential fu-ture health responses. Studies in this field are li-mited in Iran and a lot of them have been con-ducted outside Iran. In addition, the relationship between climatic parameters and the mortality rate has been considered, while the issue of the climate change and its effects on the mortality rate has received less attention. Regarding the issue, that Mashhad city is one of the most popu-lated cities in Iran and has very different climatic conditions in different seasons of a year, and like other cities in the word, it has been influenced by conditions of climate changes in the future. The aim of the present research was to assess and report on future cardiovascular disease mor-tality in Mashhad, potentially leading to improved understanding of weather and climate vulnerabili-ty in the health sector, and more informed risk management and adaptation decisions. Generally, there is an urgent need to evaluate the relation-ship between climate change and human health, to better identify vulnerable populations and take preventive measures. In this paper, we investi-gated the association between temperature and cardiovascular disease mortality than mortality for the next five decades is simulated.
Materials and Methods
Study areaIran J Public Health, Vol. 46, No.3, Mar 2017, pp. 396-407
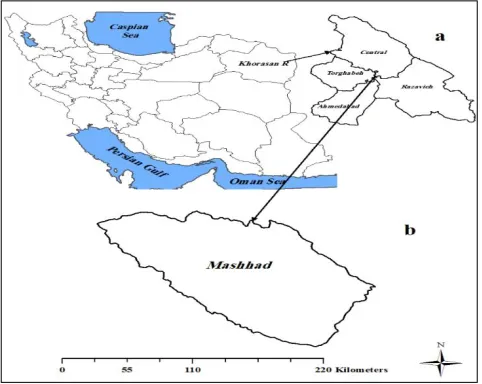
Fig. 1: The geographical location of the study area in Iran
(a) Shows the location of Khorasan Razavi Province in Iran, (b) is the location of Mashhad in Khorasan Razavi Province
In the present study, mortality data of cardiovas-cular diseases from database of Mashhad munici-pality were used according to the International Classification of Diseases and Related Health Problems 10thRevision (ICD-10) including codes
100-199 (41), for (2004-2013) period. Daily me-teorological variables of maximum and minimum temperature (°C), precipitation (mm) and solar radiation (MJm-2day-1) for Mashhad were
ob-tained from the Iran Meteorological Organiza-tion, in (1986-2005) period.
Statistical analysis
Then, by using Pearson correlation model, the relationship between temperature (minimum and maximum) and cardiovascular mortality was stu-died and the Simple Linear Regression Model was used to simulation of mortality in the future decades.
) 8814 . 0 2166 . 0
(y x
Where x is the independent variable (max tem-perature) and y is the dependent variable (mortal-ity). In the following, by using LARS-WG model, data of the General Circulation Models (GCMs) (in this study, HadCM3), under emission scena-rios (in this study, A2) confirmed by IPCC were downscaled and the data of max and min
tem-peratures were simulated for the future decades (2021-2030, 2046-2055, 2056-2065, 2080-2089, 2090-2099). Finally, by using the Linear Regres-sion Model cardiovascular mortality were simu-lated.
Atmospheric General Circulation Models
Atmospheric GCMs are mathematical models based on numerically discretized versions of dif-ferential equations that describe the atmospheric physics and dynamics, utilized to simulate the global atmospheric circulation.
Description of LARS-WGM model
LARS-WG is a stochastic weather generator and is used for simulating weather data at a single site under both current and future conditions (42-46). LARS-WG uses observed daily weather data for a given site to compute a set of parameters for probability distributions of weather variables as well as correlations between them, used to gener-ate synthetic weather time series of arbitrary length by randomly selecting values from the ap-propriate distributions. For each climatic variable
v value of a climatic variable vi corresponding to the probability pi is calculated as:
v p i nWherep(vobs) denotes probability based on ob-served data
vobs . For each climatic variable, twovalues, p0 andpn, are fixed as p0 0andpn 1,
with corresponding values of v0min vobs ((47,
48)). The data utilized in the form of daily time se-ries for suitable climate variables are precipitation (mm), maximum and minimum temperature (°C), and solar radiation (MJm-2day-1) (45, 49) of climatic variables and correlations between them derived from observed daily weather data at a given site for a long-term period (50, 51). To evaluate the
pro-duced data by the model and the observed data, statistical parameters such as coefficient of de-termination (R2) and Root Mean Square Error
(RMSE) were used and the results are shown in Table 1.
2, mod ,
1 n
obs i el i
i X X
RMSE
n
2
2
1 1 1
n n n
i i i i
i i i
R X X Y Y X X Y Y
Table 1:Statistical parameters (R2and RMSE) for Model Validation and Calibration
Statistic parameter Max Temperature Min Temperature
R2 0.9976 0.9966
RMSE 0.2710 0.4370
After calibration of the model and confirmation of its ability in simulation of climatic parameters, of the basic period (1986-2005), with regard to the behavior of the climate in the basic period, and statistical downscale of data of a General Circulation Model, future climatic parameters were simulated.
Hadley GCM 3 model
In this study, the output from the Hadley GCM 3 model (HadCM3) was utilized. It uses a 360 d per year and has a spatial grid with dimensions 2.5° latitude × 3.75° longitude. This GCM contains a complex model of land surface processes. It is considered the most mature and popular of the GCMs. This GCM is unique, in which it does not require flux adjustments to produce a realistic
scenario (52, 53).
Emissions scenarios
Emissions scenarios describe future releases into the atmosphere of greenhouse gasses, aerosols, and other pollutants and, along with information on land use and land cover, provide inputs to climate models (54, 55). They are based on as-sumptions about driving forces such as patterns
of economic and population growth, technology development, and other factors.
Scenario, A2
The A2 storyline and scenario family describes a very heterogeneous world. The underlying theme is self-reliance and preservation of local identities. Fertility patterns across regions converge very slowly, which results in continuously increasing population. Economic development is primarily regionally oriented and per capita economic growth and technological change more frag-mented and slower than other storylines (57, 58).
Results
Cardiovascular disease mortality
Iran J Public Health, Vol. 46, No.3, Mar 2017, pp. 396-407
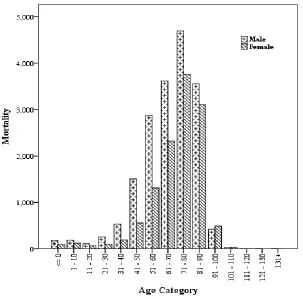
Fig. 2: Cardiovascular diseases mortality between male and female for different age groups in Mashhad during the baseline period (2004–2013)
Table 2: Socio-demographic features of the study population (n = 30121)
Variable Total
(n=30121) (n=17972) Men (n=12149) Women
Age groups (yr)<=0 273 174 99
1-10 307 184 123
11-20 174 111 63
21-30 351 254 97
31-40 726 536 190
41-50 2061 1505 556 51-60 4190 2878 1312 61-70 6650 4039 2611 71-80 8585 4698 3887 81-90 6053 3235 2818
91-100 679 318 361
101-110 58 28 30
111-120 4 3 1
121-130 1 9 1
Temperature (°C) Min -14.65 _
Max 33.25 Mean 23.95 SD 9.57 VAR 91.66
Relationship between temperature and car-diovascular mortality
In order to evaluate the relationship between max and min temperatures and cardiovascular disease mortality, Pearson correlation model was used. There is a relationship between cardiovascular mortality and max temperatures which are posi-tive and strong for temperatures more than 26 °C (r=0.83, P<0.01) such that, 1 °C increase in max-imum temperature is associated with a 4.27% (95%CI: 0.91, 7.00) increase in cardiovascular disease mortality. In addition, there observed a
negative and weak (r=0.47) but significant (P<0.01) association between minimum tempera-tures and mortality.
Simulation of temperature and mortality in the future decades
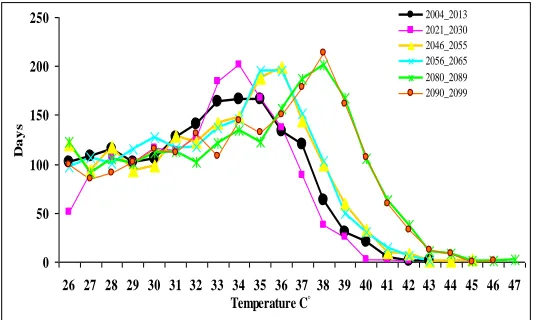
According to Table 1, the LARS-WG model has a reasonable capability of simulating the mini-mum and maximini-mum temperatures. In the present study temperatures, more than 26 °C (threshold temperature) were simulated for the future dec-ades by LARS-WG model. The comparison be-tween the observed decade and the future dec-ades shows the frequency of days with max tem-peratures higher than 26 °C will be a significant increase for the next five decades (especially in 2089-2080 and 2099-2090) ( Fig. 3).
Fig. 3:Number of days with max temperatures higher than 26 °C during future decades compared to the baseline
period
After simulation of max temperature in the future decades, by using Linear Regression Model
) 8814 . 0 2166 . 0
(y x that was obtained in the
observed decade, mortality was simulated under emission scenario A2.
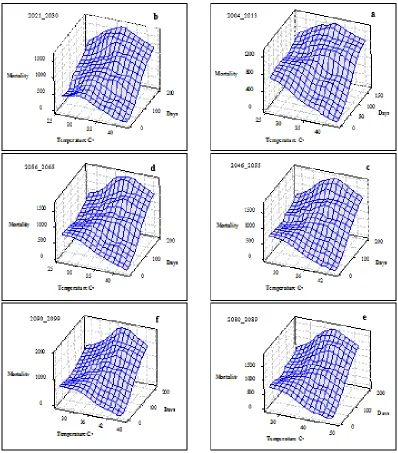
By increasing the temperature in the future, dec-ade's mortality will also increase. In Fig. 4, tem-perature, frequency (days) and number of mortal-ity are shown for the observed period (a) and the future decades (b to f). In the observed period, max temperature was 43 °C, maximum frequency was recorded in 34 °C, and maximum mortality is seen at this temperature. For the future decades, in addition to the temperature increase the fre-quency of temperatures more than 26 °C
(thre-shold temperature) has also increased which made the increase of mortality. Maximum in-creases will be seen for 2080-2090 such that the maximum estimation is 47 °C (e) which leads to the highest rate of mortality.
Discussion
Cardiovascular disease mortality in women is much smaller than men of less than 71 yr of age in study area, while for most of the developed countries this age is 45 yr (59-61). It seems to be the cause of this difference being lower standard of living and quality of life in the developing countries.
0 50 100 150 200 250
26 27 28 29 30 31 32 33 34 35 36 37 38 39 40 41 42 43 44 45 46 47 Temperature C◦
D
a
y
s
Iran J Public Health, Vol. 46, No.3, Mar 2017, pp. 396-407
Fig. 4: Mortality and frequency of hot days (above 26 °C), observed decade (a) and future decades (b-f)
Among men, CVD mortality increases rapidly after age of 30 yr and reaches to the highest mor-tality at the age of 71. In the age groups above 71, mortality among women increased significantly compared to men. Therefore, there are sex-related differences in cardiovascular disease mor-tality. This difference has been largely attributed to circulating estrogens present in women of fer-tile age. This explanation can be supported by epidemiological data that early menopause
occur-ring spontaneously or as a result of bilateral oo-phorectomy is associated with 4-7 fold elevation in the risk of CVD (63). However, other explana-tions for high male CVD mortality at young ages may well exist. Various CVD risk factors, such as smoking, heavy drinking or poor dietary habits accumulate in young men, perhaps to the degree that CVD ensues (63).
and cardiovascular disease mortality in Mashhad, Iran, during the years 2004-2013. The influence of the temperature (both minimum and maxi-mum) on mortality was confirmed. This relation-ship in many regions of the world is proven (64-67). In this study observed a strong and positive association between cardiovascular mortality and maximum temperature. While this relationship, was negative and weak but significant for mini-mum temperature. In this way, maximini-mum tem-perature was used for detailed review. The most researchers conducted in relation with the effect of thermal parameters on cardiovascular disease mortality have significantly emphasized this rela-tionship. This is while this relationship some-times has been in reverse direction regarding the rate of mortality due to other diseases such as respiratory diseases. For example, with the in-crease in the temperature, the rate of mortality reduces, and with the decrease in the tempera-ture, it rises (1).
According to Fig. 3 and 4, the number of days with temperatures above the threshold in the coming decades compared to the observed dec-ade increases. In addition, in the observed period, the highest frequency is related to 34 °C. In the 2021-2030 decade, the highest frequency is re-lated to the same temperature, but in the 2046-2055 and 2056-2065 periods also known as the “middle-future” periods, the highest temperature is related to 36 °C (as 2 °C increase). The predic-tion of the highest frequency is based on the 2080-2089 and 2090-2099 decades as future pe-riods, the temperature will be 38 °C. Further-more, the highest estimated temperature in the future decades compared to the observed period indicates 5 °C increase, which can be an impor-tant issue from the perspective of human beings‟ health.
High temperatures can increase the occurrence of heart attacks and strokes in susceptible pa-tients because of increased blood viscosity (68). Heat can induce events such as heart failure or stroke. Proposed mechanisms between heat and cardiovascular mortality include increased surface blood circulation and sweating. This leads to in-creased cardiac workload, dehydration and salt
depletion, haemoconcentration, elevated blood viscosity, and the risk of thrombosis (69) Moreo-ver, heat stress was suggested to induce the re-lease of interleukins modulating local and system-ic acute inflammatory responses (69). These in-flammatory responses can result in heart failure by increasing damage to heart tissue and inflam-mation (70). Significant increases in extreme heat are projected to continue in coming decades, consistent with observed global trends in past decades (71). The A2 scenario was selected to cover a wide range of temperature rise. This sce-nario family describes a very heterogeneous world. The use of other scenarios can provide the possibility of comparing and estimating diverse more conditions future. The underlying theme is self-reliance and preservation of local identities. Fertility patterns across regions converge very slowly, which results in continuously increasing global population. Economic development is primarily regionally oriented and per capita, eco-nomic growth and technological change are more fragmented and slower than in other storylines (59). In the next decades, temperature increases and the frequency of hot days will also increase. These results suggest that more CVD mortality can be expected in the future.
Limitations of study
The most important limitation of this study was the lack of long-term mortality data that led the observation period was limited to only one dec-ade. Therefore, we could not study the effects of climate change on mortality in the past decades (For example, the last half century) very well.
Conclusion
mor-Iran J Public Health, Vol. 46, No.3, Mar 2017, pp. 396-407
tality increases and these increases in the future decades. Therefore, necessary preventive meas-ures are required to mitigate temperature effects with greater attention to vulnerable group.
Ethical considerations
Ethical issues (Including plagiarism, informed consent, misconduct, data fabrication and/or fal-sification, double publication and/or submission, redundancy, etc.) have been completely observed by the authors.
Acknowledgments
This research received no grants from any fund-ing. The authors declare that there are no con-flicts of interest.
References
1. Parsons K (2014). Human thermal environments: the effects of hot, moderate, and cold environments on human health, comfort, and performance. ed. Crc Press.
2. Meade MS (2010). Medical geography. ed. Wiley Online Library.
3. Woodward A (2014). Heat, cold and climate change. J Epidemiol Community Health, 68:595-596.
4. McMichael AJ, Wilkinson P, Kovats RS, Pattenden S, Hajat S, Armstrong B, Vajanapoom N, Niciu EM, Mahomed H, Kingkeow C (2008). International study of temperature, heat and urban mortality: the „ISOTHURM‟project. Int J Epidemiol,
37:1121-31.
5. Kovats RS, Hajat S (2008). Heat stress and public health: a critical review. Annu Rev Public Health, 29:41-55.
6. Baccini M, Kosatsky T, Analitis A, Anderson HR, D'Ovidio M, Menne B, Michelozzi P, Biggeri A (2011). Impact of heat on mortality in 15 European cities: attributable deaths under different weather scenarios. J Epidemiol Community Health, 65:64-70.
7. Almeida SP, Casimiro E, Calheiros J (2010). Effects of apparent temperature on daily
mortality in Lisbon and Oporto, Portugal.
Environ Health, 9:12.
8. Montero JC, Miron IJ, Criado JJ, Linares C, Díaz J (2013). Difficulties of defining the term,“heat wave”, in public health. Int J Environ Health Res, 23:377-379.
9. Zhang Y, Li S, Pan X, Tong S, Jaakkola JJ, Gasparrini A, Guo Y, Wang S (2014). The effects of ambient temperature on cerebrovascular mortality: an epidemiologic study in four climatic zones in China. Environ Health, 13:24.
10. Analitis A, Katsouyanni K, Biggeri A, Baccini M, Forsberg B, Bisanti L, Kirchmayer U, Ballester F, Cadum E, Goodman P (2008). Effects of cold weather on mortality: results from 15 European cities within the PHEWE project. Am J Epidemiol, 168:1397-1408. 11. Braga AL, Zanobetti A, Schwartz J (2002). The
effect of weather on respiratory and cardiovascular deaths in 12 US cities. Environ Health Perspect, 110:859-863.
12. Curriero FC, Heiner KS, Samet JM, Zeger SL, Strug L, Patz JA (2002). Temperature and mortality in 11 cities of the eastern United States. Am J Epidemiol, 155:80-87.
13. Hajat S, Armstrong BG, Gouveia N, Wilkinson P (2005). Mortality displacement of heat-related deaths: a comparison of Delhi, Sao Paulo, and London. Epidemiology, 16:613-620. 14. Medina-Ramón M, Schwartz J (2007).
Temperature, temperature extremes, and mortality: a study of acclimatisation and effect modification in 50 US cities. Occup Environ Med, 64:827-833.
15. Tong S, Ren C, Becker N (2010). Excess deaths during the 2004 heatwave in Brisbane, Australia. Int J Biometeorol, 54:393-400.
16. Vaneckova P, Bambrick H (2013). Cause-specific hospital admissions on hot days in Sydney, Australia. PloS one, 8(2):e55459.
17. Goggins WB, Chan E, Yang C, Chong M (2013). Associations between mortality and meteorological and pollutant variables during the cool season in two Asian cities with sub-tropical climates: Hong Kong and Taipei.
Environ Health, 12:59.
temperature relationships. Sci Total Environ,
414:126-133.
19. Williams S, Nitschke M, Weinstein P, Pisaniello DL, Parton KA, Bi P (2012). The impact of summer temperatures and heatwaves on mortality and morbidity in Perth, Australia 1994–2008. Environ Int, 40:33-38.
20. Lindstrom SJ, Nagalingam V, Newnham HH (2013). Impact of the 2009 Melbourne heatwave on a major public hospital. Intern Med J, 43:1246-1250.
21. Nitschke M, Tucker GR, Hansen AL, Williams S, Zhang Y, Bi P (2011). Impact of two recent extreme heat episodes on morbidity and mortality in Adelaide, South Australia: a case-series analysis. Environ Health, 10:42.
22. Son J-Y, Lee J-T, Anderson G, Bell ML (2012). The impact of heat waves on mortality in seven major cities in Korea. Environ Health Perspect, 120:566-571.
23. Farajzadeh M, Darand M (2008). Analysis of air temperature influence on mortality in Tehran.
Hakim, 11:27-34 [In Persian].
24. Khanjani N, Bahrampour A (2013).
Temperature and cardiovascular and respiratory mortality in desert climate. A case study of Kerman, Iran. Iranian J Environ Health Sci Eng, 10(1):11.
25. Wichmann J, Andersen ZJ, Ketzel M, Ellermann T, Loft S (2011). Apparent temperature and cause-specific mortality in Copenhagen, Denmark: A case-crossover analysis. Int J Environ Res Public Health, 8:3712-3727.
26. Alwan A (2011). Global status report on noncommunicable diseases 2010. ed. World Health Organization.
http://www.who.int/nmh/publications/ncd _report_full_en.pdf
27. Urban A, Davídkovová H, Kyselý J (2014). Heat-and cold-stress effects on cardiovascular mortality and morbidity among urban and rural populations in the Czech Republic. Int J Biometeorol, 58:1057-1068.
28. Baccini M, Biggeri A, Accetta G, Kosatsky T, Katsouyanni K, Analitis A, Anderson HR, et al. (2008). Heat effects on mortality in 15 European cities. Epidemiology, 19:711-719. 29. Solomon S (2007). Climate change 2007-the physical
science basis: Working group I contribution to the fourth assessment report of the IPCC. ed. Cambridge University Press.
30. Sunyer J (2010). Geographical differences on the mortality impact of heat waves in Europe.
Environ Health, 9:38.
31. Parry ML (2007). Climate Change 2007: impacts, adaptation and vulnerability: contribution of Working Group II to the fourth assessment report of the Intergovernmental Panel on Climate Change. ed. Cambridge University Press.
32. Metz B, Davidson OR, Bosch PR, Dave R, Meyer LA (2007). Contribution of working group III to the fourth assessment report of the intergovernmental panel on climate change.
http://www.ipcc.ch/publications_and_data/ publications_ipcc_fourth_assessment_report _wg3_report_mitigation_of_climate_change. htm
33. Dessai S (2003). Heat stress and mortality in Lisbon Part II. An assessment of the potential impacts of climate change. Int J Biometeorol,
48:37-44.
34. El-Fadel M, Ghanimeh S (2013). Climate change and temperature rise in the Greater Beirut Area: implications on heat-related premature mortality. Reg Environ Change, 13:1059-1067. 35. Hayhoe K, Cayan D, Field CB, Frumhoff PC,
Maurer EP, Miller NL, Moser SC, Schneider SH, Cahill KN, Cleland EE, et al (2004). Emissions pathways, climate change, and impacts on California. Proc Natl Acad Sci U S A, 101:12422-7.
36. Hayhoe K, Sheridan S, Kalkstein L, Greene S (2010). Climate change, heat waves, and mortality projections for Chicago. J Great Lakes Res, 36:65-73.
37. Petkova EP, Horton RM, Bader DA, Kinney PL (2013). Projected heat-related mortality in the US urban northeast. Int J Environ Res Public Health, 10:6734-6747.
38. Hajat S, Vardoulakis S, Heaviside C, Eggen B (2014). Climate change effects on human health: projections of temperature-related mortality for the UK during the 2020s, 2050s and 2080s. J Epidemiol Community Health,
68:641-648.
Iran J Public Health, Vol. 46, No.3, Mar 2017, pp. 396-407
40. Peng RD, Tebaldi C, McDaniel L, Bobb J, Dominici F, Bell MD (2011). Toward a quantitative estimate of future heat wave mortality under global climate change. Environ Health Perspect, 119(5):701-6.
41. Eisfeld J (2014). International Statistical Classification of Diseases and Related Health Problems. Transgender Studies Quarterly,
1(12):107-110.
42. Racsko P, Szeidl L, Semenov M (1991). A serial approach to local stochastic weather models.
Ecol Model, 57:27-41.
43. Semenov MA, Barrow EM (1997). Use of a stochastic weather generator in the development of climate change scenarios.
Clim Change, 35:397-414.
44. Semenov MA, Brooks RJ, Barrow EM, Richardson CW (1998). Comparison of the WGEN and LARS-WG stochastic weather generators for diverse climates. Clim Res,
10:95-107.
45. Semenov MA (2008). Simulation of extreme weather events by a stochastic weather generator. Clim Res, 35:203-212.
46. Semenov MA, Stratonovitch P (2010). Use of multi-model ensembles from global climate models for assessment of climate change impacts. Clim Res, 41:1-14.
47. Chen H, Guo J, Zhang Z, Xu C-Y (2013). Prediction of temperature and precipitation in Sudan and South Sudan by using LARS-WG in future. Theor Appl Climatol, 113:363-375. 48. Iizumi T, Semenov MA, Nishimori M, Ishigooka
Y, Kuwagata T (2012). ELPIS-JP: a dataset of local-scale daily climate change scenarios for Japan. Philosophical Transactions of the Royal Society A: Mathematical. Philos Trans A Math Phys Eng Sci, 370:1121-1139.
49. 59. Richardson CW (1981). Stochastic simulation of daily precipitation, temperature, and solar radiation. Water Resour Res, 17:182-190. 50. Dian B, Gameda S, Hayhoe H (2008).
Performance of stochastic weather generators LARS-WG and AAFC-WG for reproducing daily extremes of diverse Canadian climates.
Clim Res, 37:17-33.
51. Wilby RL, Wigley T (1997). Downscaling general circulation model output: a review of methods and limitations. Prog Phys Geogr,
21:530-548.
52. Collins M, Tett S, Cooper C (2001). The internal climate variability of HadCM3, a version of the Hadley Centre coupled model without flux adjustments. Climate Dynam, 17:61-81. 53. Toews MW, Allen DM (2009). Evaluating
different GCMs for predicting spatial recharge in an irrigated arid region. J Hydrol,
374:265-281.
54. Girod B, Wiek A, Mieg H, Hulme M (2009). The evolution of the IPCC's emissions scenarios.
Environ Sci Policy, 12:103-118.
55. Mori S (2000). The development of greenhouse gas emissions scenarios using an extension of the MARIA model for the assessment of resource and energy technologies. Technol Forecast Soc Change, 63:289-311.
56. Houghton JT (1996). Climate change 1995: The science of climate change: contribution of working group I to the second assessment report of the Intergovernmental Panel on Climate Change. ed. Cambridge University Press.
57. Nakicenovic N, Swart R (2000). Special report on emissions scenarios. Special Report on Emissions Scenarios, Edited by Nebojsa Nakicenovic and Robert Swart, pp. 612. ISBN 0521804930. Cambridge, UK: Cambridge University Press, July 2000., 1.
58. D'Ippoliti D, Michelozzi P, Marino C, de'Donato F, Menne B, Katsouyanni K, Kirchmayer U, Analitis A, Medina-Ramón M, Paldy A, et al (2010). Research The impact of heat waves on mortality in 9 European cities: results from the EuroHEAT project. Environ Health, 9:37. 59. Kovats RS, Kristie LE (2006). Heatwaves and
public health in Europe. Eur J Public Health,
16:592-599.
60. de'Donato FK, Leone M, Noce D, Davoli M, Michelozzi P (2013). The impact of the February 2012 cold spell on health in Italy using surveillance data. PLoS One,
8(4):e61720.
61. Atsma F, Bartelink M-LE, Grobbee DE, van der Schouw YT (2006). Postmenopausal status and early menopause as independent risk factors for cardiovascular disease: a meta-analysis. Menopause, 13:265-279.
63. Anderson BG, Bell ML (2009). Weather-related mortality: how heat, cold, and heat waves affect mortality in the United States.
Epidemiology, 20:205-13.
64. Montero J, Mirón I, Criado J, Linares C, Díaz J (2010). Comparison between two methods of defining heat waves: a retrospective study in Castile-La Mancha (Spain). Sci Total Environ,
408:1544-1550.
65. Basagana X, Sartini C, Barrera-Gómez J, Dadvand P, Cunillera J, Ostro B, Sunyer J, Medina-Ramón M (2011). Heat waves and cause-specific mortality at all ages.
Epidemiology, 22(6):765-72.
66. Mirón Pérez IJ, Montero Rubio JC, Criado-Alvarez JJ, et al (2007). [Trends in effects of maximum temperatures on organic-cause mortality in Castile-La Mancha, Spain from 1975 to 2003]. Rev Esp Salud Publica,
81(4):375-85.
67. Keatinge WR, Coleshaw SR, Easton JC, Cotter F, Mattock MB, Chelliah R (1986). Increased platelet and red cell counts, blood viscosity, and plasma cholesterol levels during heat stress, and mortality from coronary and cerebral thrombosis. Am J Med, 81:795-800. 68. Näyhä S (2005). Environmental temperature and
mortality. Int J Circumpolar Health, 64:451-8. 69. Bouchama A, Knochel JP (2002). Heat stroke. N
Engl J Med, 346:1978-88.
70. Wilker EH, Yeh G, Wellenius GA, Davis RB, Phillips RS, Mittleman MA (2012). Ambient temperature and biomarkers of heart failure: a repeated measures analysis. Environ Health Perspect, 120:1083-7.