www.geosci-model-dev.net/3/475/2010/ doi:10.5194/gmd-3-475-2010
© Author(s) 2010. CC Attribution 3.0 License.
Geoscientific
Model Development
Multi-variate probability density functions with dynamics for cloud
droplet activation in large-scale models: single column tests
H. Guo1, J.-C. Golaz2, L. J. Donner2, V. E. Larson3, D. P. Schanen3, and B. M. Griffin3
1UCAR Visiting Scientist Programs, NOAA/Geophysical Fluid Dynamics Laboratory, Princeton, NJ, USA 2NOAA/Geophysical Fluid Dynamics Laboratory, Princeton, NJ, USA
3University of Wisconsin-Milwaukee, Milwaukee, WI, USA
Received: 27 April 2010 – Published in Geosci. Model Dev. Discuss.: 11 May 2010 Revised: 30 August 2010 – Accepted: 22 September 2010 – Published: 8 October 2010
Abstract. Successful simulation of cloud-aerosol interac-tions (indirect aerosol effects) in climate models requires re-lating grid-scale aerosol, dynamic, and thermodynamic fields to small-scale processes like aerosol activation. A turbulence and cloud parameterization, based on multi-variate probabil-ity densprobabil-ity functions of sub-grid vertical velocprobabil-ity, tempera-ture, and moistempera-ture, has been extended to treat aerosol acti-vation. Multi-variate probability density functions with dy-namics (MVD PDFs) offer a solution to the problem of the gap between the resolution of climate models and the scales relevant for aerosol activation and a means to overcome the limitations of diagnostic estimates of cloud droplet number concentration based only on aerosol concentration.
Incorporated into the single-column version of GFDL AM3, the MVD PDFs successfully simulate cloud proper-ties including precipitation for cumulus, stratocumulus, and cumulus-under-stratocumulus. The extension to treat aerosol activation predicts droplet number concentrations in good agreement with large eddy simulations (LES). The droplet number concentrations from the MVD PDFs match LES results more closely than diagnostic relationships between aerosol concentration and droplet concentration.
In the single-column model simulations, as aerosol con-centration increases, droplet concon-centration increases, precip-itation decreases, but liquid water path can increase or de-crease.
Correspondence to: H. Guo
1 Introduction
The diversity of climate sensitivity among current model pro-jections is explained in part by low-level clouds, and mod-els probably fail to include processes which could introduce further uncertainty (Webb et al., 2006; Forster et al., 2007). Cloud-aerosol interactions are an important aspect of the role of low clouds in climate sensitivity (Heintzenberg and Charl-son, 2009), and are also a major source of uncertainty in cli-mate projections (Kiehl, 2007).
A key bridge between clouds and aerosols is aerosol acti-vation. Aerosol activation depends on local super-saturation and hence vertical velocity at scales far below those resolved in climate models with horizontal spacing of ∼100 km. Due to the significant sub-grid variability in vertical veloc-ity (Leary and Houze, 1980; Donner et al., 1999; Stevens et al., 2005) and the nonlinear dependence of aerosol acti-vation on vertical velocity, using average fields at the coarse resolution of climate models for aerosol activation is highly problematic.
combine this dynamic variability with thermodynamic vari-ability (e.g., temperature and moisture) in a self-consistent fashion.
Multi-variate probability density functions with dynamics (MVD PDFs) are a potential solution to the problem of the gap between the resolution of climate models and the scales relevant for aerosol activation. The main purpose of this pa-per is to link aerosol activation to the MVD PDFs. In addi-tion to using the PDF of vertical velocity directly for aerosol activation, we further incorporate the turbulent transport of cloud droplet number concentration (Nd) and couple with a two-moment microphysics scheme (Morrison and Gettel-man, 2008; Salzmann et al., 2010). Nd is predicted via a budget equation (Ghan et al., 1997; Lohmann et al., 1999; Ming et al., 2007; Morrison and Gettelman, 2008).
This paper evaluates the performance of the MVD PDFs in the framework of the single column model (SCM) of GFDL atmospheric general circulation model (AM3) (Don-ner et al., 2010), because the SCM configuration is an effi-cient framework for implementing and performing the initial evaluations of new physical packages and avoids the com-plexity of a full general circulation model (GCM) (Randall et al., 1996). The source code for the MVD PDFs is re-ferred to as CLUBB (Cloud Layers Unified By Binormals) (http://clubb.larson-group.com). We interfaced the GFDL SCM to CLUBB, and hereafter refer to it as GFDL SCM-CLUBB. Our main goals are twofold: (1) to improve simu-lations of boundary layer and associated clouds in the GFDL SCM through the use of the MVD PDFs, and (2) to extend the MVD PDFs to activate aerosols. The latter is a novel ap-plication of the MVD PDFs, whose success is critical for its use in parameterizing aerosol-cloud interactions in GCMs.
The paper is organized as follows. Section 2 describes the incorporation of the prognostic treatment of cloud droplet number concentration and microphysics. Section 3 shows simulations of representative cloud cases and evaluates them against large eddy simulations (LES) and available observa-tions. Section 4 provides conclusions. The appendix presents lower resolution simulations.
2 Prognostic equation for droplet number concentration
The MVD PDFs are unique in that they predict the joint dis-tribution of temperature, water mass, and vertical velocity. The distribution of vertical velocity is then a natural link to aerosol activation. So the MVD PDFs have precisely the information needed to consistently diagnose the activation. The significance of sub-grid variation of vertical velocity is evident, especially when the grid mean vertical velocity is negative or zero, but both small-scale upward and downward motions are present. For example, stratocumulus regimes occur in environments of large-scale subsidence, but only small-scale updrafts activate cloud droplets.
The GFDL AM3 has incorporated a mechanistic aerosol activation scheme developed by Ming et al. (2006), which diagnoses the concentration of activated droplet numbers
Nact(w) as a function of vertical velocity w and aerosol characteristics and concentration. The aerosol activation scheme provides an initial cloud droplet number concen-tration. Cloud droplets are also subject to turbulent trans-port and/or mixing, evaporation, collision and/or coales-cence, and other physical processes. To explore the effects of aerosols on low-level clouds, we have further incorpo-rated the treatment of turbulent transport and/or mixing of the cloud droplet number concentration, and coupled with two-moment microphysics. The prognostic equation for the droplet number concentration is as follows:
∂Nd
∂t = −w
∂Nd
∂z −
∂ ∂zw
0N0
d+S−A−C−E (1) whereNd is the layer-averaged droplet number concentra-tion,w∂Nd
∂z is the large-scale transport of cloud droplets and
w is an imposed large-scale vertical velocity, ∂z∂w0N0 d is the turbulent transport of cloud droplets (Ovtchinnikov and Ghan, 2005),Sdenotes a droplet source term due to aerosol activation, andA,C, andEdenote droplet sink terms due to autoconversion, collection by rain, and evaporation, respec-tively.
A droplet source term due to aerosol activation,S, is ex-pressed as the difference between number concentration of droplets that can be activated and pre-existing droplet num-ber concentration (Stevens et al., 1996; Ghan et al., 1997; Lohmann et al., 1999), that is,
S=max(Nact−Nd,0)/1t (2)
where1t is the host SCM time step, andNact is the layer-averaged droplet number concentration due to the activa-tion process. For pre-existing clouds, new droplets form if the number of activated droplets,Nact, exceeds the existing dropletsNd.
Since the activation process occurs only within saturated updrafts, and since the saturation (i.e., cloudiness) can be di-agnosed based on the PDF of liquid potential temperature (θl) and total water content (qt) for clouds, we integrate over the joint PDF to calculateNact, i.e.,
Nact=
Z w Z θl Z qt
sub-grid variability, e.g., by applying to cloudy regions after normalizing by cloud fraction, sub-columns (Pincus et al., 2006), or Latin hyper-cube sampling (Larson et al., 2005).
Cloud droplet sinks due to autoconversion (A) and col-lection (C) are assumed to be linearly proportional to warm cloud mass sinks due to the corresponding processes (Morri-son and Gettelman, 2008). Evaporation,E, is assumed to be linearly proportional to the changes in cloud fraction (CF) as follows:
A= −min Nd
qc
1q
c
1t
auto
,0
!
(4)
C= −min Nd
qc
1q
c
1t
accr
,0
!
(5)
E= −min Nd
CF
1CF
1t ,0 !
. (6)
Morrison and Gettelman (2008) two-moment microphysics is applied to temperature, moisture, and cloud droplet con-centrations averaged over the cloudy portion of the MVD PDFs (e.g., Eq. 3). The vertical spacing is ∼40 m in the lowest 2 km of the atmosphere (Fig. A1), and there are 101 vertical levels from the surface to the top of the atmosphere (∼40 km). The time steps are 3 min for both the MVD PDFs and the host SCM. Note that the effects of reducing resolu-tion are discussed in the Appendix.
3 Simulation results
To a large extent, boundary layer moist convection can be divided into three main regimes: a deep planetary boundary layer with a small cloud fraction capped by a weak inver-sion, a shallow planetary boundary layer with a high cloud fraction capped by a strong inversion, and an intermediate one (Stevens et al., 2001). Here we show simulations cor-responding to these representative regimes. We select cloud cases that have been studied by the Global Energy and Wa-ter Exchange Cloud System Study (GCSS) Boundary Layer Cloud Working Group (BLCWG). They are well-established benchmarks to evaluate parameterizations and cloud models. We have investigated three observationally non-precipitating cases:
– a trade-wind cumulus case during the Barbados Oceanographic and Meteorological Experiment (BOMEX) (Siebesma, et al., 2003),
– a non-drizzling marine stratocumulus case during the First Research Flight (RF01) of the Second Dynamics and Chemistry of Marine Stratocumulus Field Study (DYCOMS-II) (Stevens et al., 2005),
– a cumulus-under-stratocumulus case during the Atlantic Trade Wind Experiment (ATEX) (Stevens et al., 2001),
Fig. 1. Time series of liquid water path (LWP) for BOMEX in (a),
RF01 in (b), ATEX in (c), RICO in (d), and RF02 in (e) at dif-ferent sulfate aerosol mass concentrations (ma). The time series
from the MVD PDFs begin from the first hour when microphysics is activated. The solid and dotted curves are overlapped in (c) be-cause the changes in LWP are small whenmaincreases from 1.0 to
5.0 µg m−3in ATEX. Shaded areas in (a), (b), (c), and (e) indicate the ranges of the LES ensemble. The shaded area in (d) indicates the LWP ranges of S-S LES averaged over the last 4 h. Dots in (e) indicate approximate measurement ranges for RF02 (Stevens et al., 2003).
and two observationally precipitating cases:
– the Rain In Cumulus over the Ocean (RICO) (Stevens and Seifert, 2008),
– the Second Research Flight (RF02) of DYCOMS-II (Ackerman et al., 2009).
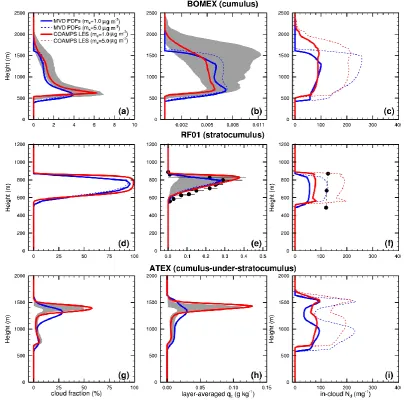
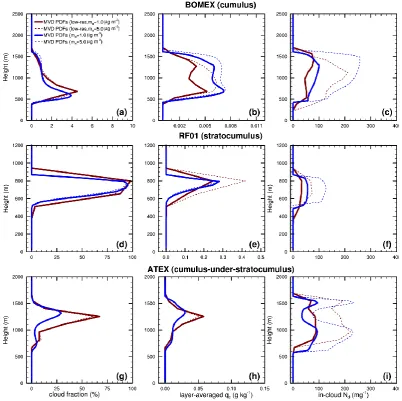
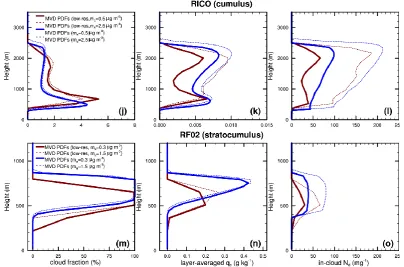
Fig. 2. Comparison of cloud fraction, layer-averaged cloud water content (qc), and in-cloud cloud droplet number concentration (Nd) from
the MVD PDFs (blue) and from COAMPS LES and S-S LES (red) at different sulfate concentrations (ma), averaged over the last 3 h for
BOMEX, last 2 h for RF01, last 5 h for ATEX, last 5 h for RICO, and last 4 h for RF02, corresponding to the periods for LES in Siebesma et al. (2003), Stevens et al. (2005), Stevens et al. (2001), Stevens and Seifert (2008), and Ackerman et al. (2009), respectively. The red solid and dotted curves are overlapped in (a), (b), (d), (e), (g), and (h) because the microphysics was not considered in COAMPS LES following a protocol established by GCSS for non-precipitating clouds. Shaded areas indicate the upper and lower bounds of the LES ensemble. Dots in (e) indicate averages of observedqc, with horizontal bars indicating the first and third quartiles of the observed values (Zhu et al., 2005).
Dots in (f), (l), (o) indicate averages of observedNd(vanZanten et al., 2005; Stevens and Seifert, 2008).
Our SCM-CLUBB simulations are subject to the same ini-tial conditions and large-scale forcings as the LES models (Stevens et al., 2001, 2005; Siebesma et al., 2003; Stevens and Seifert, 2008; Ackerman et al., 2009). This allows for a careful evaluation of SCM simulations against the LES. Be-cause the LES can explicitly resolve most energy-carrying eddies, they are often used as benchmark simulations. In this study, we use COAMPS1LES (Golaz et al., 2005), which is
1COAMPS is a registered trademark of the Naval Research
Laboratory
derived from the COAMPS meso-scale model (Hodur, 1997). The COAMPS LES model has been modified to include an anelastic pressure solver and to add cloud droplet number concentration as a prognostic variable with the aerosol acti-vation scheme developed by Ming et al. (2006). For RICO, we use the LES results in Stevens and Seifert (2008, hereafter referred to as S-S LES).
The size distribution for sulfate is
N (lnD)= N1
(2π )1/2lnσ1
exp −(lnD−lnDg,1)
2
2ln2σ1
Fig. 2. Continued.
+ N2
(2π )1/2lnσ 2
exp −(lnD−lnDg,2)
2
2ln2σ2
!
whereN1:N2=17:3, Dg,1=0.01 µm, σ1=1.6, Dg,2= 0.15 µm, σ2=2.0. To examine aerosol indirect effects, we present results using sulfate aerosol mass concentrations of 1.0 and 5.0 µg m−3for BOMEX, RF01, and ATEX; 0.5 and 2.5 µg m−3 for RICO; and 0.3 and 1.5 µg m−3 for RF02. For RF02, 0.3 µg m−3 is obtained by integrating the sul-fate size distribution in Ackerman et al. (2009). Specifying 5.0 and 0.5 µg m−3 for RF01 and RICO, respectively, pro-duces droplet number concentrations close to observed val-ues (Fig. 2f and l). For droplet number, alternative parame-terizations, including the diagnostic approach and the mech-anistic approach with fixed vertical velocity variances, are examined and compared to the mechanistic approach with prognostic vertical velocity variances here.
CLUBB requires about an hour to spin-up PDFs of verti-cal velocity, which are critiverti-cal for determining droplet num-ber. Unrealistically low droplet numbers from unrealistically low vertical velocities during the spin-up period, distort all microphysical processes (e.g., precipitation) that depend on droplet number. Thus, the microphysics parameterization is not activated until one hour. In implementation in a free-standing large-scale model, this issue will not be relevant af-ter model spin-up.
In the remainder of this section, we show simulations of liquid water path, cloud fraction, cloud droplet number con-centrations, and vertical velocities using the GFDL
SCM-CLUBB, with aerosol activation and microphysics coupled as described in Sect. 2. Successful CLUBB simulations of cloud fraction and cloud liquid without aerosol activation or precipitation have been reported previously (Golaz et al., 2002b, 2007; Wyant et al., 2007). This section presents the first results on the effects of aerosols and precipitation on cloud fraction and cloud liquid using CLUBB and the first re-sults on cloud droplet number concentrations obtained from CLUBB vertical velocities. In Sect. 3.3, we will contrast the MVD PDFs of vertical velocity with those using cur-rent state-of-the-science methods. Note that since the ver-tical velocity PDFs are crucial to the determination of cloud droplet number concentrations and precipitation, the results presented in Sects. 3.1 and 3.2 depend on vertical velocity PDFs.
3.1 Micro- and macrophysical properties
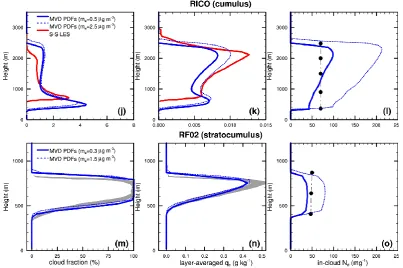
Fig. 3. Profiles of in-cloud droplet number concentrations (Nd) at
sulfate concentrations (ma) of 1.0 µg m−3in (a), (c), and (e), and
of 5.0 µg m−3 in (b), (d), and (f), averaged over the last 3 h for BOMEX in (a) and (b), last 2 h for RF01 in (c) and (d), and last 5 h for ATEX in (e) and (f).
Liquid water paths increase at high aerosol concentra-tions in the shallow cumulus cases BOMEX and RICO. The stratocumulus case, RF01, behaves differently, with slightly smaller liquid water paths at high aerosol concentrations. The liquid water path is also slightly smaller at high aerosol concentration in ATEX with both shallow cumulus and stra-tocumulus (Table 1). After case-dependent initial spin-up, the integrations are nearly steady. Some high-frequency os-cillations are evident in RICO but only at low aerosol con-centration.
These five cases are consistent with the range of responses to changing aerosol concentrations discussed in the scien-tific literature and show the potential utility of the MVD PDFs to discern different types of cloud-aerosol interactions. The shallow cumulus cases are consistent with the second aerosol indirect effect, in which increases in droplet number at high aerosol concentration inhibit precipitation, resulting in more cloud liquid (e.g., Albrecht, 1989). The
stratocu-Table 1. The surface precipitation rate (Precip. rate), liquid water
path (LWP), and cloud optical depth (τ) at different sulfate aerosol mass concentrations (ma, µg m−3) from the GFDL SCM-CLUBB
simulations.
ma Precip. rate LWP τ
(µg m−3) (mm day−1) (g m−2)
BOMEX 1.0 0.11 6.2 0.8
5.0 0.02 7.6 1.3
RF01 1.0 0.003 41.0 5.9
5.0 0.0009 38.8 7.3
ATEX 1.0 0.002 14.1 2.3
5.0 0.0004 13.9 3.1
RICO 0.5 0.21 11.4 1.3
2.5 0.06 13.6 1.9
RF02 0.3 0.14 110.7 12.3
1.5 0.05 110.3 15.3
Averages from the first hour (when the microphysics is activated) to the end of the simulations.
mulus cases exhibit behavior consistent with Ackerman et al. (2004) and Bretherton et al. (2007), in which increased evaporation of cloud liquid at high aerosol concentration acts to reduce cloud liquid. The latter mechanism is especially ef-fective when the relative humidity above the inversion is low. The relative humidity above the inversion in RF01 is 10%.
More obviously, increased drop numbers and smaller drop size act to increase cloud optical depths (τ) through the first aerosol indirect effect (Table 1). As aerosol concentrationma increases by a factor of 5, cloud albedo (αc) increases from 0.43 to 0.49 for RF01, if we approximateαcas a function of
τ,αc=τ+τ7.7 for non-absorbing and homegeneous clouds, following Lacis and Hansen (1974).
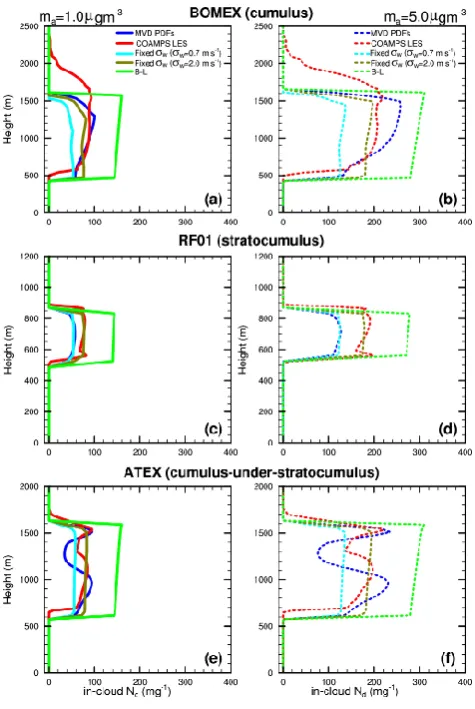
Fig. 4. Probability density function (PDF) of vertical velocity (w) in cloudy regions, clear regions, and whole sky (cloudy + clear regions) averaged over the same periods as in Fig. 3, for BOMEX in (a), (b), and (c), RF01 in (d), (e), and (f), and ATEX in (g), (h), and (i).zand zLESrefer to the cloud base heights from the MVD PDFs and from COAMPS LES, respectively.
the MVD PDFs successfully reproduce trade-wind cumulus clouds with a small cloud fraction and layer-averaged liquid water content. In the RF01 and RF02 stratocumulus cases, the MVD PDFs simulate a shallow boundary layer and a solid cloud deck. In the cumulus-under-stratocumulus ATEX case, a cumulus layer is present from 600 m to 1100 m, and the cloud fraction increases to about 30% at cloud top.
This agreement is important, as it establishes the general credibility of the MVD PDFs and supports the argument that the PDFs of droplet number and vertical velocity, for which observations are not readily available, are also reasonable. Observations of drop numbers can be reproduced well by the MVD PDFs and LES for specified aerosol concentrations (Fig. 2f, l, and o).
3.2 Alternate parameterizations of droplet number
As discussed above, aerosols can exert significant impacts on cloud micro- and macrophysical properties by influenc-ing the droplet concentration,Nd. We have also calculated
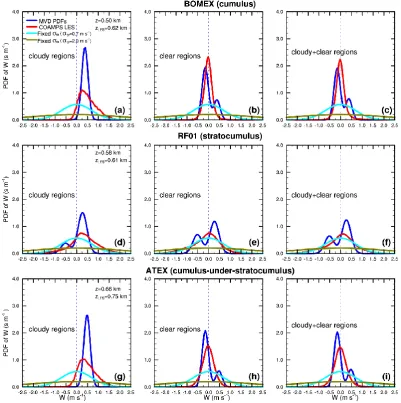
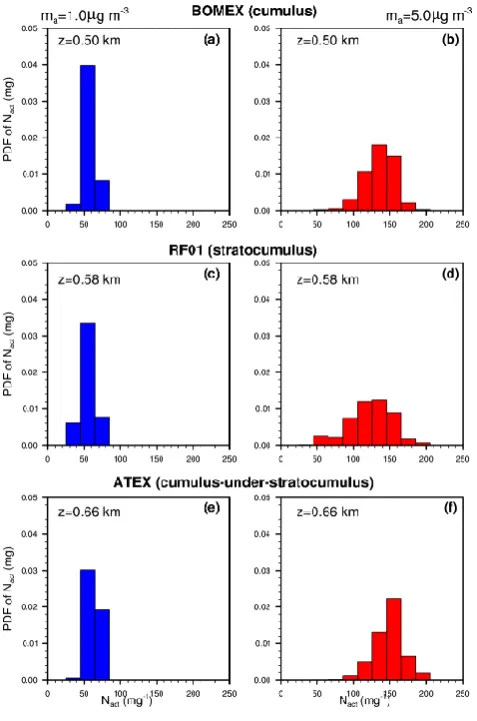
Fig. 5. Probability density function (PDF) ofNactat different
sul-fate concentrations (ma) near cloud bases averaged over the same
periods as in Fig. 2 for BOMEX in (a) and (b), RF01 in (c) and (d), ATEX in (e) and (f), RICO in (g) and (h), and RF02 in (i) and (j).
usually imposed onσw and often dominatesσw. We setσw to beσmin, and setσminto be 0.7 or 2.0 m s−1in our sensi-tivity tests. The value of 0.7 m s−1is used in the GFDL AM3 (Donner et al., 2010). We hereafter refer to this alternate as fixedσw. The second alternate method uses an empirical relationship betweenNdand the sulfate mass concentration following Boucher and Lohmann (1995), hereafter referred to as B-L.
The profiles of the in-cloud droplet number concentration averaged over the last 3 h for BOMEX, last 2 h for RF01, and last 5 h for ATEX are presented in Fig. 3. With the increase ofma by a factor of 5,Nd is enhanced by a factor of∼2, indicating the greater competition for water at a higherma. The in-cloudNdis almost constant with height in the sensi-tivity tests of fixedσwand B-L, mainly becausemaandσw are constant with height. Compared to the COAMPS LES results, the sensitivity tests of fixedσwwithσw=0.7 m s−1 underestimateNd. This underestimation can be alleviated
Fig. 5. Continued.
Fig. A1. Vertical distribution of grid levels for the GFDL
SCM-CLUBB using the multi-variate probability density functions with dynamics (MVD PDFs) at lower (brown) and higher (blue) resolu-tions.
by enhancing σw. When σw is enhanced to 2.0 m s−1, Nd agrees well with the LES results. The tests of B-L overesti-mateNd. This overestimation has also been found by other model studies (Ghan et al., 1997). Although using a fixed
Fig. A2. Similar to Fig. 2 but at different resolutions.
3.3 PDFs ofwandNact
Sub-grid variability of vertical velocity is critical for aerosol activation. To illustrate this variability, we show the PDF of the vertical velocity (w) around the level of cloud base in cloudy regions, clear regions, and whole sky (Fig. 4).
Aerosol activation is controlled by the PDF ofwin cloudy regions. The mean vertical velocity is positive in cloudy re-gions in both the MVD PDFs and the COAMPS LES, but not in clear regions. The different features of w between cloudy and clear regions show thatwis correlated with tem-perature and moisture. Over the whole sky (cloudy + clear regions),wis positively skewed in BOMEX (Fig. 4c). The positive skewness is characteristic of cumulus clouds, with updraft cores surrounded by a large area of weak downdrafts (LeMone, 1989; Moeng and Rotunno, 1990). A single
Gaus-sion distribution is unable to represent the skewness. PDFs from aircraft data have shown that some PDFs are correlated and skewed (Larson et al., 2002).
Regardless of specified variance, the fixed-variance σw distribution differs strongly from both the LES distributions and the MVD PDFs in clear and cloudy regions. The MVD PDFs with a single peak tend to be narrower than the LES distributions (Fig. 4a and g), and the MVD PDFs of compa-rable width to the LES distributions are characterized by sec-ondary peaks. The MVD PDFs and LES distributions agree substantially better than the fixed-variance and LES distribu-tions do.
Fig. A2. Continued.
fixed-variance distribution compensate each other. The fat tail of positive updrafts allows more activation than the LES distribution, but its zero mean allows less.
To illustrate the impact of the sub-grid variability of the vertical velocity on aerosol activation, we show the PDF of the activated droplet number concentrationNact near cloud bases (Fig. 5). As expected, for a smaller ma, Nact peaks around a smaller value. For example, Nact peaks around 35 and 150 mg−1forma=0.3 and 5.0 µg m−3, respectively. The PDFs ofNact illustrate that droplets are not uniformly distributed. Although we do not do so, these PDFs could be used in microphysics and radiative transfer to take the sub-grid variability of droplet concentrations into account using sub-columns for different members of the PDF ofNd(Pincus et al., 2006), or sampling (Larson et al., 2005).
4 Conclusions
Results using MVD PDFs of moisture, temperature, and ver-tical velocity to parameterize cloud fraction, condensate, and droplet number concentration are promising. We have exam-ined five representative cloud cases, which span many moist boundary layer regimes. The cloud profiles from the MVD PDFs agree well with those from LES and available obser-vations. This good agreement has been achieved without any case-specific adjustments. The uniform treatment of the planetary boundary layer should benefit global simulations where a variety of regimes exist. Moreover, for the first time,
the successful simulation of cloud droplet number concentra-tion from the MVD PDFs has been achieved.
With the coupling to a two-moment microphysics, the predicted droplet number concentration is allowed to influ-ence cloud microphysics. As aerosol mass concentration in-creases, droplet concentration increases and precipitation de-creases. Liquid water path can either increase or decrease, consistent with established conceptual models and LES. Ver-tical velocities produced by the MVD PDFs successfully cap-ture the skewed character frequently associated with bound-ary layers.
Appendix A
Lower-resolution SCM-CLUBB simulations
To explore the consequence of lower vertical resolution, we have conducted lower resolution simulations with 67 vertical levels and vertical spacing of ∼150 m in the lowest 2 km (Fig. A1). The vertical levels for the MVD PDFs and for the host SCM coincide. The time steps are 5 min and 30 min for the MVD PDFs and the host SCM, respectively.
Figure A2 shows the cloud profiles of five representative cases using different resolutions. In many cases, the lower and higher resolution results are qualitatively similar, though less so for cases observed to be precipitating. For BOMEX, RF01, and RICO, the cloud fraction and cloud water content agree well between the lower and higher resolution simula-tions. For ATEX, cloud fraction is over-predicted, and two cloud layers are less distinct. For RF02, the cloud layers at lower resolution are lower with less cloud liquid. System-atically, drop numbers are lower, evidently the result of de-graded vertical velocity PDFs at lower resolution.
Although the lower resolution SCM-CLUBB simulations are not quantitatively as accurate as the higher resolution simulations, they, nonetheless, are able to capture the ma-jor properties of cumulus and stratocumulus regimes. When implementing the MVD PDFs in large-scale models, reduced accuracy at lower resolution would be balanced against com-putational cost. It is difficult based on the SCM cases to yet assess the necessary resolution for the MVD PDFs in large-scale models.
Acknowledgements. H. Guo is supported by the grant GC08-249,
Climate Prediction Program for the Americas (CPPA), NOAA Climate Program Office. V. E. Larson, D. P. Schanen, and B. M. Griffin acknowledge support by grant ATM-0936186 from the National Science Foundation and by grant NA09OAR4310123 from NOAA.
Edited by: O. Boucher
References
Ackerman, A. S., Kirkpatrick, M. P., Stevens, D. E., and Toon, O. B.: The impact of humidity above stratiform clouds on indirect aerosol climate forcing, Nature, 432, 1014–1017, 2004. Ackerman, A. S., VanZanten, M. C., Stevens, B., et al.: Large-eddy
simulations of a drizzling, stratocumulus-topped marine bound-ary layer, Mon. Weather Rev., 137, 1083–1110, 2009.
Albrecht, B. A.: Aerosols, cloud microphysics, and fractional cloudiness, Science, 243, 1227–1230, 1989.
Boucher, O. and Lohmann, U.: The sulfate-CCN-cloud albedo ef-fect: A sensitivity study with two general circulation models, TELLUS, 47B, 281–300, 1995.
Bretherton, C. S., Blossey, P. N., and Uchida, J.: Cloud droplet sedimentation, entrainment efficiency, and subtropi-cal stratocumulus albedo, Geophys. Res. Lett., 34, L03813, doi:10.1029/2006GL027648, 2007.
Chuang, C. C., Penner, J. E., Taylor, K. E., Grossman, A. S., and Walton, J. J.: An assessment of the radiative effects of anthro-pogenic sulfate, J. Geophys. Res., 102(D3), 3761–3778, 1997. Donner, L. J., Seman, C. J., and Hemler, R. S.: Three-dimensional
cloud-system modeling of GATE convection, J. Atmos. Sci., 56, 1885–1912, 1999.
Donner, L. J., Wyman, B. L., Hemler, R. S., et al.: The dynamical core, physical parameterizations, and basic simulation character-istics of the atmospheric component of the GFDL global coupled model CM3, J. Climate, submitted, 2010.
Forster, P., Ramaswamy, V., Artaxo, P., et al.: Changes in At-mospheric Constituents and in Radiative Forcing, in: Climate Change 2007: The Physical Science Basis, Contribution of Working Group I to the Fourth Assessment Report of the Inter-governmental Panel on Climate Change, edited by: Solomon, S., Qin, D., Manning, M., Chen, Z., Marquis, M., Averyt, K. B., Tignor, M., and Miller, H. L., Cambridge University Press, Cam-bridge, United Kingdom and New York, NY, USA, 2007. Ghan, S. J., Leung, L. R., Easter, R. C., and Abdul-Razzak, H.:
Pre-diction of cloud droplet number in a general circulation model, J. Geophys. Res., 102, 21777–21794, 1997.
Golaz, J.-C., Larson, V. E., and Cotton, W. R.: A PDF based model for boundary layer clouds. Part I: Method and model description, J. Atmos. Sci., 59, 3540–3551, 2002a.
Golaz, J.-C., Larson, V. E., and Cotton, W. R.: A PDF based model for boundary layer clouds. Part II: Model results, J. Atmos. Sci., 59, 3552–3571, 2002b.
Golaz, J.-C., Wang, S., Doyle, J. D., and Schmidt, J. M.: COAMPS®-LES: Model evaluation and analysis of second and
third moment vertical velocity budgets, Bound.-Layer Meteor., 116, 487–517, 2005.
Golaz, J.-C., Larson, V. E., Hansen, J. A., Schanen, D. P., and Grif-fin, B. M.: Elucidating model inadequacies in a cloud param-eterization by use of an ensemble-based calibration framework, Mon. Weather Rev., 135, 4077–4096, 2007.
Heintzenberg, J. and Charlson, R. J.: Clouds in the perturbed cli-mate system, MIT press, 2009.
Hodur, R. M.: The Naval Research Laboratory’s Coupled Ocean/Atmosphere Mesoscale Prediction System (COAMPS), Mon. Weather Rev., 125, 1414–1430, 1997.
Kiehl, J. T.: Twentieth century climate model response and climate sensitivity, Geophys. Res. Lett., 34, L22710, doi:10.1029/2007GL031383, 2007.
Lacis, A. A. and Hansen, J. E.: A parameterization for the absorp-tion of solar radiaabsorp-tion in the earth’s atmosphere, J. Atmos. Sci., 31, 118–133, 1974.
Lappen, C.-L. and Randall, D. A.: Toward a unified parameteriza-tion of the boundary layer and moist convecparameteriza-tion. Part I: A new type of mass-flux model, J. Atmos. Sci., 58, 2021–2036, 2001. Larson, V.-E, Golaz, J.-C., and Cotton, W. R.: Small-scale and
mesoscale variability in cloudy boundary layers: Joint probabil-ity densprobabil-ity function, J. Atmos. Sci., 59, 3519–3539, 2002. Larson, V. E. and Golaz, J.-C.: Using probability density
func-tions to derive consistent closure relafunc-tionships among higher-order moments, Mon. Weather Rev., 133, 1023–1042, 2005. Larson, V. E, Golaz, J.-C., Jiang, H., and Cotton, W. R.:
Leary, C. A. and Houze Jr., R. A.: The contribution of mesoscale motions to the mass and heat fluxes of an intense tropical con-vective system, J. Atmos. Sci., 37, 784–796, 1980.
LeMone, M. A.: Some observations of vertical velocity skewness in the convective planetary boundary layer, J. Atmos. Sci., 47, 1163–1169, 1989.
Lohmann, U., Feichter, J., Chuang, C. C., and Penner, J. E.: Pre-diction of the number of cloud droplets in the ECHAM GCM, J. Geophys. Res., 104, 9169–9198, 1999.
Mellor, G. L.: The Gaussian cloud model relations, J. Atmos. Sci., 34, 356–358, 1977.
Moeng, C.-H. and Rotunno, R.: Vertical-velocity skewness in the buoyancy-driven boundary layer, J. Atmos. Sci., 47, 1149–1162, 1990.
Ming, Y., Ramaswamy, V., Donner, L. J., and Phillips, V. T. J.: A new parameterization of cloud droplet activation applicable to General Circulation Models, J. Atmos. Sci., 63, 1348–1356, 2006.
Ming, Y., Ramaswamy, V., Donner, L. J., Phillips, V. T. J., Klein, S. A., Ginoux, P. A., and Horowitz, L. W.: Modeling the interac-tions between aerosol and liquid water clouds with a self-consist cloud scheme in a General Circulation Model, J. Atmos. Sci., 64, 1189–1209, 2007.
Morrison, H. and Gettelman, A.: A new two-moment bulk strati-form cloud microphysics scheme in the Community Atmosphere Model, Version 3 (CAM3). Part I: Description and numerical tests, J. Climate, 21, 3642–3659, 2008.
Ovtchinnikov, M. and Ghan, S. J.: Parallel simulations of aerosol influence on clouds using cloud-resolving and single-column models, J. Geophys. Res., 110, D15S10, doi:10.1029/2004JD005088, 2005.
Pincus, R., Hemler, R. S., and Klein, S. A.: Using stochastically generated sub-columns to represent cloud structure in a large-scale model, Mon. Weather Rev., 134, 3644–3656, 2006. Randall, D. A., Xu, K. M., Somerville, R. J. C., and Iacobellis,
S.: Single-column models and cloud ensemble models as links between observations and climate models, J. Climate, 9, 1683– 1697, 1996.
Salzmann, M., Ming, Y., Golaz, J.-C., Ginoux, P. A., Morrison, H., Gettelman, A., Kr¨amer, M., and Donner, L. J.: Two-moment bulk stratiform cloud microphysics in the GFDL AM3 GCM: descrip-tion, evaluadescrip-tion, and sensitivity tests, Atmos. Chem. Phys., 10, 8037–8064, doi:10.5194/acp-10-8037-2010, 2010.
Siebesma, A. P., Bretherton, C. S., Brown, A., et al.: A large-eddy simulation intercomparison study of shallow cumulus convec-tion, J. Atmos. Sci., 60, 1201–1219, 2003.
Stevens, B., Feingold, G., Cotton, W. R., and Walko, R. L.: El-ements of the microphysical structure of numerically simulated non-precipitating stratocumulus, J. Atmos. Sci., 53, 980–1006, 1996.
Stevens, B., Ackerman, A. S., Albrecht, B. A., et al.: Simulations of trade-wind cumuli under a strong inversion, J. Atmos. Sci., 58, 1870–1891, 2001.
Stevens, B., Lenschow, D. H., Vali, G., et al.: Dynamics and chem-istry of marine stratocumulus-DYCOMS-II, B. Am. Meteorol. Soc., 84, 579–593, 2003.
Stevens, B., Moeng, C.-H., Ackerman, A. S., et al.: Evaluation of large-eddy simulations via observations of nocturnal marine stra-tocumulus, Mon. Weather Rev., 133, 1443–1462, 2005. Stevens, B. and Seifert, A.: Understanding macrophysical outcomes
of microphysical choices in simulations of shallow cumulus con-vection, J. Meteor. Soc. Japan, 86A, 143–162, 2008.
vanZanten, M. C., Stevens, B., Vali, G., and Lenschow, D.: Obser-vations of drizzle in nocturnal marine stratocumulus, J. Atmos. Sci., 62, 88–106, 2005.
Webb, M. J., Senior, C. A., Sexton, D. M. H., et al.: On the con-tribution of local feedback mechanisms to the range of climate sensitivity in two GCM ensembles, Clim. Dynam., 27, 17–38, 2006.
Wyant, M. C., Bretherton, C. B., Chlond, A., et al.: A single-column model intercomparison of a heavily drizzling stratocumulus-topped boundary layer, J. Geophys. Res., 112, D24204, doi:10.1029/2007JD008536, 2007.