IJEDR1602189
International Journal of Engineering Development and Research (www.ijedr.org)1081
Design and Numerical Flow Analysis of Expansion
Deflection Nozzle
Shaik Abdul Muwaaz1, Nazumuddin Shaik2 Post Graduate Student, Assistant Professor
1 Shaik Abdul Muwaaz, Aerospace Department, Nimra Institute of Science and Technology, Vijayawada, Andhra Pradesh, India. 2 Nazumuddin Shaik, Aerospace Department, Lakireddy Bali Reddy College of Engineering, Andhra Pradesh, India.
________________________________________________________________________________________________________
Abstract - Expansion deflection (ED) nozzles are being considered in the development of upper stages of launching vehicles because of their altitude compensating characteristics. This paper deals with the design of expansion deflection nozzle by using Gmbit and numerical flow analysis by using computational fluid dynamics code Ansys Fluent. For this purpose nozzle with expansion deflection or pintle is placed linearly at 20%, 30% and 50% after the throat of the nozzle. Simulations were carried out at same operating conditions for three different cases to represent under expansion, ideal expansion and over expansion conditions of the flow. The flow fields obtained through the numerical simulation were analyzed to know the effect of expansion deflection on the performance of ED nozzle. The results have shown different cases of expansion. The ideal expansion behavior was observed at 20% to 35% locations of expansions deflection and external flow effects are small. The research of this nozzle continues and also being investigated further and performance is predicted for the use of single stage to orbit (SSTO) allowing for a substantial increase in payload.
________________________________________________________________________________________________________
I. INTRODUCTION
In the field of rocket propulsion, design of nozzle is of paramount importance. There are many types of nozzles, for example conical nozzle, 80% nozzle, convergent divergent nozzle, bell nozzle, etc., used according to the requirements of the mission. Development of the nozzle with the capability of producing optimum amounts of thrust in wide ranges of altitude has been a subject of continuous dedicated efforts within the community of rocket propulsion. The phenomenon of producing optimum amounts of thrust by a rocket nozzle in off-design conditions is called as altitude compensation. Nozzles with the altitude compensation characteristics are basic feature in realizing the development of Single Stage to Orbit (SSTO) vehicles. Reusable SSTO vehicles offer the promise of reduced launch expenses by eliminating recurring costs associated with hardware replacement inherent in expendable launch systems.
The most popular altitude compensating rocket nozzle to date is the aerospike nozzle, the origin of which dates back to Rocketdyne in 1950s.
Aerospike nozzle:
An aerospike nozzle has a spike in the center of the nozzle. Aerospike nozzle can be described as an inverted bell nozzle where the flow expands on the outside of the nozzle instead of being completely constrained by the nozzle walls. From the throat, the innermost streamlines of the flow follow the contours of the spike, gradually being turned in the axial direction.
Aerospike rocket nozzles are designed for consistent performance over a wide range of ambient pressures.
IJEDR1602189
International Journal of Engineering Development and Research (www.ijedr.org)1082
Fig.2: Aerospike nozzle behavior in comparison with traditional nozzle during flightThese result in reductions in the efficiency of the nozzle. An aerospike nozzle does not have a solid geometry defining the outer limits of the flow path in the supersonic region of the flow. Instead it allows the exhaust gases to expand freely beyond the throat, via the mechanism of a Prandtl-Meyer expansion fan.
II. DESIGN METHODOLOGY
A 2-D design is developed based on the design method used for a plug nozzle.Design of the aerospike nozzle mainly refers to the design of the central spike and the determination of angle of the primary nozzle. Design of the central contour of the nozzle can be done by two methods namely the method of characteristics, approximation method. There is an another method called method of calculus of variations which was proposed by G.V.R. Rao in late 1950s, which is also called as Rao’s Thrust efficiency method, this method also uses the method of characteristics for the calculation of flow field properties. According to this theory the control surface of the plug nozzle is determined by Lagrange multipliers to obtain optimum thrust.
All methods used for defining a traditional aerospike nozzle have a common geometry. This geometry is given below in Fig.3
Fig.3: Geometry of an aerospike nozzle
By using approximation method exhaust and throat area of the aerospike nozzle is calculated as Area of exhaust 𝐴𝑒 = ( − )
Area of throat
In an isentropic supersonic flow, an area ratio can be written as follows
IJEDR1602189
International Journal of Engineering Development and Research (www.ijedr.org)1083
Throat angle is given by
Radial co-ordinate of spike nozzle can be given as
Axial co-ordinate
Where as
III. NUMERICAL SIMULATION
This section describes numerical modeling and analysis of external flow of the aerospike nozzle with different plug shapes using a commercial CFD code ANSYS FLUENT. The objective of the analysis is comparison of flow patterns produced by aerospike nozzles with different plug shapes. Numerical modeling also helps us to validate the MatLab code generated for the design of the Aerospike nozzle by comparing the expected Mach number with the Mach number obtained from the numerical simulation.
i. Geometry:
MatLab code presented in the Appendix-A of this thesis, which uses method of characteristics, is implemented to calculate the co-ordinates of the nozzle contours for the design of aerospike nozzle assuming the following parameters. These parameters are used as input for the program
Expected exhaust Mach number: Me = 3 Propellant:
Ethanol-Throat Radius: rt = 0.0508 m = 2 inch Change in
Prandtl-The Co-ordina program, they are
Expansion point: (1.778, 13.3099)
IJEDR1602189
International Journal of Engineering Development and Research (www.ijedr.org)1084
Fig.4: Contour co-ordinates of 25% nozzle Fig.5: Contour co-ordinates of 40% nozzleFig.6: Contour co-ordinates of 50% nozzle
Using the co-ordinates of expansion point, nozzle contour co-ordinates, and Throat angle obtained from the Matlab program, 2-D geometrical models are developed using the ANSYS ICEM, a commercial modeling and meshing tool. Vertex data obtained from the MATLAB code is imported to Ansys ICEM to create the contour surface of the nozzle. The primary nozzle is created by using the two geometrical arcs approximating the convergent section at the throat. Figures 4,5 & 6 shows the geometries of the 25%, 40%, and 50% nozzles
Fig.7: Geometrical model of 25% nozzle Fig.8: Geometrical model of 40% nozzle
IJEDR1602189
International Journal of Engineering Development and Research (www.ijedr.org)1085
Boundary conditions of the created geometries are discussed in the later sections of this chapter. Considering axial symmetry of the problem, numerical solution is carried out in half of the entire domain, bounded by a boundary with axial symmetry condition.ii. Mesh:
Geometries created by using Ansys ICEM are exported to FLUENT GAMBIT, a commercial meshing tool. The solution domain, in all the cases, is discretized using a structured grid of quadrilateral cells. As the geometric variations in regions surrounding to the nozzle surface make it impossible to generate a structured grid with acceptable quality, domain has been divide into two different faces. Different geometries of the truncated aerospike nozzles cause the solution domain to have different number of cells. Total number of grid cells for the 25%, 40%, and 50% cases are 6566, 7388, and 7241, respectively.
Fig.10: Grid for analysis of 25% nozzle Fig.11: Grid for analysis of 40% nozzle
Fig.12: Grid for analysis of 50% nozzle iii. Boundary conditions:
The condition implied at the inlet of the convergent section is inlet with specified mass flow, with the following boundary values, these values are taken from the Reference
IJEDR1602189
International Journal of Engineering Development and Research (www.ijedr.org)1086
Temperature (T) = 1577.826 K Pressure (P) = 2045430 N/m2
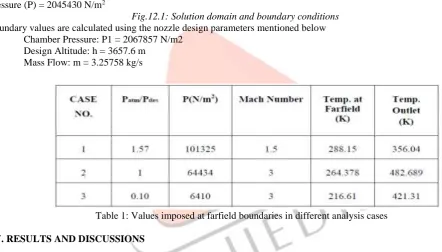
Fig.12.1: Solution domain and boundary conditions Boundary values are calculated using the nozzle design parameters mentioned below
Chamber Pressure: P1 = 2067857 N/m2 Design Altitude: h = 3657.6 m
Mass Flow: m = 3.25758 kg/s
Table 1: Values imposed at farfield boundaries in different analysis cases
IV. RESULTS AND DISCUSSIONS
IJEDR1602189
International Journal of Engineering Development and Research (www.ijedr.org)1087
Table 2: Cases and their respective featuresi.Under expansion conditions:
Case 1:
This case corresponds to the simulation of 25 % aerospike nozzle in the under expansion conditions where the operating conditions are taken in accordance with the atmospheric conditions prevailing at the high altitudes. In this case the expansion waves originated from the upper lip of the primary nozzle face the truncated portion of the plug.
The flow facing the truncation first encounters a sharp expansion, then by continuing its way to the centre of the plug base. From this point flow passes through compression by the atmosphere and the flow meets at the stagnation point where the flow properties are nearer to the ideal flow conditions. This phenomenon is due to the formation of two symmetric vortices in the base of the plug, which counteract the effect of each other at two locations, one of which is located at the center of the plug base, where the stagnation conditions prevail. This can be noticed in the Fig13 showing the path lines.
Fig.13: Path lines of the 25% nozzle at under expansion
IJEDR1602189
International Journal of Engineering Development and Research (www.ijedr.org)1088
Fig.14: Contours of Mach number of the 25% nozzle at under expansionCase 2:
This case represents the flow of 40 % nozzle at the under-expansion conditions. the contours of static pressure we can see that domain of the expansion waves originating from the upper-lip of the primary nozzle cover an area larger than the plug itself and the flow continues to expand after the plug.
Fig.15 path lines also keep diverging for some distance after the plug.
Fig.15: Path lines of the 40 % nozzle Fig.16: Contours of static pressure
After the point of stagnation adjusted by the ambient pressure the flow is seen to be almost parallel to the axis, representing the compression of the flow, which is a sign of optimum thrust production by the exhaust gases. The recirculation of the gases at the truncation base can be observed in Fig.16 showing contours of static pressure.
IJEDR1602189
International Journal of Engineering Development and Research (www.ijedr.org)1089
Case 3:In this case, which refers to 50.p.c aerospike nozzle at under-expansion conditions where Patm/Pdes = 0.10, results obtained from the flow simulation are qualitatively discussed.
In this case it is clearly visible that the series of expansion waves started at the upper lip of the primary nozzle got compressed by the atmosphere; this compression is characterized by the increase in the density and reduction in the velocity of the exhaust flow.
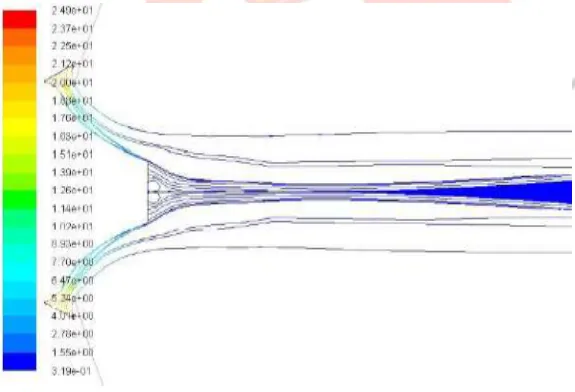
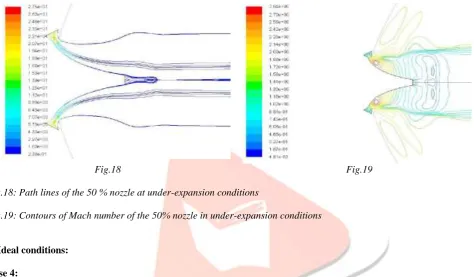
After the point of stagnation, which we have discussed in the previous cases, the exhaust gases flow parallel to the axis leaving no residuals, thus producing a great deal of thrust. This can be observed in the Fig. showing the path lines colored by density. From the contours of Mach number in Fig. we can observe that velocity of the flow during the expansion after leaving the primary nozzle is high and this velocity is later reduced by the compression of flow achieving a Mach number of 1.72 at the nozzle exit.
Fig.18 Fig.19
Fig.18: Path lines of the 50 % nozzle at under-expansion conditions
Fig.19: Contours of Mach number of the 50% nozzle in under-expansion conditions
ii. Ideal conditions:
Case 4:
In this case discussion is about the results of simulation of 25 % aerospike nozzle at design altitude.
At this condition the flow density pattern is same to that of the previous cases but the flow keeps on diverging even after the stagnation point. But this divergence is contained by the surrounding domain. From the Fig.6.8 showing the path-lines colored by density it is observed that expansion characterized by decrease in density occurs at the tip of the primary nozzle and again at the tip of the truncated portion of the nozzle. This expansion is followed by the compression of exhaust gases by the surrounding domain. contours of static pressure the position of the stagnation point and the recirculation area forming two vortices at the base of truncated nozzle can be observed.
And the expansion waves are extended even after the end of the nozzle surface. But from the contours of Mach number shown in the Fig.22 it is observed that velocity of the exhaust flow is gradually increasing even during the compression phase reaching the maximum Mach number of 3.2 at the exit of the nozzle.
IJEDR1602189
International Journal of Engineering Development and Research (www.ijedr.org)1090
Fig.22: Contours of Mach number of the 25% nozzle at design altitude.Case 5-6:
These cases which refers to the 40% and 50% aerospike nozzle at ideal design conditions flow pattern is similar to that of the previous case, i.e. the 25 % nozzle at the design altitude. And the simulation results are almost similar. Velocities in the case 5 and 6 are observed as 3.7 Mach and 3.5 Mach respectively, which are more than the designed 3 Mach. But the variation in velocity is in tolerable limit. Figures 23, 24 & 25 representing the path lines colored by density, contours of static pressure, and
contours of Mach number respectively for the 40 % nozzle case are given below.
Fig.23 Fig.24
Fig.23: Path lines of the 40 % nozzle at design altitude
Fig.24: Contours of pressure for static at design altitude
IJEDR1602189
International Journal of Engineering Development and Research (www.ijedr.org)1091
Figures 26, 27 & 28 representing the path-lines colored by density, contours of static pressure, and contours of Mach number respectively for the 50 % nozzle case are given below.Fig.26 Fig.27
Fig.26: Path lines of the 50 % nozzle at design altitude
Fig.27: Contours of static pressure for the 50%Nozzle at design altitude
Fig.28: Contours of Mach number of the 50 % nozzle at design altitude.
iii. Over expansion conditions:
Case 7-9:
Cases 7, 8, and 9 corresponds to the simulation of 25%, 40%, and 50% nozzles respectively in the over-expansion conditions where the pressure ratio Patm/Pdes=1.57. In all the three cases simulation results are almost same and the flow pattern is similar.
In these cases we can observe that the expansion waves originating from the upper lip of the convergent primary nozzle extend even after the surface of the nozzle meeting at the midpoint of the base, and the secondary expansion can be observed at the tip of the truncated portions. These expansion waves continue their way in spite of the larger amounts of the compression which leads to the over-expansion conditions. The effect of over-expansion can be clearly seen in showing path-lines of the exhaust flow in the region before the stagnation point. After the stagnation point the exhaust gases flow parallel to the axis of symmetry. The stagnation point in all the cases is nearer to the surface of the truncation base, reducing the area of recirculation region where the two vortices are formed. An oblique shock can be seen in all the cases, which can be observed in showing the Mach number contours, nearer to the surfaces surrounding the upper lip of the primary nozzle. These waves are characterized by high velocities and expansion. But in all the cases the effect of the shock waves on the exhaust flow is in negligible range. In comparison between all the three cases, it is observed that effect of shock waves is more in case 7, which represents the 25 % nozzle.
IJEDR1602189
International Journal of Engineering Development and Research (www.ijedr.org)1092
Fig.29: Path lines of the 25 % nozzle Fig.30: Path lines of the 40 % over-expansionin overexpansion
Fig.31: Path lines of the 50 % nozzle in over-expansion
Fig.32 Fig.33
IJEDR1602189
International Journal of Engineering Development and Research (www.ijedr.org)1093
Fig.33: Contours of Mach number of the 40% nozzle in over-expansionIJEDR1602189
International Journal of Engineering Development and Research (www.ijedr.org)1093
Dividing thrust into the three following components, explains this phenomenon more clearly1) Thrust produced by the nozzle convergent section 2) Thrust produced by the plug surface
3) Thrust produced by the plug base
In under-expansion conditions, when the plug is truncated, its lateral area decreases. Therefore the pressure thrust produced by the plug reduces. On the other hand, thrust generated by the base region increases because of the increase of the base area. These two effects compensate each other, and the total nozzle thrust becomes almost the same for different nozzle truncation. This effect can be seen most clearly for the 25% plug.
But in over-expansion conditions, the situation is totally different. In these conditions, as the nozzle length becomes shorter, hence decreasing the plug area, thrust produced by the plug still decreases, while as the atmosphere pressure is higher than the exhaust pressure thrust produced by the base pressure would have a negative value. So by increasing truncation, the negative value of base thrust will increase, hence decreasing total thrust in over-expansion conditions. It can be concluded that for the 25% plug, total thrust is lowest. At low altitudes (i.e., over-expansion conditions) base pressure linearly increases as atmospheric pressure increases.
Therefore, the pressure thrust which is produced by the pressure difference between the atmosphere and the base becomes small and even negative in most cases at low altitudes. On the other hand, at high altitudes, pressure at the base remains constant despite variation of altitude. As the altitude increases, atmospheric pressure decreases and the difference between base pressure and atmospheric pressure increases, hence increasing the base thrust
V. CONCLUSIONS
In this thesis a computer code has been developed, using MATLAB, to design the aerospike nozzle. Using these code three nozzles of varying amounts of truncation is designed. The flow structure and the performance of the designed nozzles at three different altitudes, which are selected hypothetically to represent under-expansion, ideal, and over-expansion conditions, are simulated using ANSYS FLUENT and the results are compared and analyzed. The results clearly indicate that the aerospike nozzle is capable of producing the optimum performance at different altitudes; this phenomenon is called as the altitude compensation effect.
From the simulation results we know that the base pressure compensates the loss of thrust in under-expansion conditions, plug truncation has minor effect on the loss of thrust in these conditions. But in over-expansion, thrust loss will increase with the increase of truncation. Base pressure thrust is closely related to variation of base pressure with atmospheric pressure. Base pressure is constant in under-expansion conditions, but increase with the increase of the atmospheric pressure in over-expansion conditions.
IJEDR1602189
International Journal of Engineering Development and Research (www.ijedr.org)1094
VI. REFERENCES[1] Angelino G., “Approximation Method for Plug Nozzle Design”, AIAA Journal, Vol. 2, No. 10, Oct.1964, pp. 1834-1835. [2] Gross, Klaus W., "Performance Analysis of Aerospike Rocket Engines," 1972.
[3] Lee, C. C., “Computation of plug nozzle contours by the Rao’s optimum thrust method”, NASA CR-21914 R-61, 1963. [4] Lee, C. and Thompson D., “FORTRAN Program for Plug Nozzle Design”, NASA TM X-53019, 1964.
[5] Lee, C. C., Inman. S. J., “Numerical analysis of plug nozzles by the Method of characteristics”, NASA TECHNICAL NOTE R-10, 1964.
[6] Besnard, E., H. H. Chen, T. Mueller and J. Garvey, “Design, Manufacturing and Test of a Plug Nozzle Rocket Engine”, AIAA Paper 2002-4038, 2002.
[7] Naghib Lahouti, A., Nazarinia, M. and Tolouei, E., “Design and CFD Analysis of an Aerospike Nozzle to Compare Its Off-Design Performance with a Conventional Nozzle”, Proceedings of IMEC2004, International Mechanical Engineering Conference, IMEC2004-FM014-CP, December 5-8, 2004, Kuwait.
[8] Naghib Lahouti, A., Nazarinia, M. and Tolouei, E., “Design and numerical analysis of aerospike nozzles with different plug shapes to compare their performance with a conventional nozzle”, The Eleventh Australian International Aerospace Congress, Melbourne, Australia, 13-17 March (2005).
[9] Naghib Lahouti, A., and Tolouei, E., “Investigation of the effect of base bleed on thrust performance of a truncated aerospike nozzle in off-design conditions”, European Conference on Computational Fluid Dynamics ECCOMAS CFD, 2006.