University of Pennsylvania
ScholarlyCommons
Publicly Accessible Penn Dissertations
1-1-2015
Risk-Return Tradeoffs and Managerial incentives
David Tsui
University of Pennsylvania, [email protected]
Follow this and additional works at:
http://repository.upenn.edu/edissertations
Part of the
Accounting Commons
, and the
Finance and Financial Management Commons
This paper is posted at ScholarlyCommons.http://repository.upenn.edu/edissertations/2064
For more information, please [email protected].
Recommended Citation
Risk-Return Tradeoffs and Managerial incentives
Abstract
Moral hazard theory posits that managerial risk aversion imposes agency costs on shareholders, and firms
respond by providing risk-taking incentives to mitigate these costs. The underlying assumption in this
literature is that increasing shareholder value requires increasing risk, yet there is limited empirical evidence
supporting this assumption or the role of such risk-return tradeoffs in incentive compensation design. Using
measures based on the firm’s stock price, I find that shareholder value increases with risk, consistent with
managerial risk aversion imposing agency costs on shareholders. I also find that firms provide managers with
more risk-taking incentives when this risk-return relation is more positive and thus potential risk-related
agency costs are more severe. This finding is strongest among firms where value increases with idiosyncratic
rather than systematic risk, consistent with theory that these agency costs arise primarily from managers’
exposure to idiosyncratic risk. Overall, these results are consistent with firms designing managerial
compensation contracts to mitigate risk-related agency costs. Additional findings highlight that the incentives
from equity-based compensation depend on the risk-return tradeoffs that managers face, providing one
explanation for the conflicting results in prior literature regarding the incentives from managerial stock price
exposure.
Degree Type
Dissertation
Degree Name
Doctor of Philosophy (PhD)
Graduate Group
Accounting
First Advisor
Wayne Guay
Keywords
Executive compensation, Managerial incentives, Risk-return tradeoffs
Subject Categories
Accounting | Finance and Financial Management
RISK-RETURN TRADEOFFS AND MANAGERIAL INCENTIVES
David Tsui
A DISSERTATION
in
Accounting
For the Graduate Group in Managerial Science and Applied Economics
Presented to the Faculties of the University of Pennsylvania
in
Partial Fulfillment of the Requirements for the
Degree of Doctor of Philosophy
2015
Supervisor of Dissertation
_______________________
Wayne Guay, Professor of Accounting
Graduate Group Chairperson
_______________________
Eric Bradlow, Professor of Marketing, Statistics, and Education
Dissertation Committee
Wayne Guay, Professor of Accounting
Richard Lambert, Professor of Accounting
Christopher Armstrong, Associate Professor of Accounting
RISK-RETURN TRADEOFFS AND MANAGERIAL INCENTIVES
COPYRIGHT
2015
iii
ACKNOWLEDGMENT
I am very grateful to the members of my dissertation committee, Wayne Guay (chair), Chris
Armstrong, Rick Lambert, and Dan Taylor, for their guidance and feedback. I also appreciate
thoughtful discussions with Cathy Schrand, Jake Thomas, and my fellow doctoral students, and
comments from seminar participants at UCLA, the University of Oregon, the University of
Pennsylvania, the University of Rochester, the University of Southern California, the University of
Texas at Austin, the University of Washington, and Yale University. I gratefully acknowledge
iv
ABSTRACT
RISK-RETURN TRADEOFFS AND MANAGERIAL INCENTIVES
David Tsui
Wayne Guay
Moral hazard theory posits that managerial risk aversion imposes agency costs on shareholders,
and firms respond by providing risk-taking incentives to mitigate these costs. The underlying
assumption in this literature is that increasing shareholder value requires increasing risk, yet there
is limited empirical evidence supporting this assumption or the role of such risk-return tradeoffs in
incentive compensation design. Using measures based on the firm’s stock price, I find that
shareholder value increases with risk, consistent with managerial risk aversion imposing agency
costs on shareholders. I also find that firms provide managers with more risk-taking incentives when
this risk-return relation is more positive and thus potential risk-related agency costs are more
severe. This finding is strongest among firms where value increases with idiosyncratic rather than
systematic risk, consistent with theory that these agency costs arise primarily from managers’
exposure to idiosyncratic risk. Overall, these results are consistent with firms designing managerial
compensation contracts to mitigate risk-related agency costs. Additional findings highlight that the
incentives from equity-based compensation depend on the risk-return tradeoffs that managers
face, providing one explanation for the conflicting results in prior literature regarding the incentives
v
TABLE OF CONTENTS
ACKNOWLEDGMENT ...III
ABSTRACT... IV
LIST OF TABLES ... VII
LIST OF ILLUSTRATIONS ... VIII
1. INTRODUCTION ... 1
2. BACKGROUND AND HYPOTHESES ... 7
2.1. Managerial risk aversion and agency conflicts ... 7
2.2. Hypotheses ... 9
3. RESEARCH DESIGN AND DATA ...11
3.1. Risk-return relations ... 11
3.2. Incentive compensation and risk-return tradeoffs ... 15
3.3. Data ... 16
3.4. Descriptive statistics ... 17
4. RESULTS...19
4.1. Risk-return relations ... 19
4.2. Incentive compensation and risk-return tradeoffs ... 22
5. SYSTEMATIC VS. IDIOSYNCRATIC RISK-RETURN TRADEOFFS ...23
6. MANAGERIAL RISK AVERSION ...26
vi
8. ROBUSTNESS TESTS ...30
8.1. Endogenous relation between risk-return tradeoffs and incentive compensation ... 30
8.2. Manager fixed effects ... 32
8.3. Four-factor expected returns model... 33
9. CONCLUSION ...33
APPENDIX A ...35
APPENDIX B ...36
vii
LIST OF TABLES
Table 1: Descriptive Statistics ... 41
Table 2: Investment Risk and Types of Investment ... 42
Table 3: Investment Value and Future Sales Growth ... 43
Table 4: Investment Value and Risk ... 44
Table 5: Risk-Return Tradeoffs by Industry ... 45
Table 6: Risk-Return Tradeoffs and Industry Characteristics ... 46
Table 7: Risk-Return Tradeoffs and Incentive Compensation ... 47
Table 8: Risk-Return Tradeoffs, Incentive Compensation, and Systematic vs. Idiosyncratic Risk 48 Table 9: CEO Risk Aversion ... 49
Table 10: Investment Risk and Risk-Return Tradeoffs ... 50
Table 11: Investment Risk, Risk-Return Tradeoffs, and Incentive Compensation ... 51
Table 12: Lagged Risk-Return Tradeoffs and Incentive Compensation ... 52
Table 13: Risk-Return Tradeoffs and Incentive Compensation, Excluding Estimation Firms ... 53
Table 14: CEO Fixed Effects ... 54
viii
LIST OF ILLUSTRATIONS
Figure 1: Investment Value and Risk ... 39
1
1. Introduction
The moral hazard literature argues that managerial risk aversion introduces agency
conflicts between managers and shareholders and, as a result, shareholders may provide
risk-taking incentives to reduce the costs of these conflicts (e.g., Jensen and Meckling, 1976; Smith
and Stulz, 1985). Throughout this literature, the underlying assumption is that managers may avoid
certain investment-related risks and thereby reduce shareholder value (i.e., increasing the value of
investment projects requires increasing risk and thus managerial risk aversion may diminish
shareholder value). However, there is limited empirical evidence supporting this assumption or,
more importantly, examining how this relation between risk and shareholder value influences
incentive compensation design. In particular, there is little evidence regarding whether firms appear
to provide risk-taking incentives to help manage agency costs of managerial risk aversion, or if
managerial incentive compensation may instead motivate “excessive” (i.e., value-destroying)
risk-taking to the potential detriment of shareholders, as several studies suggest (e.g., Lambert, 1986;
Dong, Wang, and Xie, 2010; Athanasakou, Ferreira, and Goh, 2013).1 In this paper, I address these
issues through two primary analyses. First, I estimate the relation between risk-taking and firm
value by evaluating whether greater investment risk is associated with greater increases in firm
value from these investments. Second, I examine how this risk-return relation2 influences
managers’ compensation contracts. Specifically, I test whether firms provide more risk-taking
incentives when potential agency costs stemming from managerial risk aversion are greater.
Managers’ risk aversion may impose agency costs on shareholders for a number of
reasons.3 First, managers might forgo value-increasing projects (from outside shareholders’
1 This concern about excessive risk-taking is also widespread among the popular press and regulators. See,
for example, “U.S. Regulators Revive Work on Incentive Pay Rules; Compensation That Rewards Excessive Risk Taking Is a Concern,” Wall Street Journal, February 16, 2015.
2 Throughout the paper, I use the terms “risk-return tradeoffs” and “risk-return relations” interchangeably to
refer to the relation between risk and firm value (i.e., whether firm value increases with risk). This is distinct from the relation between risk and required return (i.e., whether discount rates increase with risk). These two ideas are not necessarily inconsistent because if expected cash flows increase with risk, firm value may also increase despite an increase in discount rates.
3 In particular, risk aversion may create agency costs if managers are more risk averse than shareholders
2
perspective) that they deem too risky, even if shareholders view the risk as acceptable. For
example, managers are often poorly diversified and therefore unable to eliminate their exposure to
the firm’s idiosyncratic risk (e.g., Jensen and Meckling, 1976; Amihud and Lev, 1981; Smith and
Stulz, 1985). As a result, they may impose higher discount rates than well-diversified shareholders
when evaluating investment opportunities, potentially causing them to reject value-increasing
projects that carry significant amounts of idiosyncratic risk. Second, for a given level of investment,
managers may reallocate investment away from riskier projects, even if these riskier projects
generate greater returns. For example, Coles, Daniel, and Naveen (2006) argue that managers
with fewer risk-taking incentives shift investment toward lower-risk projects. If these less risky
investments tend to generate smaller returns, this shift may be detrimental to shareholders. Third,
managers may choose to enter the firm into costly hedging contracts (Smith and Stulz, 1985) or
engage in diversifying acquisitions (Amihud and Lev, 1981), which prior literature argues reduce
both firm risk and value (e.g., Lang and Stulz, 1994; Berger and Ofek, 1995). In summary,
risk-related agency costs4 stem from managers avoiding certain projects that increase both shareholder
value and risk (or, similarly, from managers investing in projects that decrease both shareholder
value and risk). That is, the basic assumption in this literature is that there exists a positive relation
between risk and shareholder value and, given this assumption, potential agency costs arise
because risk-averse managers have incentives to choose a level of risk (and therefore value) that
is “too low” from shareholders’ perspective.
In response to these potential risk-related agency costs, shareholders may choose to
provide managers with risk-taking incentives. Much of the prior literature focuses on convex
compensation contracts (e.g., stock options) as a mechanism to reduce managerial risk aversion
(e.g., Jensen and Meckling, 1976; Haugen and Senbet, 1981; Smith and Stulz, 1985).5 These
4 More precisely, agency costs that arise from managers being more risk-averse than shareholders. I use the
term “risk-related agency costs” in this paper to refer to these costs of managerial risk aversion (and not, for example, any potential costs from managers being overly risk-tolerant from shareholders’ perspective).
5 If shareholder value and risk are positively related, linear contracts on stock price (e.g., restricted stock) may
3
contracts reward managers more for increases in firm value of a given magnitude than they
penalize managers for decreases in firm value of the same magnitude. As a result, managers’
expected payoffs from these contracts increase as risk increases, potentially increasing their
appetite for risk. Consistent with this reasoning, empirical studies examining equity-based
compensation and risk-taking generally find that managers respond to convex compensation
contracts by taking greater risk and therefore conclude that these types of contracts help reduce
managerial risk aversion (e.g., Rajgopal and Shevlin, 2002; Coles, Daniel, and Naveen, 2006; Low,
2009).
The objective of this paper is to examine the risk-return tradeoffs that managers face when
making investment decisions and how these tradeoffs influence firms’ incentive compensation
choices. In particular, I argue that the potential costs of managerial risk aversion are larger when
the relation between risk and shareholder value is more positive. As a result, I expect that firms
should provide more managerial risk-taking incentives as this relation becomes stronger. For
example, if the riskiest investments earn twice the returns of the least risky investments at one firm
while at another firm the difference in returns is insignificant, I expect the first firm to provide more
risk-taking incentives.
I conduct my analysis in two stages. First, I estimate the investment risk-return tradeoffs
that firms face by examining contemporaneous changes in equity value and stock volatility for firms
with large amounts of new investment. I find that, on average, the value of investment projects
increases with risk, both in total and per dollar of investment. That is, firms that make riskier
investments experience greater increases in value than those who make lower-risk investments.
This is consistent with managerial risk aversion potentially imposing agency costs on shareholders
and inconsistent with widespread excessive risk-taking.
Second, I test how the strength of this risk-return relation influences firms’ incentive
compensation decisions. Consistent with firms considering these “returns on risk” when designing
4
their incentive compensation, I find that firms provide their managers with more convex
compensation contracts as the relation between risk and equity value becomes more positive.
Furthermore, this association between compensation convexity and risk-return tradeoffs is
concentrated at firms where payoffs to investment increase in idiosyncratic (rather than systematic)
risk, consistent with predictions from agency theory that risk-related agency costs primarily stem
from managerial aversion to idiosyncratic risks (e.g., Amihud and Lev, 1981; Smith and Stulz,
1985). I also find that firms tend to use less convex incentive compensation (i.e., compensation
that is more linear in firm value) when the returns to lower-risk investment are higher. Overall, these
results are consistent with firms providing taking incentives to help mitigate potential
risk-related agency costs.
I also consider how risk-return tradeoffs may directly influence managers’ risk-taking
incentives, independent of any effect on firms’ incentive compensation decisions. In particular,
managers may benefit from increasing their firm’s cash flows for reasons unrelated to
compensation or ownership stake in the firm. For example, greater cash flows may allow managers
to more easily increase the size of the firm or invest in pet projects (e.g., Jensen, 1986). Thus,
managers may have greater incentives to take on risk when the payoffs to riskier investment are
larger, independent of the incentives provided by their compensation contract. Additionally,
risk-return relations may also influence how managers respond to a given compensation contract. In
particular, if increased risk-taking increases the value of the firm, equity-based compensation
potentially provides managers with two incentives for greater risk-taking: a “direct” effect, from
greater risk increasing the value of the manager’s option portfolio independent of any effect of this
greater risk on firm value, and an “indirect” effect, from greater risk increasing firm value, which in
turn increases the value of the manager’s stock and option holdings.6 The option portfolio vega
6 The total change in a manager’s wealth from increasing risk (i.e., “risk-taking incentives”) can be expressed
as the sum of the partial derivative of wealth with respect to risk and the derivative of firm value with respect to risk times the partial derivative of wealth with respect to firm value:
𝑑𝑊
𝑑𝜎 =
𝜕𝑊 𝜕𝜎 +
𝜕𝑊 𝜕𝑉
5
measure commonly used in the prior literature (i.e., the sensitivity of the manager’s wealth to a one
percentage point increase in stock volatility) captures this “direct” effect but omits any “indirect”
effect. The “indirect” effect is related to the manager’s portfolio delta (i.e., the sensitivity of the
manager’s wealth to a one percent increase in stock price) and is increasing in the strength of the
relation between risk and return, suggesting that delta may provide more risk-taking incentives for
managers when risk-return relations are stronger (i.e., more positive). Consistent with both these
hypotheses, I find that stronger risk-return tradeoffs appear to increase both managers’ appetite for
risk-taking, independent of incentives from their compensation contracts, and the risk-taking
incentives provided by managers’ delta.
I make several contributions to the literature. I find that, on average, there is a positive
relation between the risk of and return on firms’ investments. I also find evidence that riskier projects
(per dollar of investment) tend to generate greater returns, suggesting that risk-related agency
costs may result not only from firms investing in “too few” projects (i.e., underinvesting) but also
investing in projects that are “too safe”. These results highlight that risk-taking is an integral
component of making investments that increase shareholder value, consistent with assumptions in
the prior moral hazard literature (e.g., Jensen and Meckling, 1976; Smith and Stulz, 1985) and in
contrast to more recent notions of excessive taking and concerns regarding increased
risk-taking largely harming shareholders.
Next, I show that firms behave as if they consider risk-return tradeoffs when designing their
incentive compensation structures. In particular, I find that firms provide managers with more
risk-taking incentives when the potential costs of managerial risk aversion are greater. While the
existing literature provides extensive evidence regarding the effectiveness of convex compensation
contracts in promoting managerial risk-taking, there is limited evidence as to whether firms seem
to provide such contracts with the intent of motivating risk-taking, or if this is perhaps an unintended
where 𝑊 is the manager’s wealth, 𝜎 is the firm’s risk, and 𝑉 is the firm’s value. The first term on the right-hand
6
consequence of these compensation contracts.7 I provide evidence that firms do appear to manage
potential risk-related agency costs through their choice of incentive compensation contracts.
My findings highlight that understanding the incentive consequences of managerial
equity-based compensation requires considering not only the magnitude and shape of the payoff structure
(i.e., delta and vega) but also the relation between risk and shareholder value for the firm’s potential
investments. Two managers with identical compensation contracts but facing different risk-return
tradeoffs may respond very differently to equity incentives. For example, increasing the amount of
equity-based compensation (i.e., delta) at a firm with a highly positive relation between risk and
shareholder value might motivate a manager to increase risk but have the opposite effect at a firm
with a negative or zero relation between the two. In contrast, prior literature largely assumes that
managers have relatively homogeneous responses to a particular incentive contract, independent
of the risk-return tradeoffs or other firm characteristics they may face.
Lastly, my results suggest a potential method to address the conflicting results in the prior
literature regarding how stock price exposure (i.e., delta) influences managerial risk-taking
incentives. For example, Coles et al. (2006) report that delta reduces risky investment but increases
stock volatility. Brockman, Martin, and Unlu (2010), Chava and Purnanandam (2010), and Panousi
and Papanikolaou (2012) also suggest delta reduces risk-taking incentives, while Feng et al. (2011)
find a positive relationship between delta and financial misreporting and Armstrong and Vashishtha
(2012) find that delta increases stock volatility. This literature generally explains these mixed results
by arguing that delta provides two opposing risk-taking incentives and therefore the overall effect
is ambiguous. First, risk-taking may increase stock price and therefore incentivize risk-taking,
assuming that there is a positive relation between risk and return. Second, risk-taking may increase
stock price volatility, which managers are presumably averse to, and therefore disincentivize
risk-taking. Because the firm’s risk-return tradeoff is a key element determining the balance between
7 For example, boards may provide convex compensation contracts because they are a less costly form of
7
these two effects, estimating this tradeoff may allow for clearer inferences regarding these opposing
incentives stemming from managers’ portfolio delta.
The remainder of this paper proceeds as follows. Section 2 reviews related literature on
risk-related agency conflicts between managers and shareholders and the consequences of
managerial risk-taking incentives. Section 3 describes the research design and data I use in my
primary analyses and Section 4 discusses the results. Section 5 separates risk into systematic and
idiosyncratic components and evaluates whether risk-return tradeoffs and their relation with
incentive compensation depend on the type of risk involved. Section 6 explores the role of
managerial risk aversion in firms’ compensation design and Section 7 examines whether risk-return
tradeoffs provide risk-taking incentives incremental to their effect on managers’ equity-based
compensation. Section 8 presents robustness tests and Section 9 concludes.
2. Background and Hypotheses
2.1. Managerial risk aversion and agency conflicts
Prior literature argues that managerial risk aversion creates a number of potential agency
conflicts between managers and shareholders (see, e.g., Jensen and Meckling, 1976; Amihud and
Lev, 1981; Smith and Stulz, 1985). Broadly speaking, these conflicts stem from managers’ inability
to fully diversify their exposure to firm-specific risks. Shareholders, in contrast, are generally viewed
as well-diversified with respect to these risks (i.e., risk-neutral) and therefore tend to desire greater
levels of risk-taking than managers. For example, both analytical and empirical studies typically
assume that managers hold relatively large proportions of their total wealth in their firm’s equity
(e.g., Jensen and Meckling, 1976; Dittman and Maug, 2007; Conyon, Core, and Guay, 2011).8 As
a result, managers have undiversified exposure to idiosyncratic risk in the firm’s stock price and
therefore may avoid investing in value-increasing projects that increase idiosyncratic risk.
8 Empirical studies typically rely on assumptions regarding the proportion of managerial wealth held in firm
8
Alternatively, managers may choose to invest in projects that reduce idiosyncratic risk, such as
diversifying acquisitions, which prior studies suggest reduces firm value (e.g., Lang and Stulz,
1994; Berger and Ofek, 1995). Forced turnover or other career concerns provide another potential
reason for managers to avoid investing in value-increasing risky projects, even in the absence of
large undiversified equity positions (Amihud and Lev, 1981). For example, heightened risk
increases managers’ likelihood of termination (Bushman, Dai, and Wang, 2010; Peters and
Wagner, 2014) and therefore career concerns may provide additional incentives for managers to
pass up risky projects that would increase firm value.
One commonly suggested solution to these risk-related agency costs is to provide
managers with incentive compensation that rewards risk-taking. In particular, many studies argue
that compensation contracts that are convex in firm value (e.g., stock options) increase managers’
incentives to take risk and therefore potentially reduce agency costs resulting from managerial risk
aversion (see, e.g., Jensen and Meckling, 1976; Haugen and Senbet, 1981; Smith and Stulz, 1985;
Guay, 1999). These contracts reward managers for taking additional risk by increasing expected
payoffs as risk rises and, consequently, may incentivize managers to take on greater amounts of
risk.9
Several studies note that, from a theoretical perspective, providing risk-averse managers
with convex compensation contracts does not necessarily induce them to increase risk (see, e.g.,
Lambert, Larcker, and Verrecchia, 1991; Carpenter, 2000; Ross, 2004; Lewellen, 2006). This
occurs because in addition to increasing expected payoffs from risk-taking, these contracts also
increase the sensitivity of managers’ compensation to the firm’s value and therefore the uncertainty
surrounding the amount of their compensation. That is, while these contracts provide risk-taking
incentives through their convexity, they also make managers’ overall wealth more dependent on
the firm’s value. Because risk-averse managers have incentives to minimize uncertainty regarding
their wealth, this latter effect may motivate them to instead attempt to reduce the firm’s risk in order
9 For example, payoffs to an at-the-money stock option increase if the stock price increases but do not fall if
9
to reduce this uncertainty. However, empirical studies examining this issue generally find that
convex payoffs, typically measured by option portfolio vega, motivate greater risk-taking (e.g.,
Rajgopal and Shevlin, 2002; Coles, Daniel, and Naveen, 2006; Low, 2009; Chava and
Purnanandam, 2010; Armstrong and Vashishtha, 2012). Thus, despite the theoretical ambiguity
noted above, empirical evidence largely concludes that convex compensation contracts are
effective at increasing managers’ appetite for risk.10
2.2. Hypotheses
The relation between investment risk and shareholder value depends on firms’ investment
opportunity sets and may vary across firms. Standard mean-variance efficient asset pricing models
(e.g., Sharpe, 1964) suggest a positive relation between risk and required returns on potential
investment projects.11 Alternatively, shareholder value may increase with investment risk simply
due to limited liability, which shifts the consequences of negative project outcomes to other parties,
particularly for more levered firms (e.g., Jensen and Meckling, 1976). However, there are also
reasons that shareholder value may decline as investment risk rises. For example, competitive
advantages or other similar factors may give some limited subset of firms access to relatively high
return, low risk projects, while a wider set of firms may have access only to lower return, higher risk
projects. In this situation, there might be a negative relation between investment risk and
shareholder value. This idea is analogous to capital market models involving incomplete
information (e.g., Merton, 1987), where firms with relatively small potential investor bases (i.e.,
firm-specific investment opportunities) may have higher returns and lower risk than firms with broader
investor exposure.12 Thus, because the shape of firms’ investment opportunity sets is not clear, I
do not make any directional prediction regarding the relation between investment value and risk:
10 Specifically, the studies noted above document risk-taking incentives from vega after controlling for delta
(i.e., the overall amount of equity-based compensation). In other words, convex compensation contracts seem to promote risk-taking relative to linear contracts that provide managers with the same exposure to stock price.
11 More generally, risk-averse managers may simply demand greater returns to invest in riskier projects,
leading to a positive relation between observed investment value and risk.
12 Many studies in the organizational theory literature, starting with Bowman (1980), also find a negative
10
H1: Investment value is related to investment risk.
Next, I consider how risk-return relations influence incentive compensation choices. Moral
hazard theory suggests that firms should provide more risk-taking incentives in situations where
potential risk-related agency costs are greater (e.g., Haugen and Senbet, 1981; Smith and Stulz,
1985). The magnitude of these agency costs depends on the relation between risk and shareholder
value and the overall returns on the firm’s potential risky investments. For example, firms should
have little reason to provide risk-taking incentives if riskier potential investments, or the firm’s
potential investments in general, generate very little return (e.g., Smith and Watts, 1992; Guay,
1999). In other words, risk itself is not valuable to shareholders; rather, it is the potential increase
in value associated with this risk (e.g., Jensen and Meckling, 1976; John and John, 1993) that may
motivate shareholders to provide risk-taking incentives to managers. Furthermore, because
increased risk-taking also potentially imposes additional costs, firms should have less reason to
provide managers with risk-taking incentives if relatively low-risk investments generate large
returns. For example, Froot, Scharfstein, and Stein (1993) argue that riskier firms are more likely
to suffer cash flow shortfalls that prevent them from internally funding future investments. In the
presence of imperfect capital markets, this may prevent the firm from investing in value-increasing
projects in the future, to the detriment of shareholders. This discussion suggests my second set of
hypotheses, that firms provide more risk-taking incentives when the relation between investment
value and risk is more positive, and less when returns on low-risk investments are greater:
H2a: Firms provide more risk-taking incentives when risk-return relations are stronger
(more positive).
H2b: Firms provide fewer risk-taking incentives when returns on lower-risk investments are
11
3. Research Design and Data
3.1. Risk-return relations
I examine the relation between investment risk and shareholder value using
contemporaneous changes in the firm’s stock price and volatility. The basic idea behind this
analysis is that I view the firm as a collection of investment projects, and the firm’s value and risk
reflect this project portfolio. In any given year, the firm may choose to make new investments that
add to this collection of projects, potentially changing both the firm’s value and risk. I attempt to
capture the incremental effect of these new investments by examining contemporaneous relations
between equity value and volatility after controlling for factors other than new investment that may
also affect these quantities. Specifically, I first estimate the value of new investment projects using
the firm’s abnormal stock return after adjusting for the effect of unexpected earnings, as an
extensive stream of literature dating back to Ball and Brown (1968) finds that unexpected earnings
may influence stock prices.13 However, these earnings are unlikely to materially reflect cash inflows
generated by the current year’s investment projects, as both capital expenditures and R&D are
defined as costs whose associated cash inflows are expected to occur in future periods, rather than
the current period. Next, I estimate the risk associated with these investments using the change in
the firm’s stock volatility, after adjusting for changes in its size and leverage. I adjust for these
changes to attempt to isolate changes in the firm’s underlying risk, as stock price volatility is a
function of not only the firm’s underlying risk but also factors such as its size and capital structure
(see, e.g., Christie, 1982). That is, I estimate the value of new investment with residual abnormal
stock returns (controlling for unexpected earnings) and the risk of this investment with residual
change in stock volatility (controlling for size and leverage). However, these residual changes in
stock price and volatility also capture the effect of other factors besides new investments. To
address this issue, I estimate these measures using observations with large amounts of
unexpected investment to attempt to focus on situations where investment is most likely to be a
12
primary factor driving changes in the firm’s stock price and stock volatility. The following sections
describe this analysis in more detail.
3.1.1. Investment value
As described above, I estimate the value of a firm’s new investments in a given year as the
portion of annual abnormal stock return not explained by that year’s unexpected earnings, which
may influence stock price but are unlikely to include significant cash inflows stemming from the
current year’s investments. Specifically, I estimate the following regression:
𝐴𝑅𝑡= 𝛼0+ 𝛼1𝑈𝑋𝑡+ 𝑢𝑡 [1]
where 𝐴𝑅 is the firm’s market-adjusted return and 𝑈𝑋 is unexpected earnings, defined as the
change in earnings from the prior year.14 I estimate this model separately for each industry-year
(i.e., I assume the mapping between earnings and returns is relatively constant across firms within
an industry-year). I define the value of the firm’s new investments during the year as the residual 𝑢
from this model.
3.1.2. Investment risk
Similarly, I estimate the risk of investment in a given year using the change in the firm’s
stock volatility not explained by changes in its size and leverage, as changes in either of these
quantities may influence the firm’s stock volatility without any change in the firm’s underlying risk.
Specifically, I estimate the following regression:
Δ𝑉𝑜𝑙𝑡= 𝛾0+ 𝛾1Δ𝑆𝑖𝑧𝑒𝑡+ 𝛾2Δ𝐿𝑒𝑣𝑡+ 𝑤𝑡 [2]
where Δ𝑉𝑜𝑙 is the change in the standard deviation of firm’s stock return, Δ𝑆𝑖𝑧𝑒𝑡 is the change in
the firm’s market capitalization, and Δ𝐿𝑒𝑣 is the change in firm’s leverage. I again estimate the
14 I add back depreciation and R&D expense to reported earnings when computing this measure to attempt to
13
model separately for each industry-year. I define risk of the firm’s investments during the year as
the residual 𝑤 from equation 2.15
3.1.3. Investment value and risk
I examine the relation between the value and risk of the firm’s new investments by
comparing the investment value estimated in Section 3.1.1 (i.e., 𝑢 in equation 1) with the investment
risk estimated in Section 3.1.2 (i.e., 𝑤 in equation 2). If investment value is positively (negatively)
associated with investment risk, there should be a positive (negative) relation between the two
measures. I first test whether there exists a linear relation between the two measures by estimating
the following model:
𝑅𝑒𝑡𝑢𝑟𝑛𝑡= 𝛿0+ 𝛿1𝑅𝑖𝑠𝑘𝑡 [3]
where 𝑅𝑒𝑡𝑢𝑟𝑛 is the residual 𝑢 from equation 1 and 𝑅𝑖𝑠𝑘 is the residual 𝑤 from equation 2. As
mentioned above, I estimate this model using observations with relatively large amounts of
unexpected investment in order to focus on firms where I can best identify investment value and
risk, and therefore the relation between the two.16 Specifically, I estimate equation 3 using firms
with top-quartile unexpected investment.17 I compute the firm’s unexpected investment during the
year by first estimating expected investment levels as follows (see, e.g., Hubbard, 1998):
𝐼𝑡= 𝛽0+ 𝛽1𝐶𝐹𝑡+ 𝛽2𝑆𝐺𝑡−1+ 𝛽3𝐼𝑡−1+ 𝑣𝑡 [4]
where 𝐼 is new investment, scaled by lagged market capitalization, 𝐶𝐹 is operating cash flow plus
R&D expense, scaled by lagged market capitalization, and 𝑆𝐺 is percentage sales growth. I follow
Richardson (2006) and define new investment as the sum of capital expenditures, R&D expense,
and acquisitions in the current year less sales of PP&E and depreciation. As in equations 1 and 2,
15 To be more precise, this residual-based measure captures unexpectedly large or small changes in volatility,
given the amount of investment in the period (i.e., investment with above- or below-average risk). This is because changes in the firm’s size are likely to partially reflect increased investment during the period, and thus I effectively control for the average effect of investment on stock volatility.
16 For example, estimating investment value and risk is not practical when investment is very close to zero.
17 This corresponds to firms with unexpected investment in excess of approximately 3 percent of market
14
I estimate this model separately for each industry-year. I define unexpected investment as the
residual 𝑣 from equation 4.
I also consider the possibility that the relation between investment value and risk may be
non-linear. For example, risk-averse managers may require greater returns for increases in risk as
risk becomes larger (i.e., managers face increasing marginal costs of risk), potentially resulting in
a convex relation between observed investment value and risk. Alternatively, there may be
diminishing returns to increasing investment risk, which could instead result in a concave relation.
To examine these possibilities, I extend equation 3 by adding a quadratic risk term as follows:
𝑅𝑒𝑡𝑢𝑟𝑛𝑡= 𝜃0+ 𝜃1𝑅𝑖𝑠𝑘𝑡+ 𝜃2𝑅𝑖𝑠𝑘𝑡2 [5]
where, as in equation 3, 𝑅𝑒𝑡𝑢𝑟𝑛 is the residual 𝑢 from equation 1 and 𝑅𝑖𝑠𝑘 is the residual 𝑤 from
equation 2. A positive (negative) coefficient 𝜃2 would be consistent with a convex (concave) relation
between investment value and risk. I estimate both equations 3 and 5 with industry-year fixed
effects to account for the possibility that investment value or risk may naturally vary across different
industries and over time.
Equations 3 and 5 estimate the relation between investment value and risk without
controlling for the amount of unexpected investment (i.e., they do not control for the scale of the
firm’s investments). As a further analysis, I also estimate risk-return relations with equations 3 and
5 after scaling investment value and risk by the amount of unexpected investment in the period.
Specifically, I divide the value and risk measures defined in equations 1 and 2 by unexpected
investment as defined in equation 4. This essentially converts these measures into “per dollar”
quantities, as opposed to aggregated or firm-level quantities, and allows me to evaluate whether
investments that carry more risk per dollar of investment generate larger returns. This distinction
between aggregate and per-dollar investment is important if firms primarily change their investment
risk by reallocating their investment dollars between relatively riskier or less risky projects, rather
than adjusting their total amount of investment (i.e., they adjust the mix of investments rather than
the scale). For example, Coles, Daniel, and Naveen (2006) argue that managers with differing risk
15
than (or possibly in addition to) adjusting total investment levels (i.e., the scale of investment).
Appendix B discusses the distinction between aggregate and per-dollar investment in more detail.
In my subsequent tests examining incentive compensation, I primarily focus on these
per-dollar (scaled) investment value and risk measures to focus on the variation in risk-taking most
likely to reflect managerial discretion.18 For example, managers at firms facing capital constraints
may have limited ability to increase the scale of their investments. However, I expect that they
should have more discretion over the mix of projects that they select. That is, while factors outside
managers’ control may constrain the amount of total investment they may undertake (i.e., their
investment budget), they should have more flexibility in how to allocate this budget among various
potential projects.
3.2. Incentive compensation and risk-return tradeoffs
Next, I consider how the relation between investment value and risk (i.e., the risk-return
tradeoff) influences firms’ incentive compensation policies. To estimate firms’ risk-return tradeoffs,
I re-estimate equation 3 separately for each industry-year.19 Thus, unlike in Section 3.1, where I
assume that all firms face the same investment risk-return tradeoffs (i.e., in equation 3, 𝛿1 is the
same for all firms), I now assume only that all firms within the same industry-year face the same
risk-return tradeoffs. I use the observed relations between investment value and risk within each
industry-year to estimate these risk-return tradeoffs. My estimate of the strength of the relation
between value and risk for each firm in that industry-year is the coefficient 𝛿1 from equation 3. That
is, I assume firms within the same industry-year have similar investment opportunity sets and
therefore use my industry-year-level estimated risk-return tradeoff to proxy for the tradeoff that each
18 I obtain similar inferences if I instead estimate risk-return relations using my unscaled investment value and
risk measures.
19 I exclude industry-years for which I have 10 or fewer observations when estimating these models. My
16
firm within that industry-year.20 For firms in industry-years where 𝛿
1 is larger, the benefits to
increasing investment risk are greater. Similarly, I estimate the expected return on lower-risk
investments within an industry-year with the coefficient 𝛿0 from equation 3. For firms in
industry-years where 𝛿0 is larger, the returns on lower-risk investment are greater.
Using these risk-return tradeoff and lower-risk investment return measures, I test my
second hypothesis by estimating regressions of the following form:
𝐼𝑛𝑐𝑒𝑛𝑡𝑖𝑣𝑒𝑡= 𝜅0+ 𝜅1𝑅𝑒𝑡𝑢𝑟𝑛/𝑅𝑖𝑠𝑘𝑡+ 𝜅2𝐿𝑜𝑤𝑒𝑟𝑅𝑖𝑠𝑘𝑅𝑒𝑡𝑢𝑟𝑛𝑡+ 𝐶𝑜𝑛𝑡𝑟𝑜𝑙𝑠 [6]
where 𝑅𝑒𝑡𝑢𝑟𝑛/𝑅𝑖𝑠𝑘 and 𝐿𝑜𝑤𝑒𝑟𝑅𝑖𝑠𝑘𝑅𝑒𝑡𝑢𝑟𝑛 are 𝛿1 and 𝛿0, respectively, estimated from equation 3
as described above and 𝐼𝑛𝑐𝑒𝑛𝑡𝑖𝑣𝑒 is an incentive-compensation measure. Consistent with prior
literature examining equity-based compensation, my primary measure of risk-taking incentives is
the manager’s portfolio vega, defined as the sensitivity of the manager’s wealth to a one percentage
point change in the firm’s stock volatility. H2 implies that 𝜅1> 0 and 𝜅2< 0 in equation 6. I also
examine how risk-return tradeoffs influence managers’ overall levels of equity-based compensation
by estimating equation 6 using the manager’s portfolio delta as an incentive measure, where delta
is defined as the sensitivity of the manager’s wealth to a one percent change in the firm’s stock
price. One possibility is that delta is more effective at aligning managers’ and shareholders’
interests when the relation between risk and value is stronger, suggesting a positive relation
between delta and risk-return tradeoffs. Alternatively, if greater delta primarily increases managerial
risk aversion, as some prior studies suggest (e.g., Brockman, Martin, and Unlu, 2010; Chava and
Purnanandam, 2010), shareholders may want to reduce delta when risk-return tradeoffs are
stronger.
3.3. Data
I estimate the risk-return relations described in Sections 3.1 and 3.2 using financial data
from Compustat and stock return data from CRSP. Consistent with prior literature, I omit financial
20 As I discuss in more detail in Section 8, I use these industry-year (rather than firm-specific) measures to
17
firms and utilities. My initial sample consists of 115,641 firm-year observations for which I have
stock returns and sufficient data to compute new investment and spans the years 1987 through
2012. Because my tests require year-to-year changes for certain measures, the sample for which
I am able to compute my investment value and risk measures consists of 83,211 firm-year
observations. As described previously, I estimate risk-return relations using firm-years with
top-quartile unexpected investment in order to focus on firms where I can best identify investment value
and risk. This reduces the final sample that I use to estimate equations 3 and 5 to 20,956 firm-year
observations, which consists of 6,903 distinct firms. I winsorize all variables used in these models
at the 1st and 99th percentiles.
For my tests involving incentive compensation, I supplement the sample described above
with managerial incentives based on data from Execucomp and Equilar. Specifically, I compute
CEO delta and vega using the method described in Core and Guay (2002). The sample of firms for
which I have managerial incentive data consists of 40,064 firm-year observations between the
years 1992 and 2012. I have sufficient data to compute my risk-return relation measures for 33,139
of these observations and estimate equation 6 using this reduced sample, which consists of 4,194
distinct firms.21
3.4. Descriptive statistics
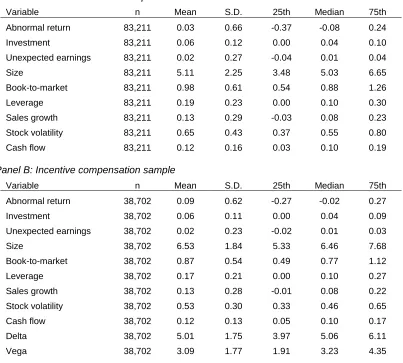
Table 1, Panel A reports descriptive statistics for the sample used in my tests on the relation
between investment value and risk. The median market-adjusted return is negative (about negative
8 percent), while median new investment is approximately 4 percent of the firm’s market
capitalization. The median firm in my sample has a market capitalization of approximately $150
million, a book-to-market ratio of 0.88, and annualized stock volatility of 55 percent. In general,
these measures are consistent with prior studies examining the sample of Compustat-CRSP firms.
21 Note that this incentive compensation sample is larger than the 20,956-observation sample that I use to
18
Table 1, Panel B provides descriptive statistics for the sample for my tests on incentive
compensation. Compared with the sample in Panel A, median market-adjusted returns are higher
(about negative 2 percent), while investment is similar between the two samples. The median firm
in my incentive compensation sample is somewhat larger than the median firm from my sample in
Panel A, with a median market capitalization of approximately $600 million. Median book-to-market
ratio and annualized stock volatility are lower than in Panel A, at 0.77 and 46 percent, respectively.
The median manager in my sample has delta of approximately $150,000 and vega of approximately
$25,000. These amounts are somewhat smaller than the figures reported in prior literature,
reflecting the fact that the Equilar incentive data included in my sample includes smaller firms than
those included in Execucomp.22
3.5. Investment value and risk characteristics
Before testing my hypotheses, I examine whether the characteristics of the investment
value and risk measures described in Section 3.1 seem consistent with the underlying constructs
they are intended to capture. I first consider my investment risk measure. R&D investment is
generally viewed as more risky than capital expenditures (e.g., Bhagat and Welch, 1995; Coles,
Daniel, and Naveen, 2006). This suggests that investment risk should be larger when the firm
spends more on R&D compared to capital spending. To test this prediction, I regress my investment
risk measures (both scaled and unscaled) on R&D and capital expenditures. I include industry-year
fixed effects when estimating these models and also control for a standard set of lagged firm-level
characteristics (e.g., size, book-to-market, and leverage). Table 2 presents the results. Columns 1
and 2 present results for unscaled, or “total” investment risk, while columns 3 and 4 present results
for scaled, or “per-dollar” investment risk. Columns 1 and 3 report results from a model with only
R&D, capital expenditures, and industry-year fixed effects, while columns 2 and 4 also include other
firm-level controls. Consistent with the reasoning above, I find that investment risk is positively
22 Descriptive statistics for delta and vega based on Execucomp data are comparable to prior studies (about
19
related with R&D, and more positively related with R&D than capital expenditures, under all
specifications (p < 0.01 in each specification).
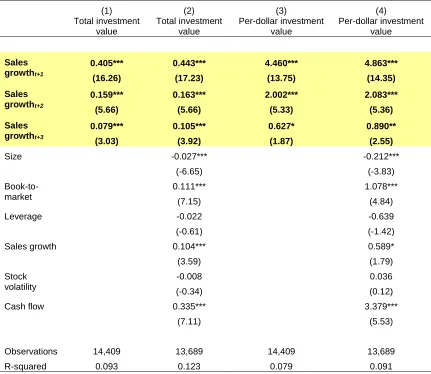
Next, I evaluate my investment value measure. Cohen, Diether, and Malloy (2013)
measure returns on investment by examining the relation between investment and future sales
growth. Specifically, they regress sales growth on prior investment and argue that larger investment
coefficients represent more profitable investments. I employ a similar approach and regress my
investment value measures (both scaled and unscaled) on future sales growth. If these measures
capture investment value, the coefficients on future sales growth should be positive. As in my
investment risk tests, I include industry-year fixed effects and include standard firm-level controls.
Table 3 presents the results. Similar to Table 2, columns 1 and 2 present results for unscaled “total”
investment value, while columns 3 and 4 present results for scaled “per-dollar” investment value.
Columns 1 and 3 provide results from a model with only future sales growth and industry-year fixed
effects, while columns 2 and 4 also include other firm-level controls. Under all specifications, I find
that investment value is positively associated with future sales growth, consistent with this measure
capturing returns on investment.
4. Results
4.1. Risk-return relations
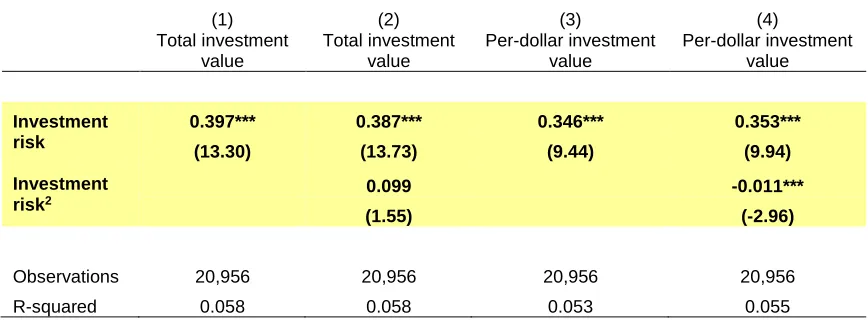
Table 4 reports the results from estimating equations 3 and 5, which examine the relation
between investment value and risk. Columns 1 and 2 report results based on unscaled investment
value and risk measures. I find that the estimated coefficient on investment risk is positive and
significant in both specifications (0.40 and 0.39 in columns 1 and 2, respectively, p < 0.01 for both).
These coefficients imply that an investment which increases the firm’s stock volatility by one
percentage point corresponds to an approximately 40 basis point increase in firm value.23 Column
23 To put this into some context, I compute an average “cost of risk” over my sample period based on the
20
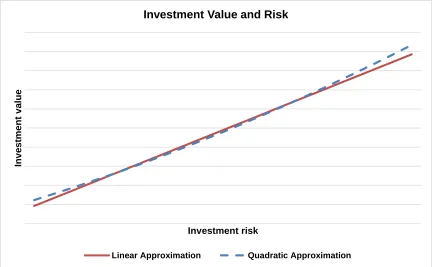
2 in Table 4 suggests that the relation between investment value and risk is slightly convex, as the
estimated coefficient on squared investment risk is positive. However, this result is not statistically
significant at conventional levels (p = 0.12). Overall, the results in Table 4 are consistent with the
assumption throughout much of the agency theory literature that firms face risk-return tradeoffs
when making investment decisions. Figure 1 plots the estimated relation between investment value
and risk based on the results in columns 1 and 2 of Table 4.
Columns 3 and 4 report results from estimating equations 3 and 5 after scaling investment
value and risk by unexpected investment (i.e., per-dollar value and risk). I find that this scaled
investment value also increases as risk increases, suggesting riskier investments (per dollar)
generate greater expected returns (coefficient of 0.35 in both columns, p < 0.01). The coefficient
on unscaled investment risk in column 1 is somewhat larger than the coefficient on scaled
investment risk in column 3 (p = 0.04), which is consistent with the positive relation between
investment value and risk in columns 1 and 2 being driven by both larger amounts of risky
investment and a greater proportion of riskier, more profitable investments. This suggests that
risk-related agency costs arise both from risk-averse managers investing in fewer risky projects, and in
projects that are less risky, than shareholders would prefer.
In contrast to the results in column 2, the positive relation between scaled investment value
and risk seems to be concave, as the coefficient on squared investment risk is significantly negative
in column 4 (-0.011, p < 0.01).24 Thus, while riskier investments (per dollar) seem to generate
greater returns, there appear to be diminishing returns as risk continues to increase. Figure 2 plots
the estimated relation between per-dollar investment value and risk based on the results in columns
3 and 4 and Table 5 ranks industries in my sample by their time-series average risk-return tradeoff.
The industries with the most favorable risk-return tradeoffs (i.e., largest benefits to risk-taking) are
apparel, construction, and personal services. The industries with the least favorable tradeoffs are
printing and publishing, fabricated products, and consumer goods.
24 This difference in convexity between unscaled and scaled investment is consistent with firms receiving
21
Next, I examine industry characteristics that I expect to be associated with these risk-return
tradeoffs. First, more competitive industries are likely to have more positive risk-return tradeoffs,
as firms “compete away” the payoffs to lower risk projects and therefore must take on riskier
projects to increase value. That is, I expect firms in more competitive industries to have less access
to relatively high return, low risk projects. Second, industries with fewer growth opportunities may
also have more positive risk-return tradeoffs. This lack of growth opportunities should lead to
greater competition among available projects and again drive down the payoffs to less risky
projects. I test these hypotheses by regressing my estimated risk-return tradeoffs on industry
competition and growth opportunities.25 I also include year fixed effects to attempt to control for
other economy-wide factors that may change over time and influence risk-return tradeoffs. I
measure industry competition with the Herfindahl index, computed as the sum of squared market
shares within an industry-year, and I measure growth opportunities with the average
book-to-market ratio within an industry-year. Smaller values for these measures indicate increased
competition and greater growth opportunities, respectively; thus, the discussion above suggests a
negative (positive) relation between risk-return tradeoffs and Herfindahl index (book-to-market).
Table 6 presents the results from this analysis. Column 1 reports results for only industry
competition, column 2 reports results for only growth opportunities, and column 3 reports results
for both measures. I find a significantly negative relation between risk-return tradeoffs and
Herfindahl index, consistent with risk-taking providing greater benefits in more competitive
industries. I also find a positive relation between risk-return tradeoffs and book-to-market,
consistent with greater benefits from risk-taking when firms have fewer growth opportunities.
25 Recall that I estimate risk-return tradeoffs by industry-year, and thus for this analysis my sample consists of
22
4.2. Incentive compensation and risk-return tradeoffs
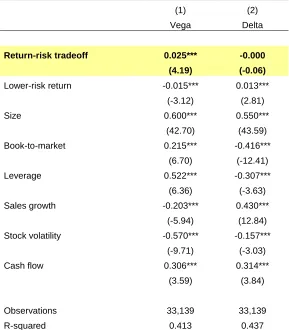
Table 7 presents the results from examining the relation between risk-return tradeoffs and
incentive compensation based on equation 6.26 Column 1 reports results with vega as the
dependent variable and column 2 reports results with delta. The estimated coefficient on the
risk-return tradeoff is significantly positive in column 1 (0.025, p < 0.01), indicating that firms provide
more convex incentive compensation contracts (i.e., higher vega) when the relation between
investment risk and value is stronger. In other words, firms provide more incentives to take risk
when the potential benefits from such risk-taking (or, alternatively, the costs from managerial risk
aversion) are greater. In terms of economic magnitude, this coefficient implies that firms with the
largest risk-return tradeoffs (i.e., greatest incremental returns to risk-taking) provide their managers
with approximately 30 percent higher vega compared to firms with the smallest risk-return tradeoffs.
I also find that firms provide more equity-based compensation, but not more convex
compensation, when the return on lower-risk investment is greater. Specifically, I find a significantly
positive relation between delta and lower-risk return in column 2 (coefficient of 0.013, p < 0.01) but
a significantly negative relation between vega and lowerrisk return in column 1 (coefficient of
-0.015, p < 0.01). These coefficients imply that firms with the largest lower-risk returns (i.e., greatest
incremental returns to projects that do not increase risk) provide their managers with approximately
15 percent higher delta and 20 percent lower vega compared to firms with the smallest lower-risk
returns. These results are consistent with firms offering convex compensation contracts when they
seek to motivate risky investment, rather than investment in general. For example, when lower-risk
investment is relatively profitable, firms may have weaker incentives to motivate managers to invest
specifically in higher-risk projects. Overall, the results in Table 7 support the idea that firms design
their managers’ risk-taking incentives to mitigate risk-related agency costs.
26 As discussed in Section 3.1.3, I estimate these risk-return tradeoffs using scaled (per-dollar) investment risk
23
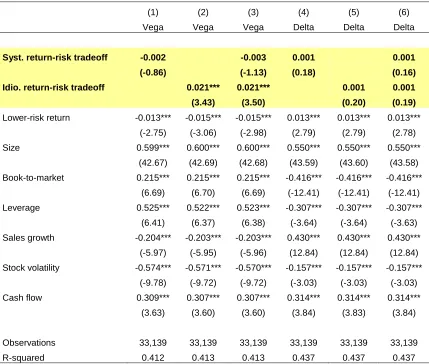
5. Systematic vs. Idiosyncratic Risk-Return Tradeoffs
In this section, I examine whether the relations between incentive compensation structures
and risk-return tradeoffs in Section 4 depend on the type of risk involved (i.e., systematic or
idiosyncratic). The analysis in the previous section does not distinguish between these different
types of risk, and the distinction is potentially important because risk-related agency conflicts
between managers and shareholders primarily stem from managers’ aversion to idiosyncratic risk,
rather than risk in general (e.g., Amihud and Lev, 1981; Smith and Stulz, 1985; Lewellen, Loderer,
and Martin, 1987). If shareholder value and risk are positively correlated but this relation is due
purely to effects from systematic risk, there may be no significant risk-related agency conflict
between managers and shareholders. However, if this relation results from firms earning greater
returns on projects with greater idiosyncratic risk, managers’ and shareholders’ incentives may be
more misaligned. Specifically, risk-related agency conflicts arise from differential preferences for
risk between managers and shareholders. Because both of these parties are averse to systematic
risk (i.e., because shareholders cannot diversify this type of risk), differences in tolerance for
systematic risk between managers and shareholders are likely to be relatively minor compared to
differences with regard to idiosyncratic risk, which is much more difficult for managers to diversify.
Given that risk-related agency costs largely result from managers’ exposure to
undiversifiable idiosyncratic risks, firms seeking to mitigate these costs should primarily be
interested in providing managers with risk-taking incentives when firm value is related to
idiosyncratic risk, rather than systematic risk. That is, potential risk-related agency costs are largest
when the firm has access to high-NPV investments that managers might avoid due to their aversion
to idiosyncratic risk. In contrast, managers should require fewer incentives to invest in positive-NPV
projects that increase systematic risk, since managers and shareholders are both averse to such
risk and consequently their incentives are better aligned. In fact, some studies indicate that
managers may be less averse to systematic risk than the typical shareholder (e.g., Dittman and
Maug, 2007; Graham, Harvey, and Puri, 2013). As a result, shareholders might actually want to
24
Examining differential effects between systematic and idiosyncratic risk also allows me to
evaluate an alternative explanation for the use of convex equity-based compensation contracts;
namely, that firms provide convex compensation contracts to their managers not to help manage
risk-related agency conflicts, but rather because these contracts are more “powerful” than linear
contracts (i.e., compared to linear contracts, convex contracts tend to magnify managers’ sensitivity
to stock price; see, e.g., Lambert, Larcker, and Verrecchia, 1991; Lambert and Larcker, 2004; Ross,
2004). Lambert and Larcker (2004) discuss how convex compensation contracts may be optimal
even in the absence of risk-related agency conflicts between managers and shareholders.
Specifically, they demonstrate that the optimal compensation contract between a risk-neutral
manager and risk-neutral shareholders may be convex in firm value if managerial wealth
constraints prevent shareholders from addressing potential agency conflicts by simply selling the
firm to the risk-neutral manager (e.g., Harris and Raviv, 1979; Holmstrom, 1979). This occurs
because convex contracts offer a relatively low-cost way for firms to provide their managers with
exposure to the firm’s stock price (i.e., delta). That is, firms may design compensation contracts to
provide an optimal level of delta, while any risk-related incentive effects may be “unintended
consequences” of these convex contracts rather than their primary objective.
One potential explanation for the results in Section 4 is that shareholders are more
receptive to these potential risk-related “side effects” and consequently employ more convex
compensation contracts when risk-return tradeoffs are more favorable. Under this explanation, the
relation between compensation convexity and risk-return tradeoffs need not be tied to the particular
type of risk involved. That is, if any benefits (or costs) from risk-taking are simply a side effect of
achieving a targeted level of delta with a relatively low-cost compensation contract, whether these
benefits result from systematic or idiosyncratic risk should be irrelevant to the contract’s design. If
anything, firms in this situation may be more inclined to give equity-based risk-taking incentives
when systematic risk-return tradeoffs are stronger, given that Armstrong and Vashishtha (2012)
find that such incentives are more effective at promoting systematic, rather than idiosyncratic,