Y. Kubojima (*) · H. Kato · M. Tonosaki
Forestry and Forest Products Research Institute, P.O. Box 16, Tsukuba Norin Kenkyu Danchi-nai, Tsukuba 305-8687, Japan Tel. +81-298-73-3211; Fax +81-298-74-3720
e-mail: [email protected] H. Ohsaki
Hokkaido Forest Products Research Institute, Asahikawa 071-0198, Japan
Received: April 25, 2005 / Accepted: July 28, 2005
Abstract Resonance frequencies of beams with various types of end supports were examined for flexural vibration. Rectangular beams with dimensions of 300 (L) ¥ 25 (R) ¥ 5 or 10 mm (T) were used as the test specimens. Various compressing stresses were applied to the parts around both ends of a test beam and flexural vibration tests were con-ducted. The measured resonance frequency started to in-crease from the resonance frequency of a beam with simply supported ends and was stable around the resonance fre-quency of a beam with fixed ends as the compressing stress increased. The stable resonance frequency was lower than the theoretical value because perfect fixation of a beam to a post was difficult. From these results, the temporal change in resonance frequency itself, rather than the stable reso-nance frequency, is effective to examine whether a beam has enough strength as a guardrail.
Key words Boundary conditions · Fixed ends · Flexural vibration test · Resonance frequency · Timber guardrail
Introduction
In 1998, timber guardrails were approved for use in national and prefectural roads if they could pass a crash test with cars and trucks. Various timber guardrails have been subse-quently developed and more than 50 km of timber guard-rails are in use today.1,2
A method to estimate deterioration of wood used for guardrails, however, has not been established. Conse-quently, it is difficult to decide when the guardrails should be replaced.
For this purpose, obtaining the changes in strength over time of the wood for the timber guardrail is important. Although the strength can be measured accurately by re-moving the wood from a guardrail, this method is difficult to adopt because it takes much time. Hence, a testing method by which the appropriate strength can be measured in the lumber fixed to a post of a guardrail is needed. Naturally, the test should be conducted without rupturing the specimen.
Young’s modulus is one of the properties that is related to the strength and can be obtained without damaging the specimen. One method for measuring Young’s modulus is a flexural vibration test.
The flexural vibration test has been widely used because of its simplicity. There have been several studies on its testing method: for example, the supporting position of a specimen, the distance between a specimen and a head of a vibration generator,3
and gripping of a cantilever-type specimen have been examined. However, these studies do not assume measurements in actual end conditions of a beam used as a guardrail but rather for typical end condi-tions: hinged, clamped, sliding, and free.
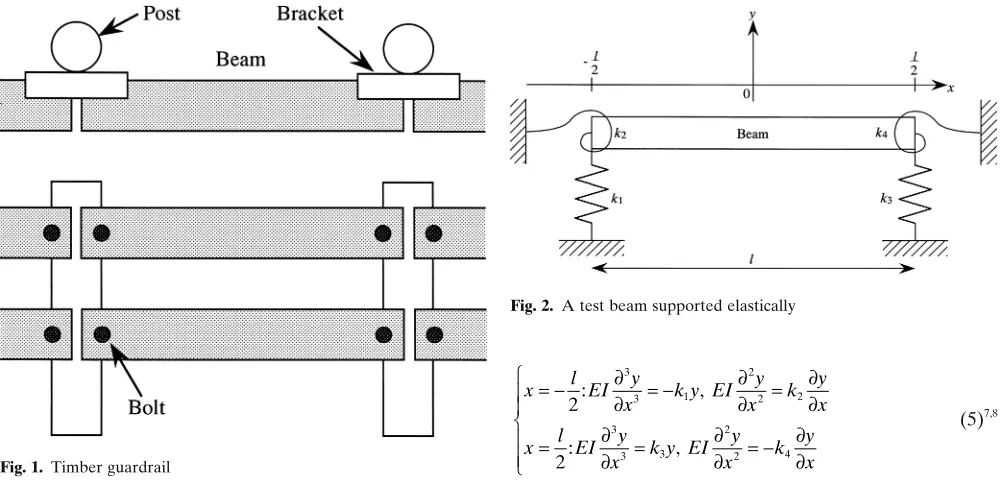
A beam for a timber guardrail is fixed to a post by a bolt through a bracket (Fig. 1). Therefore, the end conditions of the beams used as timber guardrails are thought to be be-tween those of simply supported ends and fixed ones. In actual structures, however, the resonance frequency of beams with simply supported ends is increased by 20% when taking the restriction by joints and the effect of floor joists into account.4–6
Theory
An elastically supported beam
According to the Euler-Bernoulli theory, the differential equation for the bending of a beam is
EI y x A y t =∂ + = ∂ ∂ ∂ 4 4 2 2 0
r , (1)
where E, I, y, x, r, A, and t are Young’s modulus, moment of inertia of a cross section, lateral deflection, distance along the beam, density, cross-sectional area, and time, respectively.
Solving Eq. 1 gives us
y=C1coslnx C+ 2sinlnx C+ 3coshlnx C+ 4sinhlnx, (2)
where C1–C4 are constants, and
ln r
n 4
2 2
=
(
pf)
AEI , (3)
where fn and n are resonance frequency and resonance
mode number, respectively. Then, resonance frequency is
f m l EI A n n = 2 2
2p r , (4)
where mn = lnl and l is length.
The first resonance mode is discussed in this study. For symmetric modes, C2 = C4 = 0.
When the ends of a beam are restricted by springs for vibration in the y-direction (k1 and k3 in Fig. 2) and rotation
(k2 and k4 in Fig. 2), the boundary conditions are
x l EI y
x k y EI
y
x k
y x
x l EI y
x k y EI
y x k y x = - = - = = = = -Ï Ì Ô Ô Ó Ô Ô 2 2 3 3 1 2 2 2 3 3 3 2 2 4 : , : , ∂ ∂ ∂ ∂ ∂ ∂ ∂ ∂ ∂ ∂ ∂ ∂ (5)7,8
Substituting Eq. 2 into Eq. 5 under conditions of k1 = k3
and k2 = k4 gives
EI l k lEI l k l
EI l k lEI l k l
C C
l l l l l l
l l l l l l
n n n n n n n n n n n n 3 1 3 1 2 2 1 3
2 2 2 2
2 2 2 2
0 0 sin cos sinh cosh
cos sin cosh sinh
. - -- - + È Î Í Í Í Í ˘ ˚ ˙ ˙ ˙ ˙ È Î Í ˘ ˚ ˙ =È Î Í ˘ ˚ ˙ (6)
When the solution of Eq. 6 is not C1 = C3 = 0, the
deter-minant of the matrix is 0. Then, the following equation is obtained.
EI l k EI k l
EI l k EI k l
l l l l
l l l l
n n n n n n n n 3 1 2 3 1 2 2 2
2 2 0
tan tanh
tanh tan .
-Ê Ë Á ˆ ¯ ˜Ê + Ë Á ˆ ¯ ˜ +Ê -Ë Á ˆ ¯ ˜Ê + Ë Á ˆ ¯ ˜ = (7)
With both end parts of a specimen being supported by posts in our experiment, k1 is assumed to be •.
Conse-quently, Eq. 7 is
tanm tanhm EI
k l m
n n
n
2 2
2
2
+ = - . (8)
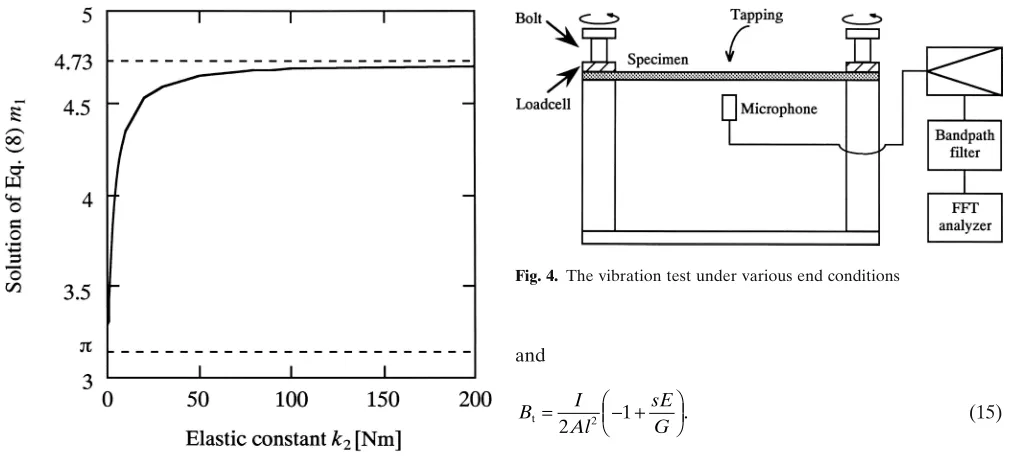
If k2 = 0, Eq. 8 becomes
tan tanh .
mn mn
2 + 2 = • (9)
Hence, m1 is p. This is the value for a simply supported
beam.
If k2 = •, Eq. 8 becomes
tan tanh .
mn mn
2 + 2 =0 (10)
Fig. 1. Timber guardrail
Hence, m1 is 4.730. This is the value for a beam with fixed
ends.
The m1 of Eq. 8 is plotted to k2 as shown in Fig. 3.
Timoshenko theory of bending
Flexural vibration is influenced by shear and rotary inertia. Timoshenko added these terms to the Euler-Bernoulli el-ementary theory of bending and developed the following differential equation of bending:9
EI y x A y t I sE G y x t s I G y t ∂ ∂ ∂ ∂ ∂ ∂ ∂ ∂ ∂ 4 4 2 2 4 2 2 2 4 4 1 0 + - Ê + Ë Á ˆ ¯ ˜ + =
r r r , (11)
where G is shear modulus and s = 1.18 is the shear deflection coefficient.10
When Eq. 11 is solved under the fixed–fixed condition, the resonance frequency fn can be written as follows:
f p l EI A n n = 2 2
2p r . (12)
The value of pn in Eq. 11 is obtained by the following
transcendental equations: tanh tan p
B p A p
p
B p A p
B p A p
B p A p
n t 2
n t n
2
n t 2
n t n
t n 4
t n 2
t n t n
2 1 2 1 1 1 4 4 2 2
2 4 2
+
-+ -+
= - + +
+
-(13)
for symmetric modes, where
A I Al sE G
t= +
Ê Ë
Á ˆ
¯ ˜ 2 2 1
, (14) and B I Al sE G t= - +
Ê Ë
Á ˆ
¯ ˜
2 2 1 . (15)
Experimental
Specimens
To investigate wood species with various density, kiri (pau-lownia, Paulownia tomentosa Steud.), sugi (Japanese cedar, Cryptomeria japonica D. Don), akaezomatsu (Sakhalin spruce, Picea glehnii Mast.), shioji (ash, Fraxinus spae-thiana Lingelsh.), and shirakashi (white oak, Quercus myrsinaefolia Blume) were used as specimens. The dimen-sions of each specimen were 300 mm (longitudinal, L) in length, 25 mm (radial, R) in width, and 5 or 10 mm (tangen-tial, T) in thickness.
The specimens were conditioned at 20°C and 65% rela-tive humidity for several months. The tests were conducted under the same conditions.
Vibration test
To obtain the resonance frequency of the first mode by bending, flexural vibration tests were conducted by the fol-lowing procedure. An apparatus (End condition controller KS-200 Takachiho Seiki) shown in Fig. 4 was used to pro-vide various end conditions. The regions of 25 (L) ¥ 25 mm (R) from both ends were supported by the posts of the apparatus, the cross section of which was 25 ¥ 25 mm. By screwing a bolt attached to a load cell, the test beam was compressed. The compressing load was measured by the load cell and recorded by a data logger. The vibration was excited in the direction of the thickness at the center part by a hammer. Motion of the beam was detected by a micro-phone in the center part. The signal was processed through a fast Fourier transform (FFT) digital signal analyzer to yield high-resolution resonance frequencies.
A free–free flexural vibration test was also undertaken to measure the Young’s and shear moduli. A test beam was Fig. 3. Solutions of Eq. 8 for various k2. Parameters used: Young’s
modulus 12 GPa, width 25 mm, thickness 5 mm, length 300 mm
suspended by two threads at the nodal positions of the free– free vibration corresponding to its resonance mode. The vibration was excited and recorded by the above-described method. The Young’s and shear moduli were calculated with the following regression method, which is called the “TGH method” in this article.
Goens11
approximated the solution of the Timoshenko differential equation (Eq. 11) by a Taylor series. Hearmon12
regarded the approximated equation of the solution as a linear equation. Using the Young’s moduli based on the Euler-Bernoulli elementary theory of bending of several resonance modes, the regression is made and the Young’s and shear moduli can be obtained from the slope and inter-cept.12
By the TGH method, Young’s modulus (ETGH) and
shear modulus can be calculated at the same time using only the flexural vibration test.
Substituting ETGH and mn = 4.730 (the frequency
equa-tion of a beam with free ends is the same as Eq. 10) into Eq. 4, the resonance frequency without the shear and rotary inertia effects (f0) was obtained. On the other hand, the
resonance frequency taking the shear and rotary inertia effects into account (fS) was calculated by solving Eq. 13
with “Mathematica Ver. 3.0” software (Wolfram Research) using ETGH and the shear modulus, and then substituting
ETGH and the obtained pn into Eq. 12.
Results and discussion
For all the wood species used for the experiments, the mea-sured resonance frequency increased rapidly early in the increasing compression load process and approached the value of the fixed ends (Fig. 5). This trend was similar to the m1–k2 relationship shown in Fig. 3. These results show that
the measured resonance frequency, and consequently the specific Young’s modulus, ran the risk of being smaller than the true value if the wood was not fixed completely to the post of a guardrail. It is difficult to place and remove a load cell or a torque meter on site. Therefore, the stable
reso-nance frequency should be recorded by increasing the load for fixing it.
However, it should be noted that the measured reso-nance frequency that was stable at larger compression stress was smaller than f0: for example, the resonance frequency at
the maximum compression stress (fM) was about 95%
(thickness: 5 mm) and 85% (thickness: 10 mm) of f0 (Table
1). These discrepancies cannot be ignored, especially in the case of thickness = 10 mm: the specific Young’s modulus is 0.852
= 0.72 of the true value.
The resonance frequency of the part of a beam without compression stress is decreased by the shear and rotary inertia effects in flexural vibrations when a beam is thick and resonance mode number is large.9
Thus, such effects were examined. The fact that fS decreased by only 0.3%–1%
and less than fM (Table 1) means that the shear and rotary
inertia effects in the part without the compression stress were not serious.
Table 1. Ratio of measured resonance frequency to estimated frequency
Wood type fM/f0 fS/f0
Thickness: 5 mm
Paulownia 0.957 0.997
Cedar 0.959 0.998
Spruce 0.952 0.997
Ash 0.940 0.996
Oak 0.941 0.997
Thickness: 10 mm
Paulownia 0.856 0.990
Cedar 0.885 0.992
Spruce 0.841 0.987
Ash 0.803 0.984
Oak 0.867 0.991
fM, The measured resonance frequency at the maximum compression stress; fS, the resonance frequency taking the effect of shear deforma-tion and rotary inertia into account estimated by substituting ETGH and
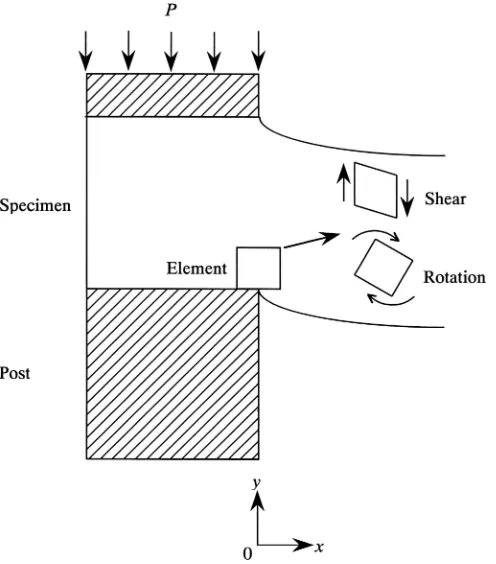
Next, the shear deformation and rotation at the com-pressed part was examined to investigate the poor fixation. Although the part of a specimen around a post apparently did not vibrate in the thickness direction because of com-pression, it would be difficult to restrict the shear deforma-tion and rotadeforma-tion perfectly: dividing a test specimen into many elements like a finite element method (FEM) simula-tion, the shear deformation and rotation of elements around x = 0 in Fig. 6 will not be restricted sufficiently. The length–thickness plane of such an element will be shear-deformed and rotated easily during vibration in the thick-ness direction. In this case, the slope around the compressed part is not 0 and k2 will not be •.
According to the theory described above, under the
con-dition of k1 = • and k2 π •,
mn mn
2 +tanh 2 π0 in Eq. 10. Hence, m1 is smaller than the value for a beam with fixed
ends (Fig. 3), thus, the resonance frequency decreases. Assuming that the size of the element is the same, there are more elements in the thickness direction in a thick specimen than in a thin one. Therefore, the resonance fre-quency decreased more in the case of thickness = 10 mm than 5 mm. When k2 π •, mn is also influenced by E, I, and
l from Eq. 8 (see Fig. 7).
Although it is difficult to obtain the resonance frequency accurately from the fixed–fixed flexural vibration test men-tioned above, this testing method is nevertheless effective to maintain and control qualities of timber guardrails. This testing method is useful for the 100% inspection of wooden beams for timber guardrails and the results dominate me-chanical properties.
Fig. 6. Deformation of an element at compressed parts
Fig. 7. Method for solving Eq. 8
Members of metal guardrails are manufactured in facto-ries so that their qualities meet the requirements of Ministry of Land, Infrastructure, and Transport of the Government of Japan, which means that all members are tested. Simi-larly, the 100% inspection will have to be conducted in the case of timber guardrails. Testing all wooden beams directly after constructing timber guardrails enables the initial prop-erties and location of each beam to be obtained simulta-neously. Consequently, periodic inspections of timber guardrails will be simplified. For example, inspections can be concentrated on beams with lower initial resonance frequency.
A visual inspection is also important and can be per-formed simply, but the vibration test has particular advantages over it. The resonance frequency reflects the mechanical properties of the inner layers, unlike the the visual inspection which can only provide information on the surface. Results of the visual inspection may also be different from worker to worker. Even if a wooden beam looks deteriorated, it may not be necessary to replace a beam if the mechanical qualities fulfill the requirements.
Conclusions
The resonance frequency in timber guardrail beams be-tween the simply supported condition and fixed condition was obtained from flexural vibration tests. The results were as follows:
Acknowledgments This work was financially supported by the “Study on durability design and maintenance of timber guardrails and timber sound insulation walls” of the “Research Project for Utilizing Ad-vanced Technologies in Agriculture, Forestry, and Fisheries.” We thank Dr. Hiroshi Yoshihara of Shimane University and Ms. Masami Yaguchi for their assistance.
References
1. Kamiya F (2003) Mokuzai Hozon 29:53–57
2. Kitayama S (2004) Development of wooden road facilities (in Japanese). Mokuzai Kogyo 59:436–442
8. Jimbo Y, Furukawa E (1964) Exercise of vibration engineering (in Japanese). Gakken-sya, Tokyo
9. Timoshenko SP (1921) On the correction for shear of the differen-tial equation for transverse vibrations of prismatic bars. Philos Mag Sixth Series 41:744–746
10. Nakao T, Okano T, Asano I (1984) Measurement of anisotropic shear modulus by the torsional-vibration method for free–free wooden beams. Mokuzai Gakkaishi 30:877–885
11. Goens E (1931) Über die Bestimmung des Elastizitätsmodulus von Stäben mit Hilfe von Biegungsschwingungen. Ann Phys 5F 11:649– 678