Enhanced LSTM For ASD Classification
S. Padmapriya, S. MuruganAbstract: Autism Spectrum Disorder (ASD) is a developmental disorder that affects 1 in every 59 children. Latest researches determined about the substantial association of ASD with gene sequences. Technological advancements in hardware and software during the last decade made gene extraction, storing and analysis processes more comfortable. Identifying ASD in earlier stage is the key to get best treatment and total recovery from it. This work is indented to apply data mining and machine learning procedures to detect the presence of ASD and identify its classification by analyzing gene sequences. The concept of Recurrent Neural Network (RNN) is picked as the radical base of the proposed work. Automatic Variable Threshold LSTM (AVTL) and Modified Softmax Layer (MSL) are introduced and integrated in this work named as ―Enhanced LSTM for ASD Classification (ELAC)‖ to improve the classification performance of conventional Long Short-Tern Memory (LSTM) in the process of ADS classification. MSL is used to improve the classification accuracy, sensitivity and specificity of the proposed method whereas AVTL is introduced to reduce the processing time without affecting other parameters.
Index Terms: Autism Spectrum Disorder Classification, Gene Sequence based ASD classification, Recurrent Neural Network, Long Short-Term Memory, Softmax Layer, Variable Threshold LSTM
————————————————————
1.
INTRODUCTION
ASD is a disorder that affects many children at different ages which is curable when detected in its early stages. It is a perception related disorder that affects the normal listening, learning and common social interaction activities. ASD is diagnosis is performed when a child is suspicious to have learning disorders by observing its activities and interaction behavioral pattern. This method is less effective for treatments because the detection process is performed only after the disorder happened[1]. A prediction related to ASD classification in earlier stages could help in treating ASD prone children. The disorder can be treated optimally based on the prediction with specific formulated treatment sequence which has the highest healing probability [2]. Recent researches in genetic engineering manifests that many of the diseases and disorders including ASD are correlated to some gene sequences [3][4][5].Many gene patterns are identified to have an impact on development of ASD in lateral stages [6]. The best part of this gene based ASD classification is that the gene sequence can beextracted from a fetus with noninvasive methods [7] or amore accurate gene sequence extraction can be performed during the birth using stem cells. In both cases, probing the baby tangibly is not required to extract the gene sequence. These advanced technologies can extract the complete human gene sequence of 3234.83 Mega base-pairs. Gene sequences are stored as Binary Alignment Map (BAM) files which are about 80TB in size. Processing these huge files directly will overload computer drives and processor[8]. Fortunately, there are some domain specific data compression techniques are used to compress the gene sequences into smaller computer files.A single bit variation in gene sequence can change the characteristics of the entire sequence, thus gene sequence compression techniques are strictly restricted to use lossless compression. A, G, T and C are the limited characters that represents the entire gene sequence[9]. Therefore, the 80TB BAM datafile can be effectively converted into a less than 1GB compressed file. Manually analyzing the
gene sequence for finding and classifying ASD related genes is a complicated time-consuming process. Creating and educating an automated machine learning mechanism to classify the gene sequence will extremely reduce the complexity of the process which will be a great assist to the modern medical science. Classification accuracy, precision, sensitivity, specificity, F1-Score and processing time are the considerable characteristics of the gene sequence based ASD classification procedure. RNN is one of the proven methods to handle large gene sequence files [10] – which is selected as the base of this proposed work.
2.
EXISTING METHODS
Support Vector Machine (SVM), Random Forest (RF), Naïve Bayes (NB), Classification & Regression Tree (CART), Fisher Discriminant Analysis (FDA) and Bagging Random Forest (BRF) are some of the existing notable classifiers. There are some most recent research works which are using these classification methods for gene sequence based ASD classification. They are, The Genetic-Evolutionary Random Support Vector Machine Cluster Analysis in Autism Spectrum Disorder (GERSVM) [11]uses the SVM method, Subtyping cognitive profiles in autism spectrum disorder using a functional random forest algorithm (SCPFRF) [12]uses Random Forest as the base, An integrative systems medicine approach to delineate complex genotype-phenotype associations in Autism Spectrum Disorder (ISMADCGA) [13] uses Naïve Bayes method, Multivariate techniques enable a biochemical classification of children with autism spectrum disorder versus typically‐developing peers: A comparison and validation study (MTEBC) [14] uses CART & FDA methods and Brain-specific functional relationship networks inform autism spectrum disorder gene prediction (BSFRN) [15] uses Bagging Radom Forest. These works are taken here as the existing works for clear analysis and for performance comparison.
2.1.The Genetic-Evolutionary Random Support Vector Machine Cluster Analysis in Autism Spectrum Disorder (GERSVM)
SVM is one of the renowned data mining procedure with a retentive history. As the name suggests, SVM method is taken as the base of GERSVM work. GERSVM uses fMRI data from 103 patients and 106healthy controls. A Genetic-Evolutionary random SVM clustering model is introduced in this work which operates based on Binary matrix. Initial SVM model is built by ————————————————
S.Padmapriya is currently working as Assistant Professor, Department of Computer Science, SRM Trichy Arts & Science College, Trichy, Tamil Nadu, India. E-Mail: [email protected]
2429 picking features and training examples partially until the SVM
model reaches count. Then binary matrices are created for each SVM cluster with 4275 feature columns. The binary matrices’ elements are assigned with 1 if the taken sample contains the corresponding feature and 0 is assigned if the feature is not present in the sample. Then the fitness function is created to process the matrices. Though GERSVM method has higher accuracy, the processing time is very high due to the iterative process on multiple higher size matrices, which is the main limitation of this method.
2.2.Subtyping cognitive profiles in autism spectrum disorder using a functional random forest algorithm (SCPFRF)
SCPFRF is designed based on the Random Forest Classification procedure. SCPFRF is implemented to classify DSM-5 neurodevelopmental disorder which affects interaction social communications and repetitive behaviors. A Random forest machine learning Classification model is introduced in SCPFRF to get higher accuracy, sensitivity and specificity. Distance matrices are generated between the different participants to identify the ASD subgroups. SCPFRF address some issues such as Lack of medicine precision and ASD heterogeneity in ASD treatment. SCPFRF depends on the fMRI data for the classification process. Introduction of a functional random forest method based on conventional random forest algorithm is the innovation of this work. Evaluation using a smaller number of samples, lacking subgroup differentiation capability and processing time are the limitations of this work.
2.3.An integrative systems medicine approach to delineate complex genotype-phenotype associations in Autism Spectrum Disorder (ISMADCGA)
ISMADCGA work is targeted to identify the ASD correlated genotypes-based Copy Number Variants (CNV) which is widely used for ASD screening process nowadays. A new integrative machine learning is introduced to determine associations between ASD and broken biological CNVs in brain-expressed genes. A Naïve Bayes classifier is used to detect the ASD phenotypes. CNV frequency in control population was estimated using genotypes to improve the precision of proposed classifier. A thirteen different developmental states of brain-expressed gene group which is extracted from RNA sequence data is used to monitor the early brain developmental state. Though ISMADCGA acquired
high precision values, the recall value is below average which is considered as the prime disadvantage of this method.
2.4.Multivariate techniques enable a biochemical classification of children with autism spectrum disorder versus typically‐developing peers: A comparison and validation study (MTEBC)
A biochemical diagnostic method is developed in MTEBC by evaluating five different classification algorithms. CART, Fisher Discriminant Analysis (FDA), Logistic Regression (LR), Principal Component Analysis (PCA) and Univariate classification method are analyzed with different threshold values in this work. Same input data, data validation function, Metabolites, Kernel Density Estimator, Training data and testing data are used to evaluate the selected classification procedures. A slight improvement in results was found while using FDA method at threshold value is stated based on the MTEBC experiments. Smaller datasets with Limited number of samplesare used in this work as well as the processing time of the procedures are not taken for evaluation – which are considered as the limitations of this work.
2.5.Brain-specific functional relationship networks inform autism spectrum disorder gene prediction (BSFRN) BSFRN takes advantages of the solid influence of ASD candidate genes in the occurrence of the neuropsychiatric disorder. The genes those have transmission loss of function mutations are the tangible cause for disorders. BSFRN is indented to reduce the false positive results by prioritizing ASD candidate genes. In BSFRN implementation procedures such as SVM, Random Forest, ERTrees, Bagging Random Forest and AdaBoost Random Forest classification procedures are evaluated. Bagging Random Forest is proposed in BSFRN and it secured the highest accuracy values than the other methods. Rare autism genes such as Chromodomain Helicase DNA binding protein 7 (CHD7), CHD8 and CCCTC binding Factor (CTCF) are clearly detected by the BSFRN method. The data driven candidate gene ranking process of BSFRNis submitted as the useful method in genetic ASD prediction. Processing time of different methods for the prediction process is not measured during the evaluation. Processing time is one of the vital factors while processing large data such as gene sequence which is the limitation of this work.
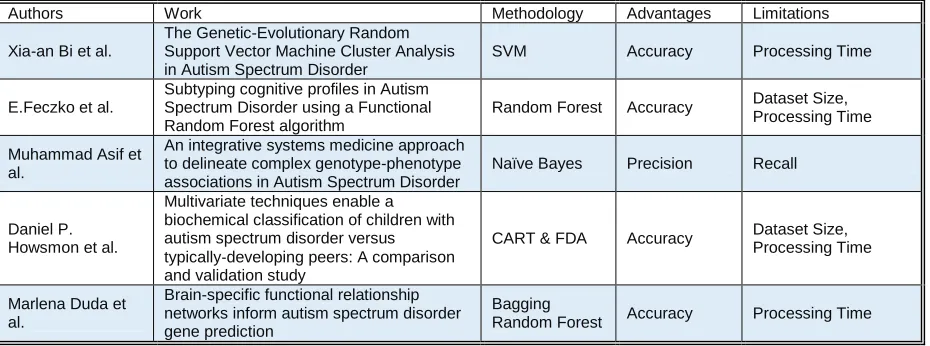
Existing classification works, their methodologies, advantages and limitations are given in following Table 1.
Authors Work Methodology Advantages Limitations
Xia-an Bi et al.
The Genetic-Evolutionary Random Support Vector Machine Cluster Analysis in Autism Spectrum Disorder
SVM Accuracy Processing Time
E.Feczko et al.
Subtyping cognitive profiles in Autism Spectrum Disorder using a Functional Random Forest algorithm
Random Forest Accuracy Dataset Size, Processing Time
Muhammad Asif et al.
An integrative systems medicine approach to delineate complex genotype-phenotype associations in Autism Spectrum Disorder
Naïve Bayes Precision Recall
Daniel P. Howsmon et al.
Multivariate techniques enable a biochemical classification of children with autism spectrum disorder versus typically‐developing peers: A comparison and validation study
CART & FDA Accuracy Dataset Size, Processing Time
Marlena Duda et al.
Brain-specific functional relationship networks inform autism spectrum disorder gene prediction
Bagging
Random Forest Accuracy Processing Time
3.
RELATED WORKS
LSTM is one of the wide used RNN architecture used in deep learning applications. Softmax layer is the neural network layer which consists of a normalized exponential function (softmax function) to classify the input vector intodifferent probability distributions. Some basic concepts of existing LSTM and Softmax layer are utilized in the proposed work. Short descriptions about these concepts are given here to accommodate the changes in the proposed method.
3.1. LSTM
LSTM is defined using a set of equations to represent the input, forget and output gates. The standard equations of a LSTM model are given below.
( ) Equation (1)
( ) Equation (2)
( ) Equation (3)
( ) Equation (4)
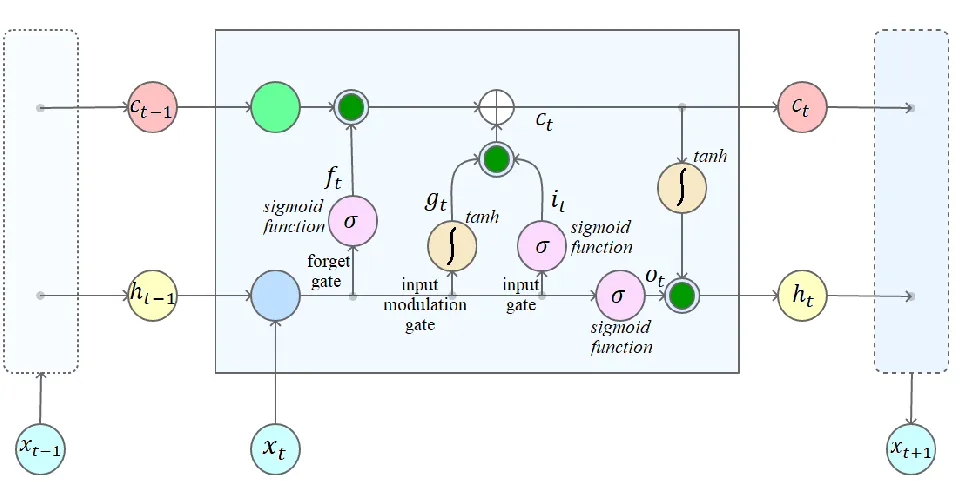
( ) Equation (5) where is the input vector given to the LSTM, is the activation vector of forget gate, is the activation vector of input gate, is the activation vector for output gate, is the hidden state output vector and is the cell state vector. are the weight matrices and is the bias vector with the preliminary conditions , , , is the Hadamard product, is the number of input features, is the hidden units count, is the sigmoid function, and are hyperbolic tangent functions. LSTM can be trained using supervised methods. Therefore, a standard dataset with well defined features and training label outputs is required to train the LSTM model. Backpropagation or Gradient descent optimizations algorithms can be applied during the training phase. Connectionist Temporal Classification (CTC) is used to improve learning accuracy[16]. Standard LSTM architecture is given below in Figure 1.
Figure 1: Standard LSTM architecture
3.2. Softmax Layer
Softmax layer which is designed with a normalized exponential function is final part of a LSTM architecture. This layer is responsible for converting the real numbers vector into proportional probability distributions[17]. The real number vector from the output layer of a LSTM may contain several values which is not restricted to the range between 0 to 1 and the sum of the components may not achieve the value 1. The softmax layer converts these values to be in the range of 0 to 1 and the sum of all components will be equal to 1. The standard softmax function is defined as
( )
∑
Equation (6)
Substitution of different base for is permitted in the softmax functions. A different base can be substituted instead of
e, then the value of b will be represented either or . Substituting this value in Equation 6 will be
( )
∑
or
∑
Equation (7)
The multiclassification ability of the softmax layer is achieved for distinct linear functions with predicted probability vector x and weighting vector by the following equation.
( | )
∑
Equation (8)
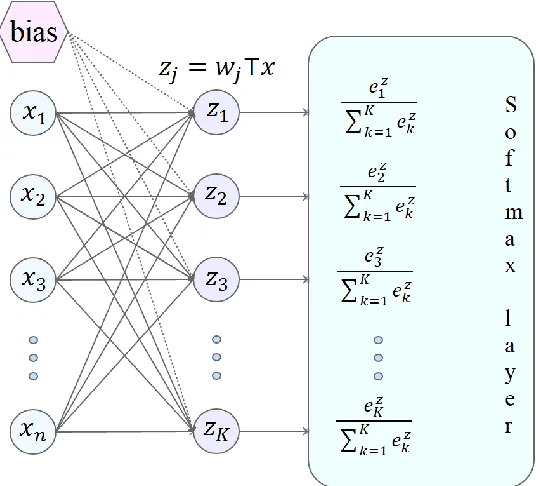
The softmax function is placed in the last layer named as softmax layer in a multi-decision neural network as illustrated
2431 Figure 2: Softmax Layer in a multi-decision neural network
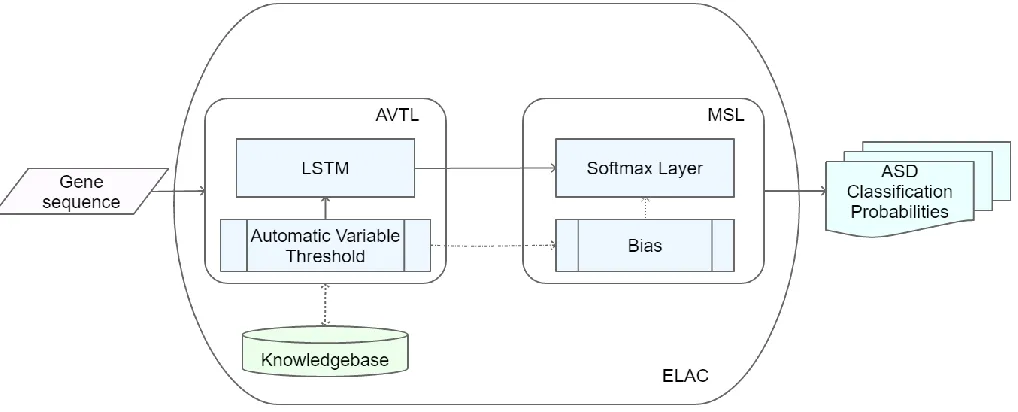
4. Proposed Method: Enhanced LSTM for ASD Classification (ELAC)
Automatic Variable Threshold LSTM (AVTL) and Modified Softmax Layer (MSL) are the primary contributions integrated in proposed ELAC method. AVTL is used to maintain a threshold in the length of gene sequences associated with ASD proteins. This is used to reduce the processing timewithout affecting the prediction accuracy.MSL is designed in a way to produce the probability of ASD occurrence based on the count of gene sequences of proteins those are associated with ASD. MSL is used to improve the prediction accuracy without increasing processing time significantly.
4.1. Automatic Variable Threshold LSTM
AVTL maintains a threshold to determine the gene sequence length taken for processing for each ASD classification. One or more gene sequences are related to every ASD classification which are noted as signature genes. By identifying the gene sequences and their counts, the type of ASD and the probability of occurrence can be predicted. These signature gene sequences are labeled with different IDs such as S0000, S0001… For example, the gene sequences associated with Asperger’s Syndrome are given in
Figure 3.
Let be the set of signature gene sequence lengths of different ASD classifications represented as * +. A set of length threshold values are assigned to all signature gene sequences as * +. The initial values of these threshold values are assigned using the following equation
Equation (9)
Processing entiregenome sequence for different ASD associated signature gene sequence in a sequential manner will consume more time. A genome sequence parallel parser is introduced to reduce the processing time. The heuristics approach is used to take a parallel diversion while continuing the sequence run through the regular RNN. Whenever the gene sequence is identified to match a particular ASD associated sequence with of the portion where is the
length of a particular signature gene length and is the initial length threshold value, then a heuristic parallel search is
initialized by the associative genome sequence parallel parser. Every single heuristic genome sequence parallel parser is indented to validate a sequence with a particular sequence ID. The sequence is pre-loaded into memory and a batch X-OR operation ( ) is performed to find the exact or relational match of the sequence. If a sequence match scores more than 90% of 0s, then the match with that particular ASD associated sequence will be triggered. The Associative genome sequence parallel parser is explained in Figure 4.The threshold values are fine-tuned during the training process to reduce the processing time while maintaining accuracy. The threshold values are increased in successive approximation manner with
while there is a decrease found in accuracy.
The threshold values are decreased there is no change in accuracy, which will reduce the processing time during testing phase. The length threshold fine tuning algorithm is given below.
Figure 4: Parallel parsing of Signature genes
Algorithm: Length Threshold Fine Tune
Input: Gene sequence
Output: Trained LSTM with optimized Step 1: Let * +be the set of signature gene lengths
Step 2: Let * + be the length threshold values set
Step 3: Initialize by Equation 1 Step 4: Repeat step 5 until end of input sequence
Step 5: Parse for signature genes Step 6: if signature gene found
Step 7: Assign
Step 8: call parallel parser with
Step 9: If detection successful, then Calculate by Equation (9)
Step 10: else calculate by Equation (9)
Step 11: if (| | ), then go to step 7
Step 12: else assign Step 13: Repeat from Step 5 until end of input data
Step 14: Return
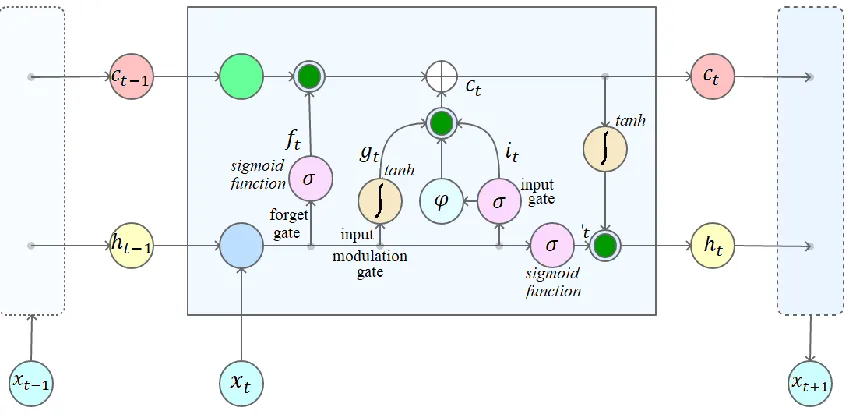
2433 Figure 5: Enhanced LSTM
4.2. Modified Softmax Layer (MSL)
MSL is designed to determine the occurrence probability of a particular ASD classification based on the signature gene counts. While analyzing the benchmark Autism Genome Project (AGP) dataset from National Center for Biotechnology Information (NCBI), it is learned that the signature gene sequence count has a direct correlation with the occurrence of particular type ASD. A single ASD subgroup can have multiple signature gene sequences and the occurrence of ASD is assured when a single signature gene sequence or the sum of multiple signature gene sequences repeats more than 5 times in an input sequence. That is the 6 repeated occurrences of related signature genes assure 100% striking possibility of that ASD subgroup. The probability of ASD occurrence for signature gene counts 1, 2, 3, 4, 5 and 6 are 0.5%, 2%, 5%, 15%, 40% and 100% respectively. Let is the set of signature gene sequence count set with members , then the probability function is defined as in the following equation 10.
Equation (10)
By substituting the value of into Equation 8, the softmax function will be as follow
( )
∑
Equation (11)
The probability percentage can be directly calculated as⌊ ⌋. The accuracy of this probability function for signature gene count 0 to 6 is given in Table 2.
Signature Gene Count
Actual Probability
Calculated Probability ⌊ ⌋
Error
0 0 0 0
1 0.5 0 0.5
2 2 1 1
3 5 5 0
4 15 13 2
5 40 37 3
6 100 100 0
Table 2: Probability function accuracy
The probability error ratio for signature gene sequence counts 0,1 and 2 are significantly high. The error rate for lower gene sequence counts are reduced further by the following equation 12
{ ⌊ ⌋
Equation (12)
Figure 6: Modified Softmax Layer
Overall flow diagram of proposed ELAC method is given in Figure 7. By this way the proposed method ELAC classifies
the ASD subgroups using gene sequences by integrating AVTL and MSL functional blocks.
Figure 7: Overall flow diagram of ELAC
5. EXPERIMENTAL SETUP
Animmenseaggregation of data is acquired from the National Center for Biotechnology Information (NCBI) website. The Autism Genome Project (AGP) Consortium – is a complete genome association stage I and II study over 1500 offspring Trios [18]. This dataset is authorized by Department of Health and Human Services – National Institute of Health. The software frameworks to access the dataset are provided by the NCBI itself for research purposes. Each genome record contains around 800000 lines of genome sequences which contain a minimum of 65000000 polypeptides collected to find ASD subgroup signature gene sequences. CoreLib software
2435 controls are controlled by the specially designed User
Interface Application to measure the evaluation metrics of the existing and proposed methods.
6. Results and Analysis
The experiments are conducted by splitting the entire dataset into 10 different data chunks to evaluate the intercede functioning performance of existing methods and proposed method. The classification Accuracy, Sensitivity, Specificity, F1-Score and processing time are measured for all methods at each time chunk to get complete analysis.
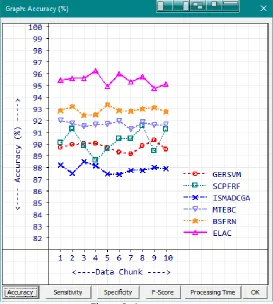
6.1. Accuracy
Accuracy is one of the prime evaluating factors of any classification algorithm. Accuracy is calculated as
( )
( ), where is True Positive, is True Negative,
is False Positive and is False Negative. Accuracy is directly proportional to the quality of a classification algorithm. The measured values of accuracy for existing methods and proposed method are given in Table 3.
Accuracy (%) Data
Chunk
GERSV M
SCPF RF
ISMADC GA
MTEB C
BSFR
N ELAC 1 89.72 90.14 88.2 92.01 92.87 95.48 2 89.97 91.34 87.51 91.77 93.24 95.63 3 90.06 89.88 88.51 91.54 92.46 95.62 4 90.06 88.64 88.19 91.67 92.52 96.29 5 89.74 89.61 87.46 91.73 93.36 94.93 6 89.33 90.47 87.43 91.96 92.86 96.03 7 89.17 90.48 87.76 91.28 92.85 95.35 8 89.88 91.59 87.79 91.88 93.04 95.78 9 90.38 89.45 88.01 91.64 93.15 94.75 10 89.57 91.26 87.92 91.65 92.76 95.13
Table 3: Accuracy (%)
Proposed ELAC method scored maximum classification accuracy average of 95.49% with the minimum-maximum range of 94.75% to 96.29%. A comparison graph is provided below in Figure 8. Next highest classification accuracy average of 92.91% is secured by the existing procedure BSFRN.
Figure 8: Accuracy
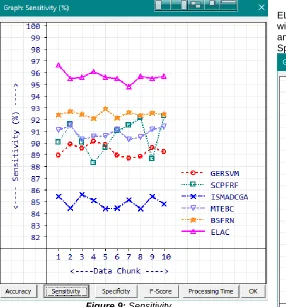
6.2. Sensitivity
Sensitivity and Recall are synonyms used to refer True Positive rate which reflects the quality of a classification algorithm. The higher values of sensitivity refer the higher quality of the algorithm. Sensitivity is calculated using the formula ( ). Calculated Sensitivity values of the participated methods are given in Table 4.
Sensitivity (%) Data
Chunk
GERSV M
SCPF RF
ISMADC GA
MTEB C
BSFR
N ELAC 1 88.99 90.09 85.5 91.14 92.43 96.66 2 89.95 91.65 84.48 91.51 92.74 95.51 3 89.55 90.07 85.62 90.34 92.49 95.6 4 90.2 88.3 85.11 90.59 92.12 96.11 5 89.85 89.63 84.4 90.62 92.92 95.61 6 88.97 91.05 84.46 91.18 92.19 95.51 7 88.74 91.5 85.2 90.34 92.64 94.84 8 88.88 92.15 84.44 90.5 92.39 95.71 9 89.63 88.68 85.49 91.16 92.59 95.51 10 89.27 92.31 84.81 91.4 92.45 95.73
Table 4: Sensitivity (%)
Figure 9: Sensitivity
6.3. Specificity
Specificity which is also known as True Negative Rate refers the classification algorithms’ ability in identifying the negative results. Specificity has the equal priority to the sensitivity in classification and data mining algorithms. Specificity is calculated using the formula ( ). Measured Specificity values are tabulated and given in Table 5.
Specificity (%) Data Chunk GERS VM SCPF RF ISMAD CGA MTE BC BSF RN ELA C
1 90.48 90.18 91.36 92.9 3
93.3 2
94.3 6
2 89.99 91.04 91.13 92.0 3
93.7 5
95.7 6
3 90.58 89.69 91.9 92.8 92.4 2
95.6 4
4 89.92 88.99 91.88 92.8 1
92.9 2
96.4 9
5 89.63 89.6 91.11 92.9 1
93.8 2
94.2 7
6 89.7 89.9 90.94 92.7 5
93.5 5
96.5 6
7 89.61 89.51 90.72 92.2 7
93.0 5
95.8 6
8 90.93 91.03 91.85 93.3
6 93.7 95.8
4
9 91.15 90.26 90.92 92.1 3
93.7 3
94.0 2
10 89.88 90.26 91.63 91.9 1
93.0 6
94.5 4 Table 5: Specificity (%)
Minimum, Average and Maximum Specificity index of ELAC is 94.02, 95.33 and 96.56 respectively. BSFRN follows with the next grade specificity index values of 92.42, 93.33 and 93.82 for minimum, average and maximum in order. The Specificity comparison graph is given in Figure 10.
Figure 10: Specificity
6.4. F1-Score
F1-Score is the resonance mean of Precision and Sensitivity of the classification algorithm. F1 Score is calculated by the
formula ( )
. The F1-Score gets a value between 0 and 1 to represent the hormonic quality of precision and sensitivity. The value 0 refers the worst case and 1 refers the best case. The higher F1-Score towards 1 indicates the higher quality of the classification procedure. The F1-Scores of existing and proposed methods are given in Table 6. F1-Score (%) Data Chunk GERSV M SCPF RF ISMADC GA MTEB C BSFR
N ELAC
1 0.9 0.9 0.89 0.92 0.93 0.95
2 0.9 0.91 0.88 0.92 0.93 0.96
3 0.9 0.9 0.89 0.92 0.92 0.96
4 0.9 0.89 0.89 0.92 0.93 0.96
5 0.9 0.9 0.88 0.92 0.93 0.95
6 0.89 0.9 0.88 0.92 0.93 0.96
7 0.89 0.9 0.88 0.91 0.93 0.95
8 0.9 0.92 0.88 0.92 0.93 0.96
9 0.9 0.9 0.88 0.92 0.93 0.95
10 0.9 0.91 0.88 0.92 0.93 0.95
2437 Figure 11: F1-Score
The F1-Score averages of ISMADCGA, GERSVM, SCPFRF, MTEBC, BSFRN and ELAC are 0.88, 0.89, 0.90, 0.92, 0.93 and 0.96 respectively given in low to high order. The F1-Score comparison graph is given in Figure 11.
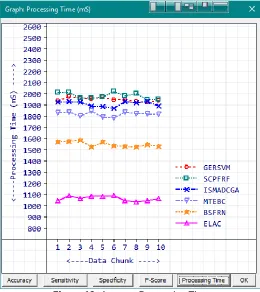
6.5. Processing Time
Processing time is one of the important factors in measuring the quality of the classification algorithms. It is inversely proportional to the quality of the algorithm. That is the best classification algorithm should consume the least processing time. A standard measurement with the experimental setup is used to calculate the processing time. The processing time is calculated using the formula where is the overall processing time, is the process starting time and is the process ending time. The average processing time is calculated as where is the number of records processed.
The measured average processing times are given in Table 7. Average Processing Time (mS)
Data Chunk
GERSV M
SCPF RF
ISMADC GA
MTEB C
BSFR
N ELAC
1 1938 2011 1928 1832 1570 1047
2 1977 2010 1930 1835 1576 1090
3 1960 1961 1926 1800 1586 1068
4 1956 1960 1894 1848 1526 1088
5 1973 1970 1888 1791 1573 1085
6 1946 2022 1873 1788 1537 1094
7 1948 1980 1932 1837 1534 1046
8 1930 2003 1920 1823 1526 1037
9 1929 1948 1931 1822 1549 1048
10 1943 1952 1891 1816 1533 1066 Table 7: Processing Time (mS)
Figure 12: Average Processing Time
Minimum, Average and Maximum processing times of ELAC are 1037mS, 1067mS and 1094mS. Processing Time averages of SCPFRF, GERSVM, ISMADCGA, MTEBC, BSFRN and ELAC are 1982mS, 1950mS, 1911mS, 1819mS, 1551mS and 1067mS given in slower to faster order. The average processing speed comparison graph is given in Figure 12.
7. CONCLUSION
ASD subgroup identification using gene sequences is one of the essential as well as challenging process. A dedicated classification procedure is introduced in this work which can identify ASD subgroups with higher Accuracy, Sensitivity and Specificity. The introduction of AVTL gives a boost in the processing speed which reflects in the experiment result. Many ASD victims will be beneficiaries if this procedure is applied into real-time practice. The practical complexity is also very less due to the possibility of non-invasive gene sequence collection from the stem cell during the babies’ birth. The highest recovery probability is also assured because of the earlier identification of the ASD subgroup among children.
REFERENCES
[1] Marieke W. M. Kuiper, Elisabeth W. M. Verhoeven and Hilde M. Geurts, "Stop Making Noise! Auditory Sensitivity in Adults with an Autism Spectrum Disorder Diagnosis: Physiological Habituation and Subjective Detection Thresholds" in Journal of Autism and Developmental Disorders Volume 49 Issue 5, Springer 2019, Pages: 2116–2128
[3] R M Cantor, L Navarro, H Won, R L Walker, J K Lowe and D H Geschwind, "ASD restricted and repetitive behaviors associated at 17q21.33: genes prioritized by expression in fetal brains" in Molecular Psychiatry Volume 23, Nature 2018, Pages: 993-1000
[4] EricDeneault, Sean H.White, Deivid C.Rodrigues, P.Joel Ross, Muhammad Faheem, Kirill Zaslavsky, Zhuozhi Wang, RoumianaAlexandrova, Giovanna Pellecchia, Wei Wei, Alina Piekna, Gaganjot Kaur, Jennifer L.Howe, Vickie Kwan, BhoomaThiruvahindrapuram, Susan Walker, AnathC.Lionel, Peter Pasceri and Stephen W.Scherer, "Complete Disruption of Autism-Susceptibility Genes by Gene Editing Predominantly Reduces Functional Connectivity of Isogenic Human Neurons" in Stem Cell Reports Volume 11 Issue 5, Elsevier 2018, Pages: 1211-1225
[5] Kristien Hens, Ilse Noens, Hilde Peeters and Jean Steyaert, "The ethics of patenting autism genes" in Nature Reviews Genetics Volume 19, Scientific Reports 2019, Pages: 247-248
[6] Chunlei Wang, Yi-Hsuan Pan, Yue Wang, Gene Blatt and Xiao-Bing Yuan, "Segregated expressions of autism risk genes Cdh11 and Cdh9 in autism-relevant regions of developing cerebellum" in Molecular Brain Volume 12 Article 40, BMC Springer Nature 2019, Pages: 1-13
[7] Jacob O. Kitzman, Matthew W. Snyder, Mario Ventura, Alexandra P. Lewis, RuolanQiu, LaVone E. Simmons, Hilary S. Gammill, Craig E. Rubens, Donna A. Santillan, Jeffrey C. Murray, Holly K. Tabor, Michael J. Bamshad, Evan E. Eichler and Jay Shendure1, "Non-invasive whole genome sequencing of a human fetus" in History of the Human Science - US National Library of Medicice National Institute of Health, PMC 2012, Pages: 1-18 [8] Tobias Rausch, Markus Hsi-Yang Fritz, Jan O Korbel
and Vladimir Benes, "Alfred: interactive multi-sample BAM alignment statistics, feature counting and feature annotation for long-and short-read sequencing" in Oxford Academic Bioinformatics Volume 35 Issue 14, ISCB 2019, Pages 2489-2491 [9] You Tang, Min Li, Jing Sun, Tao Zhang, Jicheng
Zhang and Ping Zheng, "TRCMGene: A two-step referential compression method for the efficient storage of genetic data" in PLOS ONE Volume 13 Issue 11, Pages: 1-12
[10]Lei Chen, Xiao Yong Pan, Yu-Hang Zhang, Min Liu, Tao Huang and Yu-Dong Cai, "Classification of Widely and Rarely Expressed Genes with Recurrent Neural Network" in Computational and Structural Biotechnology Journal Volume 17, Elsevier 2019, Pages: 49-60
[11]Xia-an Bi, Yingchao Liu, Qi Sun, Xianhao Luo, Haiyan Tan, Jie Chen and Nianyin Zeng, "The Genetic-Evolutionary Random Support Vector Machine Cluster Analysis in Autism Spectrum Disorder" in IEEE Access Volume 7, IEEE 2019, Pages: 30527-30535
[12]E.Feczko, N.M.Balba, O.Miranda-Dominguez, M.Cordovaa, S.L.Karalunas, L.Irwin, D.V.Demeter, A.P.Hill, B.H.Langhorst, J.Grieser Painter, J.Van
Santen, E.J.Fombonne, J.T.Nigg, and D.A.Fair, "Subtyping cognitive profiles in Autism Spectrum Disorder using a Functional Random Forest algorithm" in NeuroImage Volume 172, Elsevier 2018, Pages: 674-688
[13]Muhammad Asif, Hugo F.M.C. Martiniano, Ana Rita Marques, João Xavier Santos, Joana Vilela, Celia Rasga, Guiomar Oliveira, Francisco M. Couto and Astrid M. Vicente, ―An integrative systems medicine approach to delineate complex genotype-phenotype associations in Autism Spectrum Disorder" in bioRxiv Cold Spring Harbor Laboratory, CSH 2018, Pages: 1-26
[14]Daniel P. Howsmon, Troy Vargason, Robert A. Rubin, Leanna Delhey, Marie Tippett, Shannon Rose, Sirish C. Bennuri, John C. Slattery, Stepan Melnyk, S. Jill James, Richard E. Frye and Juergen Hahn, "Multivariate techniques enable a biochemical classification of children with autism spectrum disorder versus typically‐developing peers: A comparison and validation study" in Nioengineering Translational Medicine, AIChE 2019, Pages: 156-165 [15]Marlena Duda, Hongjiu Zhang, Hong-Dong Li, Dennis P. Wall, Margit Burmeister and Yuanfang Guan, "Brain-specific functional relationship networks inform autism spectrum disorder gene prediction" in Translational Psychiatry Volume 8 Article 56, Nature Communications 2018, Pages: 1-9
[16]Das, J. Li, R. Zhao and Y. Gong, "Advancing Connectionist Temporal Classification with Attention Modeling" in IEEE International Conference on Acoustics, Speech and Signal Processing (ICASSP), Calgary, IEEE 2018, Pages: 4769-4773
[17]Jia Xin Low and Keng Wah Choo, "Classification of Heart Sounds Using Softmax Regression and Convolutional Neural Network" in Communication Engineering and Technology, ACM DL 2018, Pages: 18-21
[18] https://www.ncbi.nlm.nih.gov/projects/gap/cgi-bin/variable.cgi?study
_id=phs000267.v5.p2&phv=161300
[19]https://www.ncbi.nlm.nih.gov/IEB/ToolBox/SDKDOC S/CORELIB. HTML#_Introduction
[20]Sven Amann, Sebastian Proksch, Sarah Nadi and Mira Mezini, A Study of Visual Studio Usage in Practice" in IEEE 23rd International Conference on Software Analysis, Evolution, and Reengineering (SANER), IEEE - 2016, pp. 1 – 11