IJSRR, 8(2) April. – June., 2019 Page 4923
Research article
Available online www.ijsrr.org ISSN: 2279–0543
International Journal of Scientific Research and Reviews
A Study on Anti-Microbial Activity of Selected Medicinal Plants to
Finish Non-woven for the Application of Feminine Hygiene Product
Decoding the Negative Working Capital in the FMCG Sector :
The Case of Nestlé Global
Gurmani Chadha
Assistant Professor, Jagannath International Management School Affiliated to Guru Gobind Singh Indraprastha University Kalkaji, New Delhi, India
Email: [email protected] Mob. No.: 9811770053
ABSTRACT:
Working capital decisions are vital for the survival as well as for the smooth functioning of business. Optimal working capital should be achieved by the firm to avoid both under investment and over investment in current assets. Major research has been carried out in finance on the relationship between working capital management and its impact on profitability but there is little research available in context of negative working capital and its impact on the firm’s returns. This paper aims to investigate the negative working capital trend in the FMCG sector by taking the case of Nestlé Global in an attempt to explore if negative working capital is a sure shot reflection of inefficiency of a firm or is rather surprisingly a reflection of the efficiency of the firm. This paper will help to clear the minds of investors who shall after reading this paper will start perceiving firms with negative working capital in positive light instead of shunning such firms on grounds of illiquidity. This paper signals that negative working capital firms may in reality be rather good investment decisions of investors and provides logical justifications for the same. The paper in fact discusses how a firm even with low liquidity levels can exist as not only a major player in its industry but can also be flourishing in terms of its returns.
KEYWORDS
- negative working capital, efficiency, liquidity, profitability.*
Corresponding author:
Gurmani Chadha
Assistant Professor,
Jagannath International Management School
Affiliated to Guru Gobind Singh Indraprastha University Kalkaji, New Delhi, India
IJSRR, 8(2) April. – June., 2019 Page 4924
INTRODUCTION
Working capital is the difference between the current assets and the current liabilities of the firm. Working capital is used as a measure to gauge the liquidity of a firm.
Working capital management decisions are short term investment decisions and encompass one of the most important decisions a firm has to take. It reflects the ability of the firm to meet its short terms debt and its operational expenses1.The main objective of a firm is to increase the market value and working capital management affects profitability of the firm, its risk and thus its value.2A tradeoff between liquidity and profitability is required to be made to achieve the optimal amount of working capital the firm would need for its smooth functioning3. A large amount of working capital leads to ample amount of funds for the day to day operations of the firm which satisfies the liquidity parameter but at the same time implies loss of profitability due to presence of excess funds for the firm. The firm would have idle funds which it could in fact have been invested by the firm elsewhere and earned returns. Thus huge amount of working capital ensures liquidity but leads to loss of opportunity for profitable investments.
Low amount of working capital on the other hand leads to risks of incapability to meet day to day expenses which in turn tarnish the short term liquidity of the firm and may even lead to eventual insolvency of the firm.
Thus it is extremely crucial for the firm to determine the appropriate amount of working capital.
There are no ideal working capital amounts that a firm needs to maintain. It depends on the company needs. But in general positive working capital is considered to be the parameter for investing in a firm since it indicates that the firm is capacitated to meet its daily expenses. Negative working capital would thus be perceived negatively by an investor as it would reflect lack of liquidity in the firm.
IJSRR, 8(2) April. – June., 2019 Page 4925
LITERATURE REVIEW
Lazaridis and Tryfonidis4 probed into the relation between corporate profitability and working capital management. The results of their research showed that there is statistical significance between profitability which was gauged through gross operating profit and the cash conversion cycle.
Chakraborty5 in his study based on Indian Pharmaceutical firms analysed the relationship between working capital and profitability and concluded two notions one that stated that there may be an inverse relation between working capital and profitability and another notion which stated that working capital may in fact be indispensable for a firm’s profitability.
Ramachandran and Janakiraman6 explored the relationship between working capital management efficiency and EBIT of the Indian paper industry. The study concluded that cash conversion cycle and inventory days negatively correlated with EBIT but accounts payable days and accounts receivable days were positively correlated with EBIT.
Panigrahi, A.K.7 analysed the relationship between liquidity, profitability and risk of bankruptcy. It concluded that Wal-Mart with negative working capital was able to maintain a good public image and earn good profits and on the other hand a firm such as ACC Limited despite having adequate amount of working capital was running a risk of insolvency.
OBJECTIVES OF THE STUDY
The objective of the study is to analyse whether negative working capital is necessarily synonymous with poor returns and activity of a firm or is rather an indication of efficiency of a firm by analysing 10 year data of a major player in the FMCG Sector – Nestlé Global.
The secondary objective will be to investigate the link between inventory days and receivable days with payable days and draw conclusions about the efficiency of the firm from the cash conversion cycles.
RESEARCH METHODOLOGY
The present study has been done from secondary sources. The financial statements have been taken from Nestlé Globe’s website. Microsoft excel tools and ratio analysis has been used to examine and investigate the financial performance of the firm and establish working capital trends.
LIMITATIONS OF STUDY
IJSRR, 8(2) April. – June., 2019 Page 4926
The consideration of one firm may lead to conclusions that may not be true for all the firms across industries.
COMPANY PROFILE
The Swiss company Nestlé S.A. was rated as the world’s largest fast moving consumer goods company, in terms of its sales amounting to CHF 91.4 billion in 2018 coupled with an organic growth rate of 3%. It is headquartered in Vevey, Switzerland and employed approximately 323,000 people worldwide in 2018. The product portfolio encompasses beverages such as powdered and liquid beverages or water (Nestlé Waters), to baby and health foods (Nestlé Nutrition) and sweets and snacks (Nestlé confectionery sector). As a globally operating company, Nestlé serves a large variety of different consumer markets and regions around the world.
With a 44.9% market share in America, 29.4% in Europe, Middle East and North Africa and a 22.7% market share in Asia, Oceania and sub-Saharan Africa Nestlé Global is a major player in the FMCG sector around the world.8
ANALYSIS AND INTERPRETATION
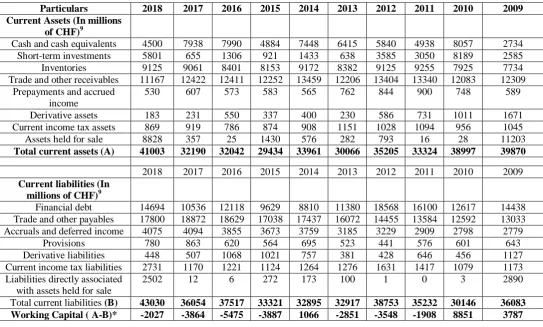
Table 1- Working Capital Calculation of Nestlé Global from 2009-2018
Particulars 2018 2017 2016 2015 2014 2013 2012 2011 2010 2009 Current Assets (In millions
of CHF)9
Cash and cash equivalents 4500 7938 7990 4884 7448 6415 5840 4938 8057 2734 Short-term investments 5801 655 1306 921 1433 638 3585 3050 8189 2585 Inventories 9125 9061 8401 8153 9172 8382 9125 9255 7925 7734 Trade and other receivables 11167 12422 12411 12252 13459 12206 13404 13340 12083 12309
Prepayments and accrued income
530 607 573 583 565 762 844 900 748 589
Derivative assets 183 231 550 337 400 230 586 731 1011 1671 Current income tax assets 869 919 786 874 908 1151 1028 1094 956 1045 Assets held for sale 8828 357 25 1430 576 282 793 16 28 11203
Total current assets (A) 41003 32190 32042 29434 33961 30066 35205 33324 38997 39870
2018 2017 2016 2015 2014 2013 2012 2011 2010 2009
Current liabilities (In millions of CHF)9
Financial debt 14694 10536 12118 9629 8810 11380 18568 16100 12617 14438 Trade and other payables 17800 18872 18629 17038 17437 16072 14455 13584 12592 13033 Accruals and deferred income 4075 4094 3855 3673 3759 3185 3229 2909 2798 2779
Provisions 780 863 620 564 695 523 441 576 601 643 Derivative liabilities 448 507 1068 1021 757 381 428 646 456 1127 Current income tax liabilities 2731 1170 1221 1124 1264 1276 1631 1417 1079 1173 Liabilities directly associated
with assets held for sale
2502 12 6 272 173 100 1 0 3 2890
Total current liabilities (B) 43030 36054 37517 33321 32895 32917 38753 35232 30146 36083 Working Capital ( A-B)* -2027 -3864 -5475 -3887 1066 -2851 -3548 -1908 8851 3787
IJSRR, 8(2) April. – June., 2019 Page 4927
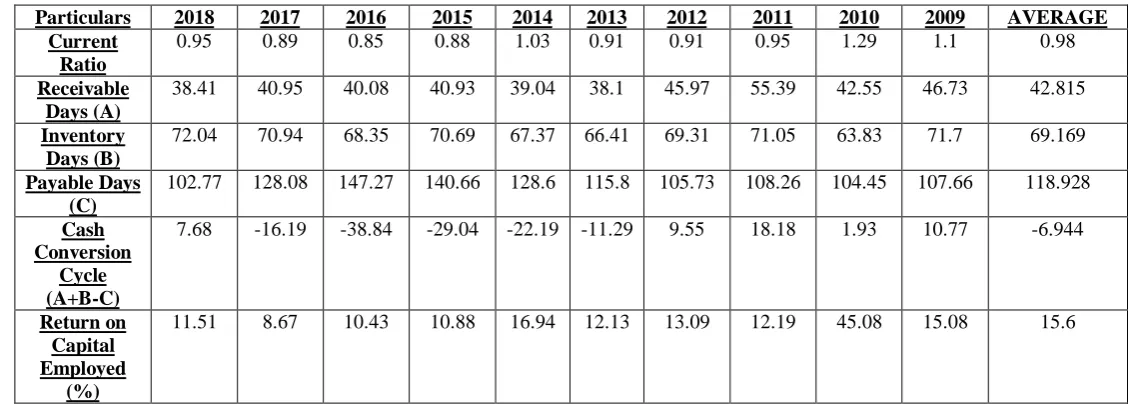
Table 2 - Gauging the Working Capital Management Efficiency10
Particulars 2018 2017 2016 2015 2014 2013 2012 2011 2010 2009 AVERAGE Current
Ratio
0.95 0.89 0.85 0.88 1.03 0.91 0.91 0.95 1.29 1.1 0.98
Receivable Days (A)
38.41 40.95 40.08 40.93 39.04 38.1 45.97 55.39 42.55 46.73 42.815
Inventory Days (B)
72.04 70.94 68.35 70.69 67.37 66.41 69.31 71.05 63.83 71.7 69.169
Payable Days (C)
102.77 128.08 147.27 140.66 128.6 115.8 105.73 108.26 104.45 107.66 118.928
Cash Conversion
Cycle (A+B-C)
7.68 -16.19 -38.84 -29.04 -22.19 -11.29 9.55 18.18 1.93 10.77 -6.944
Return on Capital Employed
(%)
11.51 8.67 10.43 10.88 16.94 12.13 13.09 12.19 45.08 15.08 15.6
Source – www.morningstar.com
CURRENT RATIO = CURRENT ASSETS / CURRENT LIABILITIES
RECEIVABLE DAYS = ACCOUNTS RECEIVABLE/TOTAL CREDIT SALES X Days in a year
INVENTORY DAYS = AVERAGE INVENTORY/COST OF GOODS SOLD X Days in a year
PAYABLE DAYS = ACCOUNTS PAYABLES/TOTAL CREDIT PURCHASES X Days in a year
CASH CONVERSION CYCLE = RECEIVABLE DAYS+ INVENTORY DAYS- PAYABLE DAYS
RETURN ON CAPITAL EMPLOYED = EBIT/CAPITAL EMPLOYED X 100
Graph.1 - Working Capital of Nestlé Global from 2009-2018
-8000 -6000 -4000 -2000 0 2000 4000 6000 8000 10000
2018 2017 2016 2015 2014 2013 2012 2011 2010 2009 Working Capital of Nestlé Global of Nestlé Global
IJSRR, 8(2) April. – June., 2019 Page 4928
Graph.2 - Cash Conversion Cycles of Nestlé Global from 2009-2018
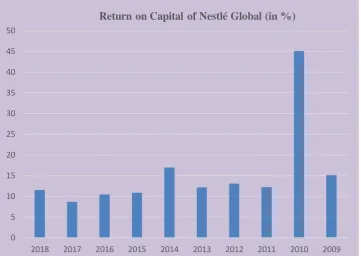
Graph.3 - Return on Capital of Nestlé Global from 2009-2018
Table 1 clearly indicates the negative working capital trend of Nestlé Global. Out of the 10 years being analyzed from 2009-2018, seven out of the ten years reflect a negative working capital situation as can be seen in Graph 1.
Table 2 analysis helps us investigate whether the negative working capital is an absolute conclusion of poor returns and managerial inefficiency.
-50 -40 -30 -20 -10 0 10 20 30
2018 2017 2016 2015 2014 2013 2012 2011 2010 2009
Cash Conversion Cycles from 2009-2018 (in days)
0 5 10 15 20 25 30 35 40 45 50
2018 2017 2016 2015 2014 2013 2012 2011 2010 2009
IJSRR, 8(2) April. – June., 2019 Page 4929
In the case of Nestlé Global, the story seems contradictory. Even though the working capital is negative and the current ratio is far from the ideal ratio 2:1 indicating low liquidity levels the return on capital employed remains rather more than satisfactory averaging to 15.6%.Graph 3 represents the return on capital returns from 2009-2018.
The receivable days indicate the time taken by debtors to pay their dues which for Nestlé Global averages to approximately 43 days. The inventory days indicate the time taken by inventory to convert into sales which averages to approximately 69 days for Nestlé Global.
The payable days reflect the credit period that a firm gets before it is required to pay its own dues to its creditors. This in case of Nestlé Global approximates to 119 days.
This means that it takes a total of 112 days (43 receivables days + 69 inventory days) for Nestlé Global to convert its receivables and inventory into cash but it has to pay its creditors and other payables in 119 days. This indicates that receivables and inventory themselves can finance the firms short term debts signaling the firm is not required to hold too many current assets for its day to day operations.
The inventory and receivable turnover is so high that the cash from it can directly be channelized to pay the creditors of the firm. The firm thus earns cash much before it has to give cash from its own operations.
No doubt the average cash conversion cycle of Nestlé Global is approximately 7 days (negative). A negative cash conversion cycle signals that revenue is being generated from customers before it has to pay to its suppliers indicating high efficiency levels. It can be seen in Graph 2 that from 2009-2018 the cash conversion cycles of Nestlé Global have remained mostly negative.
OBSERVATIONS AND CONCLUSION
Negative working capital of Nestlé Global indicates that the firm is in fact self-financing. Negative working capital indicates high level of efficiency of the firm. The fact that receivables and inventory would be realized even before the firm’s own liability to pay arises explains the self-funding concept.
The ability to self-finance directly means less dependence on outside financing sources and thus lowers costs of financing. Considering Nestlé Global is one of the top FMCG Companies globally it would also use its potential of fast moving products to push its financing costs further down by negotiating low interest rates on grounds of low risk and stable investment. This bargaining power is reflected in the prolonged payable days period.
IJSRR, 8(2) April. – June., 2019 Page 4930
appreciate its efficiency. Negative working capital can thus signal positive performance of a firm. This cannot be extended to all sectors but in a cash oriented FMCG firm this might be the right conclusion to draw in. Investors thus need to broaden their analysis of a company as a firm with negative working capital may in fact be a good investment bet for them despite failing the liquidity test.
Thus low liquidity may not be a direct signal of inefficiency or poor returns of firm. The example of Nestlé Global presented in this paper is the testimony to this fact.
The study thus concludes that lack of liquidity does not necessarily imply poor profitability. A firm with low liquidity levels like in the case of Nestlé Global can in fact generate high returns and at the same time be rather a major player in the industry with a good public image.
REFERENCES
1. Dr. R.P Rustagi, "Financial Management", Sixth revised Edition, Taxmann, New Delhi, 2018; 6(e):238-239.
2. Smith, K.,”Profitability versus Liquidity Tradeoffs in working capital management”, Readings on the Management of Working Capital, West publishing company, St Paul, MN USA,1980;549-62.
3. M Y Khan and P K Jain, "Financial Management", Tata Mcgraw Hill publishing company, New Delhi,2017;7(e):13.3-13.4
4. Lazaridis and Tryfonidis,“Relationship between Working Capital Management and Profitability of Listed Companies in the Athens Stock Exchange”,Journal of Financial Management and Analysis,2006;Vol.19:25-26.
5. Chakraborty, K.,” Working Capital and Profitability: An Empirical Analysis of Their Relationship with Reference to Selected Companies in the Indian Pharmaceutical Industry”, The ICFAI Journal of Management Research, 2008; Vol.34 :57-72.
6. Ramchandran, A. and Janakiraman M., “The Relationship between Working Capital Management Efficiency and EBIT”, Managing Global Transitions, 2009, No.1,Spring; Vol.7:61-74
7. Dr. Ashok Kumar Panigrahi, Dr. Anita Sharma,”Working Capital Management & Firm’s Performance: An analysis of selected Indian cement companies”, Asian Journal of Research in Business Economics & Management;3(9):115-130
IJSRR, 8(2) April. – June., 2019 Page 4931
9. Nestlé Global,” Annual reports of Nestlé Global”[online],2018, Available from URL -https://www.Nestlé.com/investors/annual-report
10.Morningstar.com, “Nestle SA Morningstar Rating under Key ratios”[online],2018,Available from