IJSRR, 7(4) Oct. – Dec., 2018 Page 682
Research article Available online www.ijsrr.org
ISSN: 2279–0543
International Journal of Scientific Research and Reviews
Correlation of Physical and Electrical Properties of Black Soil
Quadri F B
1 *Syed Ruhi N
2Gulam Rabbani
3Chishty S Q
41*
Dept of Physics, Dr. Rafiq Zakaria College For Women, Aurangabad, 431001,(M.S.),India.
2
Dept of C S, Maulana Azad College for Arts, Sci. and Comm., Aurangabad, 431001, (M.S.) India.
3
Director, Dr. Rafiq Zakaria Center for Higher Learning and Research, Aurangabad, 431001, (M.S.)India.
4
Head,Dept of Physics, Dr. Rafiq Zakaria College For Women, Aurangabad, 431001,(M.S.),India
ABSTRACT
Soil is a composite matter consisting of solids, liquid and some gases. Study of electrical parameters of it is of outmost importance as it enables one to understand the composition of it. Another importance of the study is to develop new and novel materials for the electronic industry. The study is also having much importance in exploring the new regions where its not possible to reach physically. Ten soil samples are collected from various agricultural lands and are dried and sieved. Dielectric parameters of these soil samples are studied at X-band microwave frequency of 9.8 GHz operating at TE10 mode at the room temperature. Further correlation with physical properties is
found out. Infinite sample method is used in the following study.
KEYWORDS: Dielectric constant, dielectric loss, Waveguide transmission method, Infinite sample method, porosity, VSWR.
*
Correspondence author
Mrs. Quadri F B
Department of Physics,
Dr.Rafiq Zakaria College for Women, Aurangabad- 431001(M. S.), INDIA.
IJSRR, 7(4) Oct. – Dec., 2018 Page 683
INTRODUCTION
Soil is one of the abundant natural resource that promotes the development of life on the earth. It takes thousands of years together to form a particular type of soil. It is home to a diversified form of microorganisms that form a part of the complex food chain. The soil is either rich or poor depending on the content of living microorganisms and soil organic matter. The soil that is rich in its content is termed as fertile soil that helps in the productivity of the crops. The Physio-chemical properties of the soil that includes its porosity, texture, bulk density, water holding capacity, pH, organic matter, available macronutrients and traces of micronutrients, etc1. These properties are very crucial in ascertaining the quality of the soil for agriculture 2. They can be managed and maintained to the desired value so that particular crop can be cultivated in the specific soil. Along with macronutrients like N, P and K, micro nutrients like B, Fe , Cu, Mn etc are also important in maintaining the quality of the soil for the growth of the crops. Excessive use of N P K fertilizers has reduced the concentration of the availability of micronutrients in the soil thereby affecting its health. An electrical property of soil includes its complex dielectric permittivity, relaxation time, ac conductivity3. These properties are the precursors to the composition of the soil. They give an insight on the physical properties as well as chemical composition of the soil. The moisture content of the soil is also indicated by the dielectric values so determined4. Dielectric properties are dependent on the physical and chemical properties of the soil 5,6 .
METHODOLOGY
Out of the different techniques that are available for the dielectric study of the materials, waveguide cell method is selected for the present experimental part of the work7. Ten samples in the form of the fertile soil from the agricultural land, is collected from different locations. The vertical depth, from where soil was collected from each location was kept constant as it is seen that soil varies in its composition from depth to depth. The collected soil samples were subjected to a gyrator to form a fine powder and then sieved from a standard sieve to cut down the particle size of the soil samples. This soil is the material under test now. This soil is analyzed for its physical properties from the agricultural office, Shanorwadi, Aurangabad.
IJSRR, 7(4) Oct. – Dec., 2018 Page 684
carried out at a room temperature of 300C. Dielectric parameters are function of frequency, temperature and humidity9 hence these variables were kept constant during the whole work duration.
EXPERIMENT SETUP
Figure 1.Block Diagram of the Experimental Setup
Using the formulae listed below, the electrical parameters are determined.
Ԑ ˈ =
+
…… (1)Ԑ ˈˈ = ………(2)
Where, K = 2П / λ g
λ g = guide wavelength
λ c = cutoff wavelength in the waveguide = 2a ,
a = wider dimension of the waveguide r = VSWR
D = Position of first minima with sample DR = position of first minima without sample
Klystron Power supply
Slotted Line & Probe carriage
Sample Holder
Matched load Termination Isolator
Crystal detector
IJSRR, 7(4) Oct. – Dec., 2018 Page 685
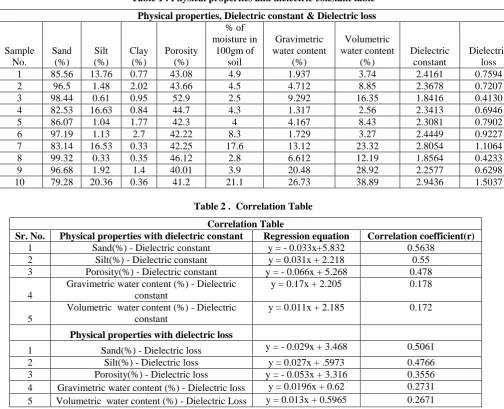
Table 1 . Physical properties and dielectric constant table Physical properties, Dielectric constant & Dielectric loss
Sample No. Sand (%) Silt (%) Clay (%) Porosity (%) % of moisture in 100gm of soil Gravimetric water content (%) Volumetric water content (%) Dielectric constant Dielectric loss
1 85.56 13.76 0.77 43.08 4.9 1.937 3.74 2.4161 0.7594
2 96.5 1.48 2.02 43.66 4.5 4.712 8.85 2.3678 0.7207
3 98.44 0.61 0.95 52.9 2.5 9.292 16.35 1.8416 0.4130
4 82.53 16.63 0.84 44.7 4.3 1.317 2.56 2.3413 0.6946
5 86.07 1.04 1.77 42.3 4 4.167 8.43 2.3081 0.7902
6 97.19 1.13 2.7 42.22 8.3 1.729 3.27 2.4449 0.9227
7 83.14 16.53 0.33 42.25 17.6 13.12 23.32 2.8054 1.1064
8 99.32 0.33 0.35 46.12 2.8 6.612 12.19 1.8564 0.4233
9 96.68 1.92 1.4 40.01 3.9 20.48 28.92 2.2577 0.6298
10 79.28 20.36 0.36 41.2 21.1 26.73 38.89 2.9436 1.5037
Table 2 . Correlation Table Correlation Table
Sr. No. Physical properties with dielectric constant Regression equation Correlation coefficient(r)
1 Sand(%) - Dielectric constant y = - 0.033x+5.832 0.5638
2 Silt(%) - Dielectric constant y = 0.031x + 2.218 0.55
3 Porosity(%) - Dielectric constant y = - 0.066x + 5.268 0.478
4
Gravimetric water content (%) - Dielectric constant
y = 0.17x + 2.205 0.178
5
Volumetric water content (%) - Dielectric constant
y = 0.011x + 2.185 0.172
Physical properties with dielectric loss
1 Sand(%) - Dielectric loss y = - 0.029x + 3.468 0.5061
2 Silt(%) - Dielectric loss y = 0.027x + .5973 0.4766
3 Porosity(%) - Dielectric loss y = - 0.053x + 3.316 0.3556
4 Gravimetric water content (%) - Dielectric loss y = 0.0196x + 0.62 0.2731
5 Volumetric water content (%) - Dielectric Loss y = 0.013x + 0.5965 0.2671
RESULTS AND DISCUSSIONS
The regression equations and regression coefficients are as shown in the above table. The obtained complex dielectric permittivity value were correlated with the physical properties of the agricultural soil under study. Least square fitting technique was used to draw a line and cover maximum points through the line. The regression equation and the regression coefficient is as shown in the table above.
i.
Sand with Dielectric constant and dielectric loss
IJSRR, 7(4) Oct. – Dec., 2018 Page 686
soil. The regression coefficient of sand particles with dielectric constant and dielectric loss are 0.5638 and 0.5061 respectively.
ii. Silt with Dielectric constant and dielectric loss
Silt particles of soil have smaller particle size as compared to sandy particles. The free space or open space filled with air molecules is less in case of silty soil. Dielectric constant and dielectric loss both have positive correlation with the percentage of silt present in the soil sample. The regression coefficient of percentage of silt in the soil with dielectric constant and dielectric loss is 0.55 and 0.4766 respectively.
iii. Porosity with Dielectric constant and Dielectric loss
Porosity of the is the measure of the open spaces or pores present in the soil. These open spaces are occupied with the air molecules whose dielectric constant is one. Hence with the increase in the percentage porosity the dielectric constant as well as dielectric loss of the dry soil decreases showing a negative correlation. The regression coefficient values are 0.478 and 0.3556 with dielectric constant and dielectric loss respectively.
iv. Gravimetric water content with Dielectric constant dielectric loss
The dielectric constant of dry soil at microwave frequencies is in the range of 2 – 4. The value of dielectric constant for pure water is 78. As the amount of water in the soil sample increases the dielectric parameters of the soil also increases. The dielectric values are the indicator of moisture present in the soil. There is a positive relation between these dielectric parameters and moisture content. The regression coefficient values are as shown in the table above.
v. Volumetric water content with Dielectric constant dielectric loss
Dielectric parameters depicts the amount of moisture present in the soil9. Many researchers have shown that dielectric constant of soil is dependent on the amount of water molecules present in the soil. Hence there is a positive correlation between the volumetric water content and dielectric constant as well as dielectric loss.
REFERENCES
1. Kekane SS, Chavan RP, Shinde DN et al. A review on physio-chemical properties of soil. Int. J. of Chem. Studies, 2015; 3(4): 29-32.
IJSRR, 7(4) Oct. – Dec., 2018 Page 687
3. Hoekstra P and Delaney A, Dielectric Properties of Soils at UHF and Microwave Frequencies.J. of Geophysical Res.,1974; 79(11): 1699-1708.
4. Wang JR and Schmugge TJ, An empirical model for complex dielectric permittivity of soils as a function of water content. IEEE Trans. on Geosci. and RemoteSensing,1980; 18:288-295.
5. Jackson TJ , Effects of Soil Properties on Microwave Dielectric Constants .Transportation Res. Record ,1987; 1119: 126-131.
6. Gadani DH,and Vyas AD , Measurement of complex dielectric constant of soils of Gujarat at X and C band microwave frequencies. Ind. J. of Radio and Space Physics, 2008;37:221-229. 7. Schumer M and Fox J, Handbook of microwave measurements. Polytechnic Press Institute,
New York,1963.
8. Chaudhary HC and Shinde VJ , Dielectric study of moisture laden soils at X- band microwave frequency.Int. J. of Phy. Sci., 2008; 3(3): 75-78.
9. Rajesh Mohan R, Binu Paula, Mridula S et al. Measurement of Soil Moisture Content at Microwave Frequencies.Int. Conf. on Info. and comm. Technologies (ICICT 2014), Procedia Comp. Sci. 2015; 46: 238-245.